20-F: Annual and transition report of foreign private issuers pursuant to Section 13 or 15(d)
Published on March 19, 2024
UNITED STATES SECURITIES AND EXCHANGE COMMISSION
Washington, D.C. 20549
FORM 20-F
(Mark One)
OR
For the fiscal year ended December 31 , 2023
OR
OR
Date of event requiring this shell company report
For the transition period from to
Commission file number: 001-41870

(Exact name of Registrant as specified in its charter) |
||||
Not Applicable |
||||
(Translation of Registrant’s name into English) |
(Jurisdiction of incorporation or organization) |
|||
Diversified Energy Company PLC
Tel: +1
|
||||
(Address of principal executive offices) |
(Name, Telephone, E-mail and/or Facsimile
number and Address of Company Contact
Person)
|
|||
Securities registered or to be registered, pursuant to Section 12(b) of the Act
Title of each class |
Trading Symbol(s) |
Name of each exchange on which registered |
||
London Stock Exchange |
Securities registered or to be registered pursuant to Section 12(g) of the Act: None
Securities for which there is a reporting obligation pursuant to Section 15(d) of the Act: None
Indicate the number of outstanding shares of each of the issuer’s classes of capital stock or common stock as of the close of the period covered by the annual report: N/A
Indicate by check mark if the registrant is a well-known seasoned issuer, as defined in Rule 405 of the Securities Act. Yes ¨ No þ
If this report is an annual or transition report, indicate by check mark if the registrant is not required to file reports pursuant to Section 13 or 15(d) of the Securities Exchange Act
of 1934. Yes ¨ No þ
Note — Checking the box above will not relieve any registrant required to file reports pursuant to Section 13 or 15(d) of the Securities Exchange Act of 1934 from their obligations
under those Sections.
Indicate by check mark whether the registrant (1) has filed all reports required to be filed by Section 13 or 15(d) of the Securities Exchange Act of 1934 during the preceding 12
months (or for such shorter period that the registrant was required to file such reports), and (2) has been subject to such filing requirements for the past 90 days. Yes þ No ¨
Indicate by check mark whether the registrant has submitted electronically every Interactive Data File required to be submitted pursuant to Rule 405 of Regulation S-T (§
232.405 of this chapter) during the preceding 12 months (or for such shorter period that the registrant was required to submit such files). Yes þ No ¨
Indicate by check mark whether the registrant is a large accelerated filer, an accelerated filer, a non-accelerated filer, or an emerging growth company. See definition of “large
accelerated filer,” “accelerated filer,” and “emerging growth company” in Rule 12b-2 of the Exchange Act.
¨ Large accelerated filer
|
¨ Accelerated filer
|
þ |
If an emerging growth company that prepares its financial statements in accordance with U.S. GAAP, indicate by check mark if the registrant has elected not to use the extended
transition period for complying with any new or revised financial accounting standards provided pursuant to Section 13(a) of the Exchange Act. ¨
Indicate by check mark whether the registrant has filed a report on and attestation to its management’s assessment of the effectiveness of its internal control over financial
reporting under Section 404(b) of the Sarbanes-Oxley Act (15 U.S.C. 7262(b)) by the registered public accounting firm that prepared or issued its audit report. ¨
If securities are registered pursuant to Section 12(b) of the Act, indicate by check mark whether the financial statements of the registrant included in the filing reflect the
correction of an error to previously issued financial statements. ¨
Indicate by check mark which basis of accounting the registrant has used to prepare the financial statements included in this filing:
¨ U.S. GAAP
|
þ |
¨ Other
|
If “Other” has been checked in response to the previous question indicate by check mark which financial statement item the registrant has elected to follow. Item 17 ¨ Item 18 ¨
If this is an annual report, indicate by check mark whether the registrant is a shell company (as defined in Rule 12b-2 of the Exchange Act). Yes ¨ No þ
(APPLICABLE ONLY TO ISSUERS INVOLVED IN BANKRUPTCY PROCEEDINGS DURING THE PAST FIVE YEARS)
Indicate by check mark whether the registrant has filed all documents and reports required to be filed by Sections 12, 13 or 15(d) of the Securities Exchange Act of 1934
subsequent to the distribution of securities under a plan confirmed by a court. Yes ¨ No ¨

2023
Annual Report
& FORM 20-F

Our Core Values
We CARE for each other, our communities, our industry
and our country!
|
COMMITMENT
—Seek opportunities for continuous learning
and improvement.
—Serve and support our teams and communities with
passion and enthusiasm.
ACCOUNTABILITY
—Act with personal and business integrity.
RESPECT
—Value the dignity and worth of all individuals.
—Respect environmental stewardship as we make
business decisions.
EXCELLENCE
—Commit to excellence in our performance.
—Exhibit courage of convictions, challenge the status quo
and strive to create value.
|
Report of Independent Registered Public Accounting
Firm
|
||
Additional Information (Unaudited)
|
||
We have prepared our financial statements and the notes thereto in accordance with IFRS as issued by the International Accounting Standards Board.
To provide metrics that we believe enhance the comparability of our results to similar companies, throughout this Annual Report & Form 20-F, we refer
to Alternative Performance Measures (“APMs”). APMs are intended to be used in addition to, and not as an alternative for the financial information
contained within the Group Financial Statements, nor as a substitute for IFRS. Within the APMs section located in the Additional Information section
within this Annual Report & Form 20-F, we define, provide calculations and reconcile each APM to its nearest IFRS measure. These APMs include
“adjusted EBITDA,” “net debt,” “net debt-to-adjusted EBITDA,” “total revenue, inclusive of settled hedges,” “adjusted EBITDA margin,” “free cash flow,”
“adjusted operating cost per Mcfe,” “employees, administrative costs and professional services,” and “PV-10.”

Diversified Energy Company PLC (the “Parent” or “Company”) and its
wholly owned subsidiaries (the “Group,” “DEC,” or “Diversified”) is an
independent energy company engaged in the production,
transportation and marketing of primarily natural gas.
Our proven business model creates sustainable value in today's natural gas market by investing in
producing assets, reducing emissions and improving asset integrity while generating significant, hedge-
protected cash flows. We Acquire, Optimize, Produce and Transport natural gas, natural gas liquids and oil
from existing wells then Retire our wells at the end of their life to optimally steward the resource already
developed by others within our industry, reducing the environmental footprint, while sustaining important
jobs and tax revenues for many local communities. While most companies in our sector are built to explore
and develop new reserves, we fully exploit existing reserves through our focus on safely and efficiently
operating existing wells to maximize their productive lives and economic capabilities, which in turn
reduces the industry’s footprint on our planet.
Key Achievements
Accretive Growth
Investment in the Tanos II
Central Region acquisition
totaled $262 million and
bolstered average daily
production by 8%.
|
Asset Monetization
Unlocked value on non-core
assets through the sale of
undeveloped acreage and
non-operated well interests
for total consideration of
$66 million.
|
U.S. Listing
Commenced trading on the
New York Stock Exchange
under the “DEC” ticker in
December 2023, expanding
access to U.S. investors and
improving trading liquidity.
|
||
Prioritizing Sustainability
Realized 33% year-over-year
reduction in Scope 1
methane intensity, achieving
our 2030 goal of cumulative
50% reduction in Scope 1
methane intensity (from
2020 baseline) and driven
largely by our focused and
continual emissions
detection, measurement and
mitigation programs in both
our Appalachia and Central
regions.
|
Financing
Executed the sale of certain
producing assets in
Appalachia to a special
purpose vehicle “SPV”,
generating proceeds of
approximately $192 million
through placement of an
asset-backed securitization at
the SPV, including the sale of
an 80% equity interest in the
SPV for $30 million.
|
Delivering Shareholder Value
Share buybacks and
distributed dividends
represent $179 million in
return of capital to
shareholders.
|
||
Cross Reference to Form 20-F
Pages |
||||
Part I |
||||
Item 1. |
Identity of Directors, Senior Management and Advisers |
N/A |
||
Item 2. |
Offer Statistics and Expected Timetable |
N/A |
||
Item 3. |
Key Information |
|||
A. |
[Reserved] |
|||
B. |
Capitalization and indebtedness |
N/A |
||
C. |
Reasons for the offer and use of proceeds |
N/A |
||
D. |
Risk factors |
|||
Item 4. |
Information on the Group |
|||
A. |
History and development of the Group |
|||
B. |
Business overview |
|||
C. |
Organizational structure |
181, Exhibit 8.1
|
||
D. |
Property, plants and equipment |
|||
Item 4A. |
Unresolved Staff Comments |
N/A |
||
Item 5. |
Operating and Financial Review and Prospects |
|||
A. |
Operating results |
|||
B. |
Liquidity and capital resources |
|||
C. |
Research and development, patents and licenses, etc. |
N/A |
||
D. |
Trend information |
|||
E. |
Critical accounting estimates |
|||
Item 6. |
Directors, Senior Management and Employees |
|||
A. |
Directors and senior management |
|||
B. |
Compensation |
|||
C. |
Board practices |
|||
D. |
Employees |
|||
E. |
Share ownership |
|||
F. |
Disclosure of a registrant’s action to recover erroneously awarded
compensation
|
N/A |
||
Item 7. |
Major Shareholders and Related Party Transactions |
|||
A. |
Major shareholders |
|||
B. |
Related party transactions |
|||
C. |
Interests of experts and counsel |
N/A |
||
Item 8. |
Financial Information |
|||
A. |
Consolidated Statements and Other Financial Information |
|||
B. |
Significant Changes |
N/A |
||
Item 9. |
The Offer and Listing |
|||
A. |
Offer and listing details |
|||
B. |
Plan of distribution |
N/A |
||
C. |
Markets |
|||
D. |
Selling shareholders |
N/A |
||
E. |
Dilution |
N/A |
||
F. |
Expenses of the issue |
N/A |
||
Pages |
||||
Item 10. |
Additional Information |
|||
A. |
Share capital |
N/A |
||
B. |
Memorandum and articles of association |
|||
C. |
Material contracts |
|||
D. |
Exchange controls |
|||
E. |
Taxation |
|||
F. |
Dividends and paying agents |
N/A |
||
G. |
Statement by experts |
N/A |
||
H. |
Documents on display |
|||
I. |
Subsidiary information |
N/A |
||
J. |
Annual report to security holders |
N/A |
||
Item 11. |
Quantitative and Qualitative Disclosures About Market Risk |
|||
Item 12. |
Description of Securities Other than Equity Securities |
|||
A. |
Debt securities |
N/A |
||
B. |
Warrants and rights |
N/A |
||
C. |
Other securities |
N/A |
||
D. |
American depositary shares |
N/A |
||
Part II |
||||
Item 13. |
Defaults, Dividend Arrearages and Delinquencies |
N/A |
||
Item 14. |
Material Modifications to the Rights of Security Holders and Use of Proceeds |
N/A |
||
Item 15. |
Controls and Procedures |
|||
Item 16. |
[Reserved] |
N/A |
||
Item 16A. |
Audit Committee Financial Expert |
|||
Item 16B. |
Code of Ethics |
|||
Item 16C. |
Principal Accountant Fees and Services |
|||
Item 16D. |
Exemptions from the Listing Standards for Audit Committees |
N/A |
||
Item 16E. |
Purchases of Equity Securities by the Issuer and Affiliated Purchasers |
N/A |
||
Item 16F. |
Change in Registrant’s Certifying Accountant |
N/A |
||
Item 16G. |
Corporate Governance |
N/A |
||
Item 16H. |
Mine Safety Disclosure |
N/A |
||
Item 16I. |
Disclosure Regarding Foreign Jurisdictions that Prevent Inspections |
N/A |
||
Item 16J. |
Insider Trading Policies |
N/A |
||
Item 16K. |
Cybersecurity |
|||
Part III |
||||
Item 17. |
Financial Statements |
N/A |
||
Item 18. |
Financial Statements |
|||
Item 19. |
Exhibits |
|||
DEC at a Glance
Our Assets
Our assets primarily consist of long-life, low-decline natural gas wells and gathering systems located within the Appalachian
Basin and Central Region of the U.S., providing opportunistic synergies in our operations. Our headquarters are located in
Birmingham, Alabama with operational and field offices located throughout the states in which we operate.
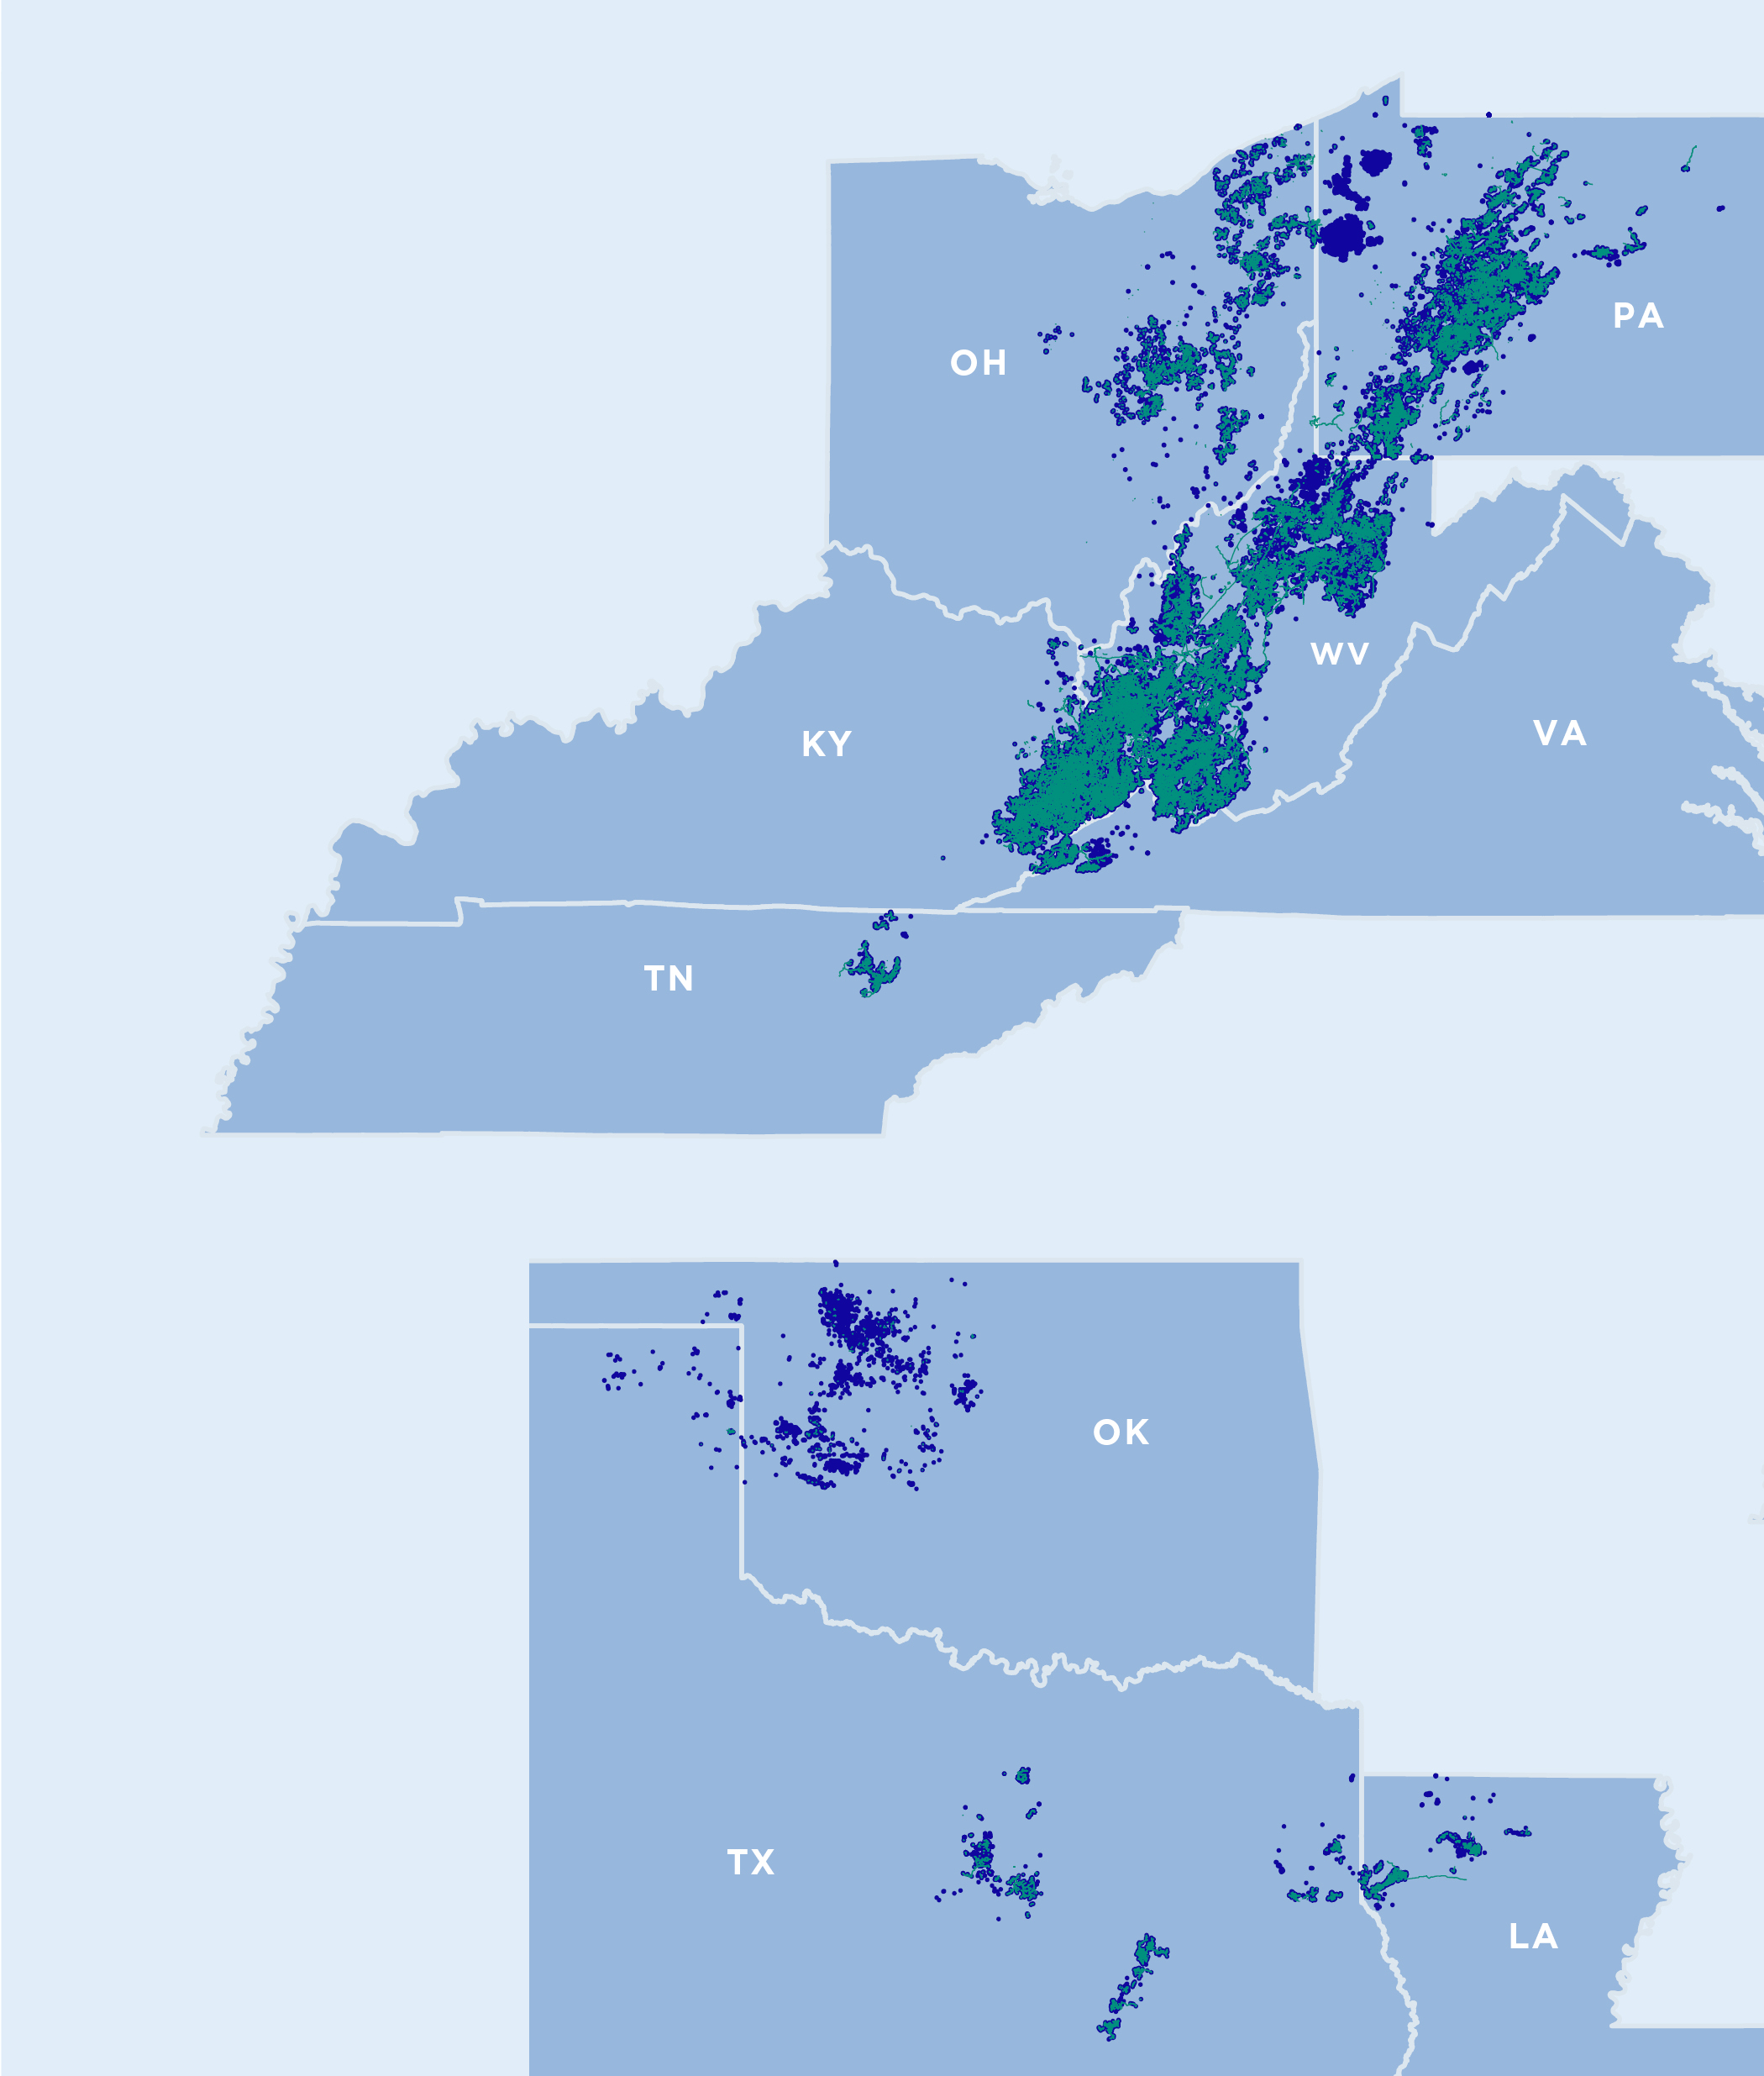
KEY
l Upstream assets
l Midstream assets
l States in which we operate
APPALACHIA ASSETS
CENTRAL ASSETS
Key Facts
PRODUCTION MIX
86%
natural gas
12%
NGLs
2%
oil
|
PRODUCTION
256,378
natural gas (MMcf)
5,832
NGLs (MBbls)
1,377
oil (MBbls)
|
PV-10 VALUE OF RESERVES
$2.1
billion(a)
3,849,946
MMcfe
|
MIDSTREAM SYSTEM
~17,700
miles
|
SCOPE 1 METHANE
EMISSIONS INTENSITY
0.8
MT CO2e/MMcfe
|
NO LEAK RATE ON
SURVEYED WELLS
~98%
Group-wide
|
AERIALLY SURVEYED
MIDSTREAM MILES
~10,000
miles
|
REPORTABLE SPILL
INTENSITY
0.08
oil & water per MBbl
|
NET
INCOME
$760
million
|
TOTAL
REVENUE
$868
million
|
ADJUSTED EBITDA
MARGIN(b)
52%
|
ADJUSTED
EBITDA(b)
$543
million
|
(a)Based on SEC pricing.
(b)Please refer to the APMs section in Additional Information within this Annual Report & Form 20-F for information on how these metrics
are calculated and reconciled to IFRS measures.
| |||
This page intentionally left blank.

Strategic
Report
Chairman’s Statement

On behalf of the Board of Directors, I am
pleased to share our financial and operational
results that reflect the hard work, dedication,
and focus of the entire Diversified team. Their
consistent execution of our strategy and
management initiatives has driven another year
of strong environmental, financial, and
operational performance.
Throughout 2023, we continued to focus on
cash flow generation, capital discipline, and
balance sheet management. This, together with
our resilient business model, means we have
been able to deliver strong results which have
benefited all stakeholders.
In addition, we are proud of the part we are
playing in responsibly providing the energy
needed for our communities and country, as
well as meeting growing demand beyond
the U.S.
Since 2017, Diversified’s demonstrated track
record has delivered more than $800 million in
returns to the Group’s stockholders including
approximately $700 million in cash dividends
paid and declared, along with approximately
$110 million in share repurchases.
The Board’s dedication to shareholder returns
remains an absolute priority. We continuously
refine the capital allocation framework in order
to balance debt reduction, sustainable fixed
dividends, strategic share repurchases and
accretive acquisitions. We are proposing a final
fourth quarter 2023 dividend of $0.29 which
allows us to focus our cash flows on what we
believe are the highest and best uses of capital.
We are confident that this new level will be
sustainable, and will also allow for continued
debt reduction, more flexibility for alternative
capital returns, and for funding future growth.
We believe that our share price has been
significantly undervalued for some while and
has been affected by the structural de-
equitization of the UK share market. We have,
therefore, also authorized a share buyback
program, which we believe will be an effective
use of our capital and will further increase total
shareholder returns.
Part of our business model and strategy
revolves around the continued addition of
growth opportunities. We identified a listing on
the New York Stock Exchange, in addition to
the London listing, as an opportunity that could
help to add significant value and were pleased
to deliver on that key milestone this year. We
view the NYSE listing as a great opportunity to
expand access to U.S. investors and improve
trading liquidity. We continue to evaluate
opportunities to grow and to increasingly
make Diversified the “Right Company at the
Right Time.”
|
Another important part of our focused strategy
is to create value through sustainability and
stewardship. Over the past year, we have made
significant progress with our methane emissions
program, reducing emissions by over 33% from
2022 and achieving our 2030 goal meaningfully
ahead of schedule. We are proud that we
received recognition from the United Nations’
Oil & Gas Methane Partnership 2.0 (OGMP),
being awarded the Gold rating for the second
year. Our initiatives related to methane emission
reductions are of paramount importance, and it
gives us great confidence to see this recognized
by international bodies.
Operationally, we conducted over 246,000 leak
detection surveys using industry-leading and
proven detection equipment, and attaining a
zero emissions rate of approximately 98%,
proving the positive impact of our actions to
eliminate methane leaks. Next LVL Energy, our
asset retirement business, has continued to
grow and contribute significantly to safe and
efficient well retirements, retiring a total of 404
wells. This achievement included retiring a total
of 222 Diversified wells in 2023, significantly
exceeding state agreements. Additionally, our
partnership with states on their orphan well
programs resulted in 148 retired wells. We are
immensely proud of the material investments
we have made to lower our methane intensity,
and to safely retire wells, and we remain
focused on delivering continuous improvement.
The Board and its Committees continue to
operate effectively and are active in both
supporting and challenging strategic
discussions. There is an exceptional depth of
knowledge and diversity of thinking. We again
conducted a Board Performance Review during
2023 and will continue to ensure that we
comply with all governance guidelines.
As we look ahead to 2024 and beyond, I would
like to recognize the quality of the team we
have at Diversified, across the entire Group. I am
very grateful for their work and look forward to
future successes as a company in the years to
come. In particular, I would like to thank the
Executive Team, led by Rusty Hutson, Jr., who
navigated the team through a year that has
seen its share of broader challenges, notably an
unfavorable commodity price environment. I
also wish to express gratitude to our
shareholders, lenders, and other stakeholders
for their trust in our commitment to deliver
long-term sustainable value and their support
whilst we provide essential energy security and
continue to care for our communities.

David E. Johnson
Chairman of the Board
March 19, 2024
|
“
Together with our
resilient business
model, we have been
able to deliver strong
results which have
benefited all
stakeholders.

Chief Executive’s Statement
The fundamental need for natural gas is well-
cemented in our domestic and global energy
outlooks. Natural gas is the essential fuel to
tackling global challenges – from enhancing energy
security of the United States and allies around the
world to addressing the universally shared need for
reliable, affordable, and sustainable power, natural
gas demand remains strong.
It’s against this backdrop of rising global energy
demand, consolidation in the U.S. energy markets,
and enhanced expectations for sustainably
produced energy that the case for Diversified’s
stewardship business model sharpens. Thanks to
our approach – focused on acquiring, improving,
and retiring existing, long-life U.S. energy assets
and honed through two decades of field
experience – Diversified is the “Right Company at
the Right Time” to responsibly manage existing
domestic natural gas and oil production in a
manner that’s consistent with environmental
stewardship and a lower-carbon energy future.
We continue to aggressively pursue this mission
each and every day, and 2023 was no different.
From closing the Tanos II acquisition – which
increased our footprint in the Central Region and
aligned with our stewardship and sustainability
commitments – to ending the year with dual-listing
on the New York Stock Exchange, 2023 was a year
focused on execution against our core business
objectives.
Through our focused commitment to responsible
asset management, we continue to drive methane
intensities downward, while returning wells to
production and gaining operational efficiencies.
Compared to a 2020 baseline, upstream methane
intensity has fallen over 50%, achieving our 2030
goal meaningfully ahead of schedule, and we are
continuing to take aggressive steps to optimize
environmental performance across our operating
areas. By viewing asset retirement as a business
opportunity, Diversified’s Next LVL Energy
subsidiary is the largest well retirement company in
Appalachia. Our focus on asset retirement stands
out, with our dedicated teams responsibly retiring
404 wells in 2023 alone, as no other company is
addressing state orphaned and end-of-life wells
head-on like we are.
This focus on sustainability principles has been
validated on the domestic and global stage, with
sustained Gold standard designations from the
United Nation’s Oil and Gas Methane Partnership
2.0 (second year), attainment of the second-
highest MSCI ESG “AA” rating, and multiple
sustainability awards, to name a few. Last year’s
sustainability report detailing our proactive
approach took home the ESG Report of the Year
by the international ESG Awards 2023 for speaking
to “both head and heart,” while also receiving the
top category nomination from IR Magazine. I am
proud to see the hard work of our employees
recognized as industry leaders time and again.
We also continue to expand Diversified’s
community-giving culture in the communities
where we live and work, and we’re privileged to
strengthen our corporate commitments to
employees. We fully recognize none of this
progress would be possible without our 1,600+
diligent team who work every day to ensure
families across the United States have safe, clean,
and reliable energy resources.
|
In the year ahead, we are taking a renewed focus
on the values on which Diversified was founded:
investing in strategic, aligned acquisitions that
scale our model and deliver greater operational
efficiencies, taking proactive steps to ensure the
sustainability of assets, keeping costs low and de-
leveraging the balance sheet – all while returning
value to shareholders.
Diversified has set in motion its “Focus Five” in
order to demonstrate meaningful expansion of
free cash flow generation while growing the
company in a disciplined manner. That plan
consists of the following core objectives:
—Optimized cash flow generation
—Cost structure optimization
—Financial and operational flexibility
—Sustainability innovation
—Scale through accretive growth
I believe these principles will help differentiate the
Company among its peers in unlocking corporate
value throughout 2024 and into the future.
The Company has undertaken a reassessment of
its capital allocation strategy to weigh the
intrinsic value of the current share price level
against the historical practice of returning capital
through dividends. The Board and executive
management team have jointly evaluated a
number of potential scenarios to align the
dividend level with expected future capital
allocation needs, peer trends, current commodity
prices and current equity market dynamics.
The result of this assessment is the Board’s
realignment of capital allocation and is designed
to best position the Company to create long-term
shareholder value through the proper
combination of:
—Systematic debt reduction
—Fixed per-share dividend
—Strategic share repurchases
—Accretive strategic acquisitions
We are proud to be part of the solution to the
broader challenge of existing energy
infrastructure and to do our part in driving our
country’s energy, climate, and economic security
– and we couldn’t do it without our OneDEC team.
 Robert R. (“Rusty”) Hutson, Jr.
Chief Executive Officer
March 19, 2024
|
Diversified is the Right
Company at the Right
Time to responsibly
manage existing
domestic natural gas
and oil production in a
manner that’s
consistent with
environmental
stewardship and a
lower-carbon energy
future.
“
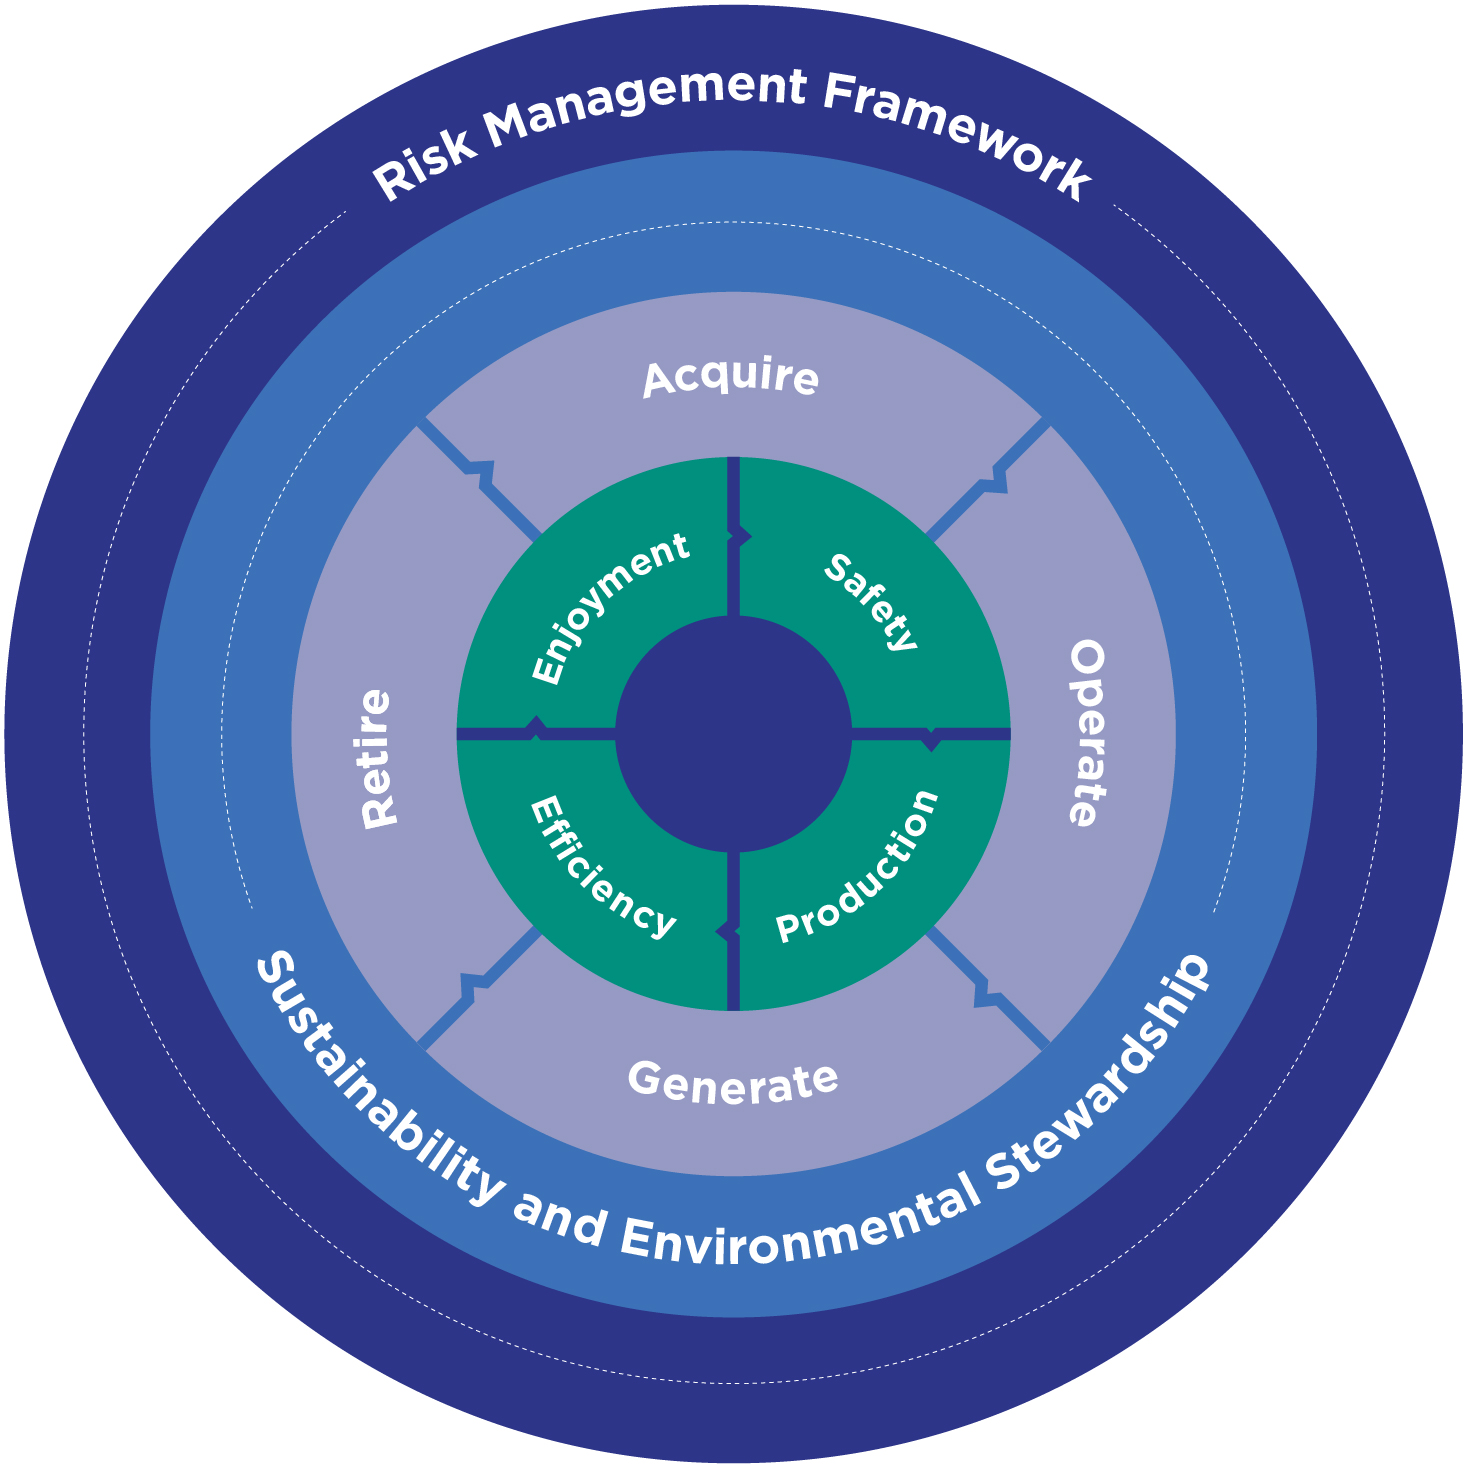
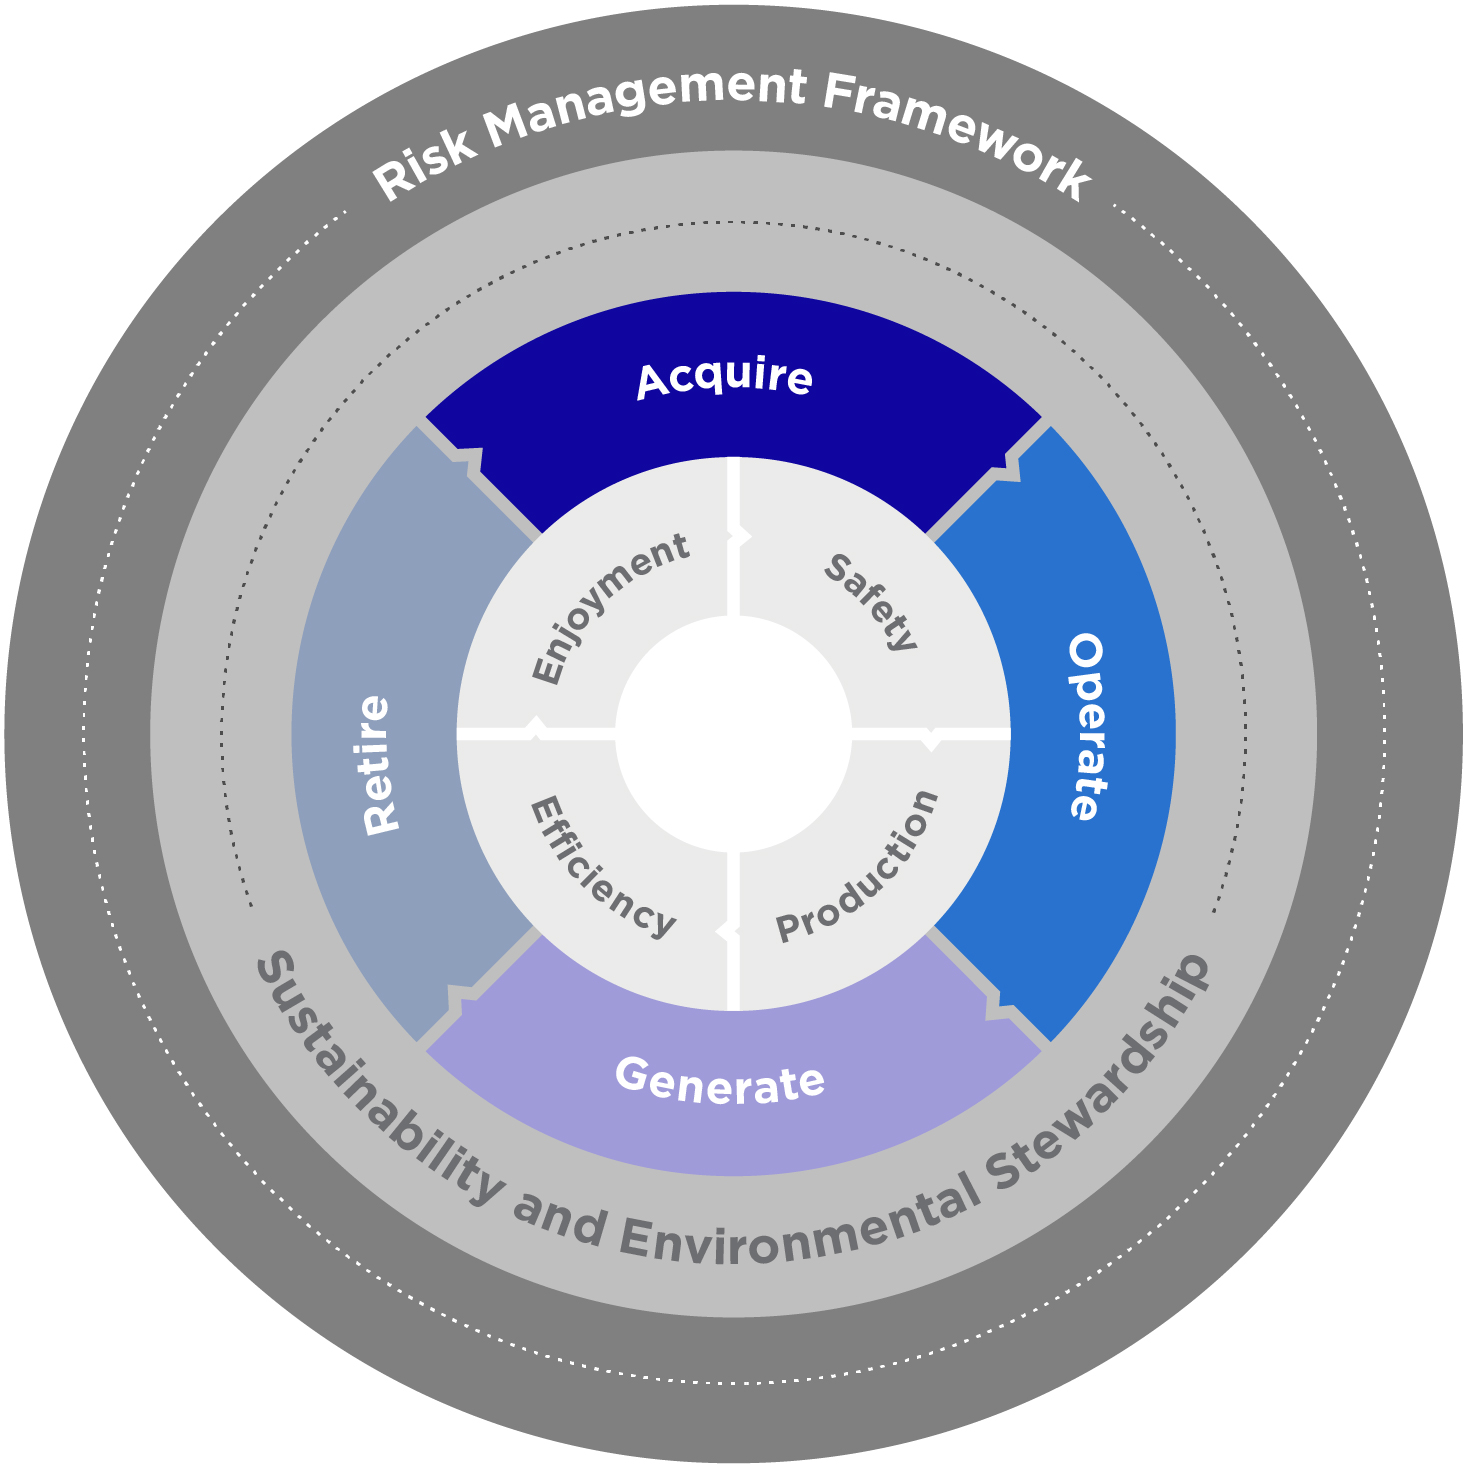
A Differentiated Business Model
1 |
 |
ACQUIRE |
|
We maintain a disciplined approach to evaluating
opportunities to ensure that we only pursue those
that possess a consistent asset profile. We target
existing long-life, stable assets with synergistic
opportunities that produce predictable and stable
cash flows, are value accretive, margin enhancing
and strategically complementary.
|
|||
2 |
 |
OPTIMIZE |
|
The primarily mature nature of the assets we
acquire provides us with a portfolio of low-cost
optimization opportunities. These optimization
activities, applied through our internally
developed SAM program, are strategically
important as they aid in offsetting natural
production declines, creating expense efficiency
and reducing our emissions.
|
|||
3 |
 |
PRODUCE |
|
Our culture makes the difference as our team of
industry veterans strive to efficiently produce as
many units as possible in a safe and
environmentally responsible manner, aligning both
environmental and financial best interests.
|
|||
4 |
 |
TRANSPORT |
|
We seek to acquire midstream systems into which
we are a large producer and more fully integrate
those assets into our upstream portfolio to provide
immediate and long-term synergies.
|
|||
5 |
 |
RETIRE |
|
We embrace our commitment to be a responsible
operator of existing assets. With safety and
environmental stewardship as top priorities, we
design our asset retirement program to
permanently retire wells that have reached the end
of their producing lives. During 2022, we made
investments that allowed us to meaningfully
expand our asset retirement capabilities through a
series of acquisitions that we believe have provided
us with the operational capacity to be a leader in
asset retirement.
|
|||
DAILY OPERATING PRIORITIES
|
|
Safety |
|
No compromises. Ensuring the care and well-being of
our employees, our families, our partners and
communities is our top priority.
|
 |
Production |
|
Every unit counts. Ensuring that every unit we
safely produce provides affordable and reliable
energy to our communities and generates value for
our shareholders.
|
 |
Efficiency |
|
Every dollar counts. Ensuring every dollar we spend
protects our employees and communities and grows
the investment of our shareholders.
|
 |
Enjoyment |
|
Have fun delivering great results. Ensuring our
company is an attractive place to work,
encouraging innovation and celebrating our
employees’ accomplishments.
|
 |
STRATEGY |
|
Acquire long-life stable assets
|
 |
Operate our assets in a safe, efficient and
responsible manner
|
 |
Generate reliable free cash flow
|
 |
Retire assets safely and responsibly
|
 |
 |
 |
||
Priorities |
Strategy |
Sustainability |
Risk |
see page 7 |
see page 11 |
see page 33 |
see page 79 |
Our business model and the corporate culture we cultivate is unique among the natural
gas and oil industry in that we do not engage in capital-intensive drilling and
development. Rather, our stewardship model focuses on acquiring existing long-life,
low-decline producing wells and, at times, their associated midstream assets, and then
efficiently managing the assets to improve or restore production, reduce unit operating
costs, reduce emissions and generate consistent free cash flow before safely and
permanently retiring those assets at the end of their useful lives.
| |||
 | |||
Execute Commodity Hedges
to Secure Healthy Margins
|
Protect our ability to provide
durable shareholder returns
|
Generate Reliable
Free Cash Flow
|
Maintain adjusted EBITDA
margins, low capital intensity
and low LOE per unit
|
Provide Durable
Shareholder Returns
|
Create value for our
shareholders via debt
reduction, fixed dividends,
strategic share repurchases
and accretive acquisitions
|
Maintain A Healthy
Balance Sheet
|
Maintain low leverage, ample
liquidity and access to
additional capital for
opportunistic growth
|


Geographic
Operating
Areas
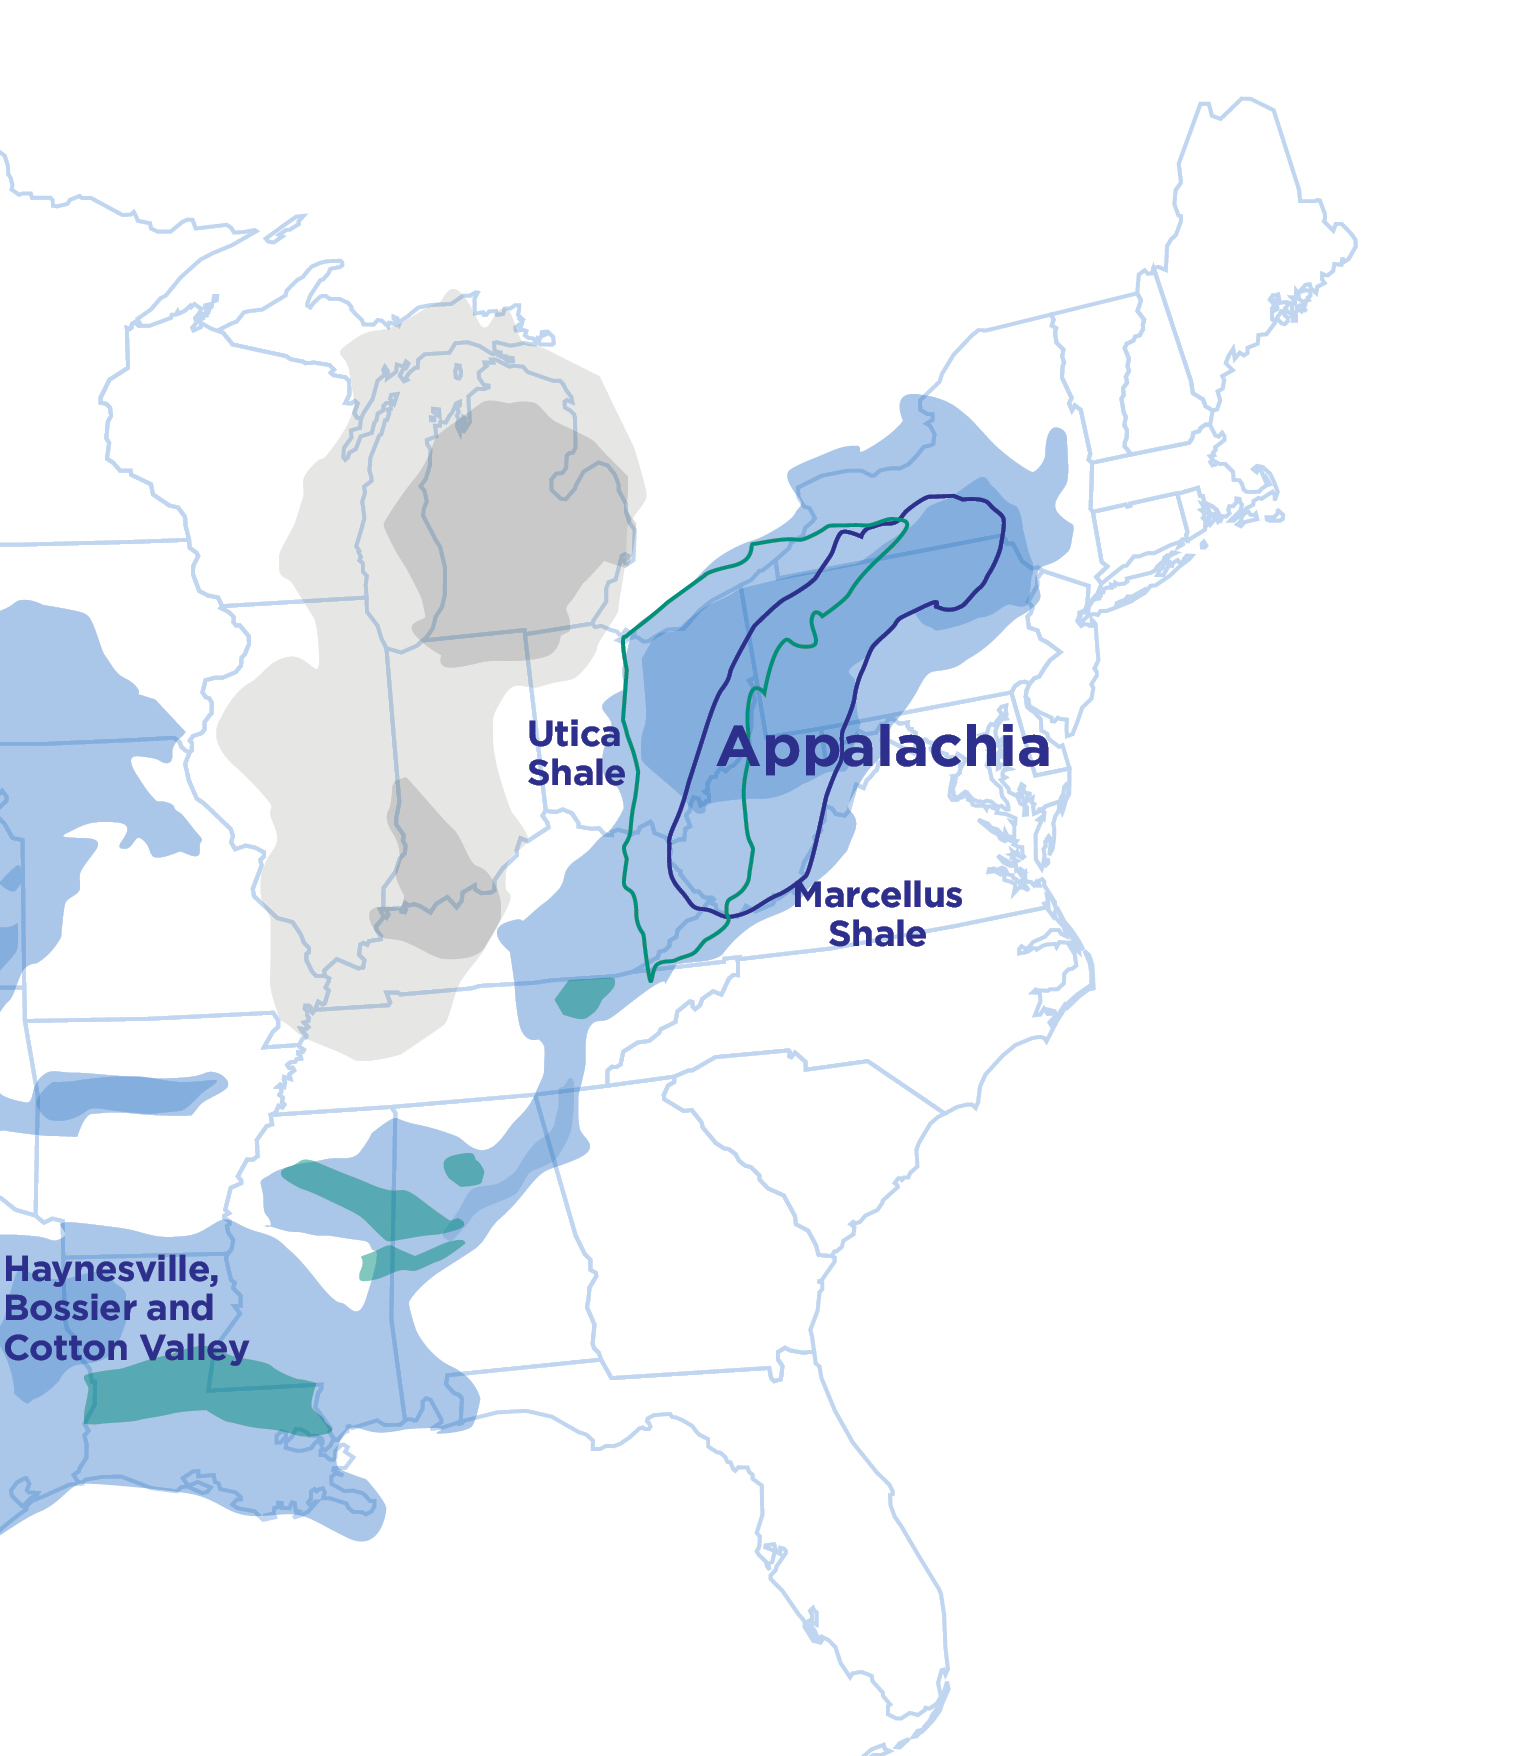
U.S. NATURAL GAS PLAYS
Our Operating Areas
CENTRAL REGION
Our Central Region includes parts of Texas, Louisiana and Oklahoma, and is home to a number of asset rich natural gas and oil
formations. We currently operate within Texas, Louisiana and Oklahoma in the following plays:
Haynesville, Bossier and Cotton Valley
While in a relatively similar geographic region of East Texas
and West Louisiana, the Bossier shale lies directly above the
Haynesville shale but beneath the Cotton Valley sandstones.
A key benefit to operations in this region is the ability to
access consistent natural gas pipeline transportation from
the wellhead to the Gulf Coast, an area of strong demand
and advantageous pricing. This access to strong pricing and
takeaway capacity has made it a desirable area for
developers and one of rapid growth, particularly in the
Haynesville, with Cotton Valley and Bossier viewed as more
mature. As the wells in this region continue to mature and
decline rates continue to shallow and become more
predictable, it will be a fertile ground for our
continued expansion.
Barnett
An original shale play in the U.S., the Barnett shale is located
in North Texas and is a geological formation rich in natural
gas. The Barnett is home to some of the first horizontal
drilling and hydraulic stimulation that occurred in the early
1990s, unlocking the U.S. shale revolution. For a time during
the early 2000s, the Barnett was the largest natural gas
producing shale play in the U.S. Though drilling in this area
has largely subsided, the maturity of the play with its now
vast portfolio of low decline rate wells makes this area
available for opportunities to complement our existing
mature portfolio through future acquisitions.
Mid Continent
The Mid Continent region stretches across Oklahoma, Kansas
and the Texas panhandle and is generally understood to
reference the Fayetteville, Woodford, Granite Wash,
Springer, Sycamore and Cana Woodford shale natural gas
plays along with numerous other conventional and
unconventional natural gas reservoirs in the Arkoma Basin,
Ardmore Basin and Anadarko Basin. This mature and
developed region has undergone a redevelopment
renaissance over the last several years through the use of
hydraulic stimulation and horizontal drilling. It is an asset rich
environment with an abundance of mature wells and
developed transportation infrastructure making it a valuable
complement to our current portfolio.
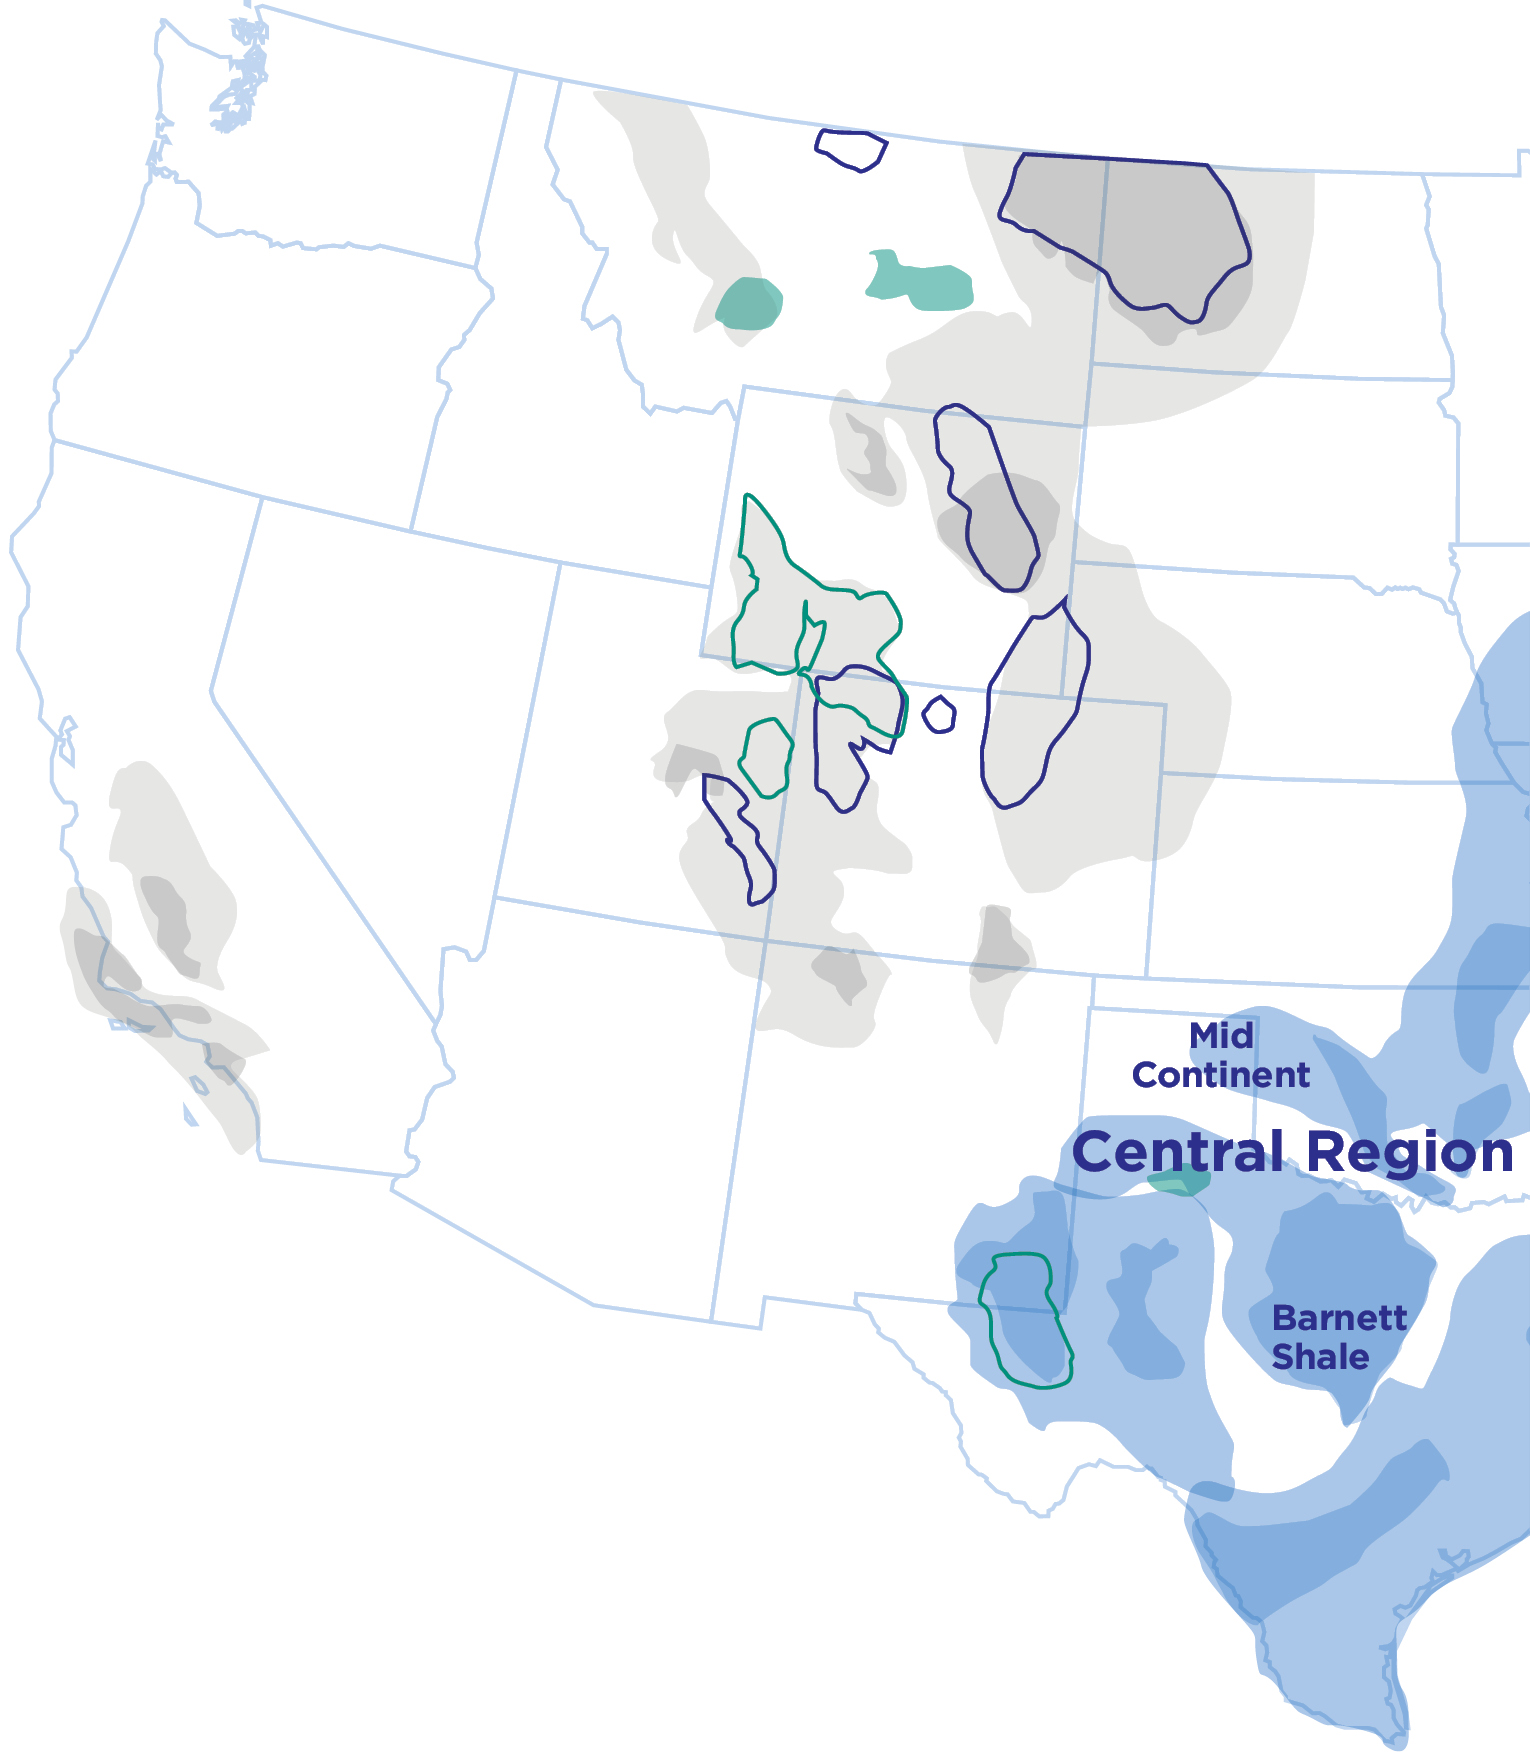
U.S. DRY SHALE GAS PRODUCTION
billion cubic feet per day
|
|
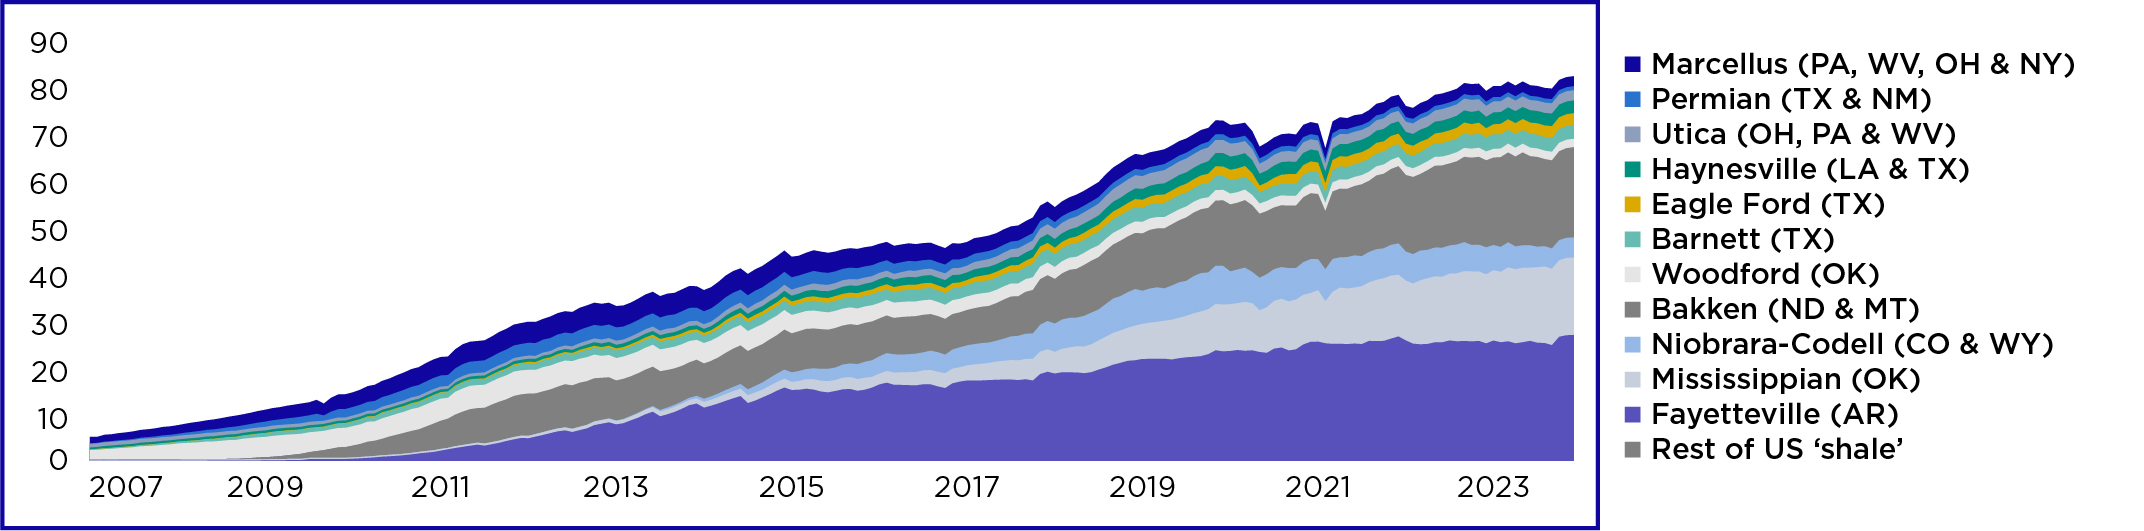 | |
Sources: Graph by the U.S. Energy Information Administration (“EIA”) based on state administrative
data collected by Enverus. Data are through December 2023. The EIA updated the factors it uses to
convert gross natural gas to dry natural gas based on the latest data. The update affected historical
production volumes from some formations. State abbreviations indicate primary state(s).
|
 |
 |
Current play - oldest play |
|
 |
Current play - intermedia depth/age play |
|
 |
Current play - shallowest/youngest play |
|
 |
Prospective play |
|
 |
Basin |
|
APPALACHIA
The Appalachian Basin spans
Pennsylvania, Virginia, West Virginia,
Kentucky, Tennessee and Ohio and
consists of two productive unconventional
shale formations, the Marcellus Shale and
the slightly deeper Utica Shale. Together
they accounted for 38% of all U.S. dry
natural gas production in 2023. Diversified
began operating here in 2001, more than
twenty years ago, firmly establishing the
Group as a consolidator of assets and
exceptional operator. Appalachia is home
to many mature, low-decline conventional
and unconventional wells matching our
target asset profile.
Strategy
Our rapid growth and ability
to generate consistent
shareholder return stems from
our unique business model
and successful execution of
straight-forward, low-risk,
disciplined and proven
operating techniques.
|
 |
 |
ACQUIRE
Acquire long-life stable assets
We practice a disciplined approach to
acquire long-life stable assets by
targeting low-decline producing assets
that are value accretive, high margin
and strategically complementary, while
also applying extensive environmental,
social, land and legal due diligence.
|
 |
OPERATE
Operate our assets in a safe, efficient
and responsible manner
Our operational strategy and success is
closely aligned with the culture we
created through our four guiding
operational priorities: Safety,
Production, Efficiency and Enjoyment.
These four daily priorities are brought
to life as part of our SAM program
which our team lives and breathes
every day as they work to safely deliver
clean, affordable and reliable energy.
|
||
 |
GENERATE
Generate reliable free cash flow
Our unique business model, coupled
with the successful execution of the
Acquire and Operate pillars of our
corporate strategy, naturally lends itself
to generating free cash flow. We aspire
to make cash flows predictable and
reliable so we can consistently generate
shareholder return, pay down debt,
fund acquisitive growth,
and accomplish our sustainability goals
and ambitions.
|
 |
RETIRE
Retire assets safely and responsibly
At the appropriate time, through our
safe and systematic asset retirement
program, we safely and permanently
retire wells and responsibly restore the
well sites as close as possible to their
original and natural condition. Our asset
retirement program reflects our solid
commitment to a healthy environment,
the surrounding community and its
citizens and state regulatory authorities.
|
|
Acquire Long-Life
Stable Assets
|
||
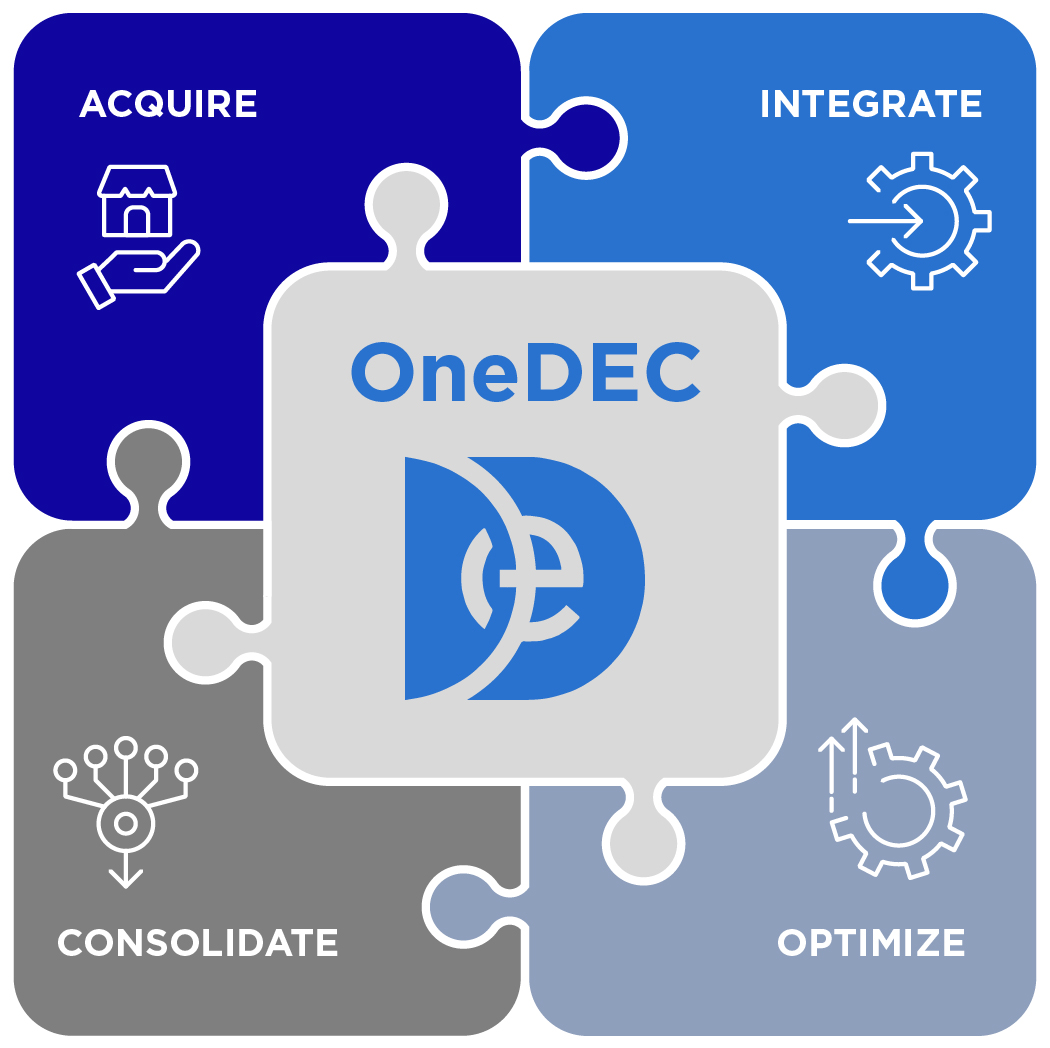
ONE DEC
Foster a culture of operational excellence
through the integration of People, Process
and Systems
|
2023 ACHIEVEMENTS
—Completed the Tanos II Central Region acquisition for
$262 million, contributing approximately 69 MMcfepd
to 2023 production.
—Realized first full year of operations for Next
LVL Energy.
— Utilized environmental and climate screening of
 target assets to inform acquisition considerations.
TARGETS FOR 2024
— We will persist in our disciplined approach to
acquisitions, focusing on producing assets that align
with our stringent investment criteria.
—We will maintain liquidity discipline, ensuring we
remain well-positioned in the market to seize
opportunities as they arise.
—Our growth strategy will continue to emphasize
complementary and synergistic expansion in the
Appalachian and Central regions. We will foster
strong relationships with development-oriented
producers in our operating areas.
—We will actively screen and execute on new basin
opportunities, staying agile and responsive to
emerging prospects.
|
||
 |
|||
ACQUIRE
Target low-decline, producing assets that complement our
returns-focused strategy
|
|||
INTEGRATE
Onboard employees, integrate processes and systems to
drive efficiencies and standardization
|
|||
OPTIMIZE
Empower retained personnel to apply our SAM techniques on
acquired assets
|
|||
CONSOLIDATE
Enhance operating, marketing relationships with
increasing scale
|
|||
PRINCIPAL RISKS
—Corporate Strategy and Acquisition Risk
—Financial Strength and Flexibility Risk
—Climate Risk
|
KEY PERFORMANCE INDICATORS
—Maintain net debt-to-adjusted EBITDA at or
below 2.5x
—Emissions intensity
—Adjusted operating cost per Mcfe
|
||
Indicates sustainability achievements and targets.
|
Operate our Assets in a Safe,
Efficient and Responsible Manner
|
||
GOAL
Improve safety, optimize production, increase expense
efficiency and improve emissions profile
|
2023 ACHIEVEMENTS
—Annual production of 299,632 MMcfe.
—Adjusted EBITDA margin of 52%.
— Achieved 2023 goal to conduct fugitive emission
surveys on 100% of Central Region upstream assets.
— Collectively, conducted ~246,000 voluntary
fugitive emission detection surveys within our
upstream portfolio, confirming an average ~98% no-
leak rate on surveyed sites and allowing us to take
meaningful steps towards reducing our
emissions profile.
— Completed aerial light detection and ranging
(“LiDAR”) surveys covering~10,000 miles of
midstream systems which also included ~9,000 sites
(wells, compressor stations and other facilities).
— Zero non-compliance issues cited after
participating in 16 state and federal regulatory agency
audits of our operational assets and compliance
programs which were completed as part of routine
monitoring programs.
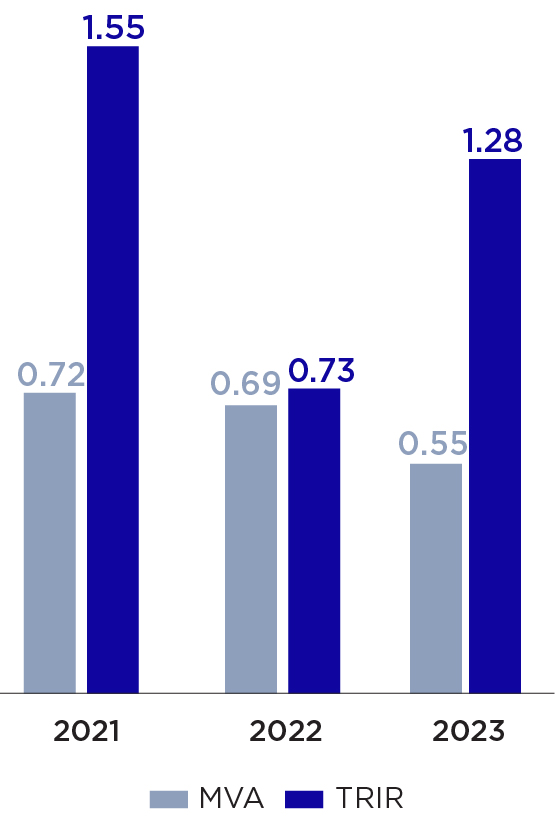
— Our safety-no compromises culture contributed to
our preventable motor vehicle accident rate (“MVA”)
declining 20% year-over-year to 0.55 (accidents to
million miles driven).
— Expanding continuous remote monitoring
capabilities through our Gas Control and Integrated
Operations Centers promotes safety and efficiency
through enhanced visibility of operations.
TARGETS FOR 2024
—We will continue to execute our guiding priorities:
Safety, Production, Efficiency, and Enjoyment.
— Our commitment to responsible stewardship
remains unwavering. We will intensely focus on
continuous improvement across all
sustainability aspects, aiming to exceed our
stakeholders’ expectations.
—We will maintain our focus on the SAM program to
uphold margins, offset natural declines, and capitalize
on expense efficiency opportunities.
|
||
PROCESS
“Data + Human Interaction” coupled with production
technology systems, drive activities, process enhancements,
refine best practice techniques
|
|||
RESULT
Practical, profit-focused SOLUTIONS developed by our
experienced teams
|
|||
ONGOING INITIATIVES |
|||
 |
|||
PRINCIPAL RISKS
—Corporate Strategy and Acquisition Risk
—Climate Risk
—Cybersecurity Risk
—Health and Safety Risk
—Regulatory and Political Risk
—Financial Strength and Flexibility Risk
|
KEY PERFORMANCE INDICATORS
—Safety Performance
—Emissions intensity
—Consistent adjusted EBITDA margin
—Adjusted operating cost per Mcfe
—Net cash provided by operating activities
|
||
Indicates sustainability achievements and targets.
|
Generate Reliable
Free Cash Flow
|
|||
PRUDENT ALLOCATION OF
CASH FLOW
|
2023 ACHIEVEMENTS
—Raised our weighted average hedge floor on natural
gas production to $3.87 per Mcf at December 31,
2023 from $3.63 per Mcf at December 31, 2022.
—Repaid $277 million in asset backed securitizations
illustrating the substantial cash flow generated by our
assets.
—Repurchased 646,762 shares through our Share
Buyback Program, representing $11 million in
shareholder value above and beyond the $168 million
in dividend distributions.
— Delivered on our sustainability investment
commitment to convert additional natural gas
pneumatic devices to compressed air, converting 58
well pads exceeding our goal to convert 30 well pads.
We also had significant success with our upstream
emissions detection surveys, completed year two of
aerial surveillance activities for our midstream assets,
and contributed to tree planting and land
preservation initiatives primarily with West Virginia
State University.
TARGETS FOR 2024
—We will maintain our effective hedging strategy to
insulate cash flows. Additionally, we’ll make the most
of accretive market opportunities to raise our hedge
book floor.
— Our focus remains on securing low-cost
sustainability-linked financing. This will support our
acquisitive growth while ensuring low leverage and
ample liquidity.
— We will continue to invest in sustainability
initiatives, reinforcing our commitment to responsible
practices.
|
|||
Allocating Cash Flow |
||||
 |
||||
 |
Debt Repayment
Reduce outstanding debt & create liquidity
|
|||
 |
Reinvestment & Growth
Reinvest for organic growth & reduce
reliance on equity and debt markets
|
|||
 |
Sustainability
Invest in broad spectrum of
sustainability initiatives
|
|||
 |
Dividend Distributions
Pay sustainable dividends
|
|||
 |
Share Buyback Program
Reduce outstanding shares & increase
shareholder value
|
|||
PRINCIPAL RISKS
—Corporate Strategy and Acquisition Risk
—Commodity Price Volatility Risk
—Financial Strength and Flexibility Risk
|
KEY PERFORMANCE INDICATORS
—Maintain net debt-to-adjusted EBITDA at or
below 2.5x
—Consistent adjusted EBITDA margin
—Emissions intensity
—Adjusted operating cost per Mcfe
—Net cash provided by operating activities
|
|||
Indicates sustainability achievements and targets.
|
Retire Assets Safely and
Responsibly and Restore the
Environment to its Natural State
|
|||
 |
STEP 1
DEACTIVATION
Remove product from
production equipment.
|
2023 ACHIEVEMENTS
— We expanded our asset retirement operations from 15 to
17 rigs.
— We successfully retired 222 DEC wells, including 21 Central
Region wells. This achievement surpasses our goal of retiring
200 wells by 2023 and also exceeds our collective state
commitments in Appalachia to retire 80 wells in our primary
states of operation.
— We further retired 182 third-party wells, including 148
state and federal orphan wells and 34 for other third party
operators, bringing the total wells retired in Appalachia by
the Next LVL team to 383 wells.
— We permanently retired 18 wells on lands managed by the
Pennsylvania Game Commission. We then restored well sites
to their natural condition by planting native trees to the
region. This dual effort not only reduced noise pollution but
also contributed to the restoration of bird habitats.
TARGETS FOR 2024
— Continue to safely retire wells and aim to exceed state
asset retirement programme commitments by identifying
and retiring wells at the end of their productive lives.
— Continue to optimize the vertical integration benefits
we can realize with our expanded internal asset
retirement capacity.
— Continue constructive and collaborative dialogue with
states and industry associations to innovate and ensure best
practices in the well retirement arena.
|
||
 |
STEP 2
WELL DECOMMISSIONING
Permanently plug and
cap wellbore.
|
|||
 |
STEP 3
SITE DECOMMISSIONING
Remove and salvage/dispose
of equipment.
|
|||
 |
STEP 4
RECLAMATION
Redistribute soil and revegetate for
return to original state.
|
|||
PRINCIPAL RISKS
—Health and Safety Risk
—Regulatory and Political Risk
—Climate Risk
—Financial Strength and Flexibility Risk
|
KEY PERFORMANCE INDICATORS
—Net cash provided by operating activities
—Meet or exceed state asset retirement goals
—Emissions intensity
|
|||
Indicates sustainability achievements and targets.
Key Performance Indicators
In assessing our performance, the Directors use key performance indicators (“KPIs”) to track our success against our stated
strategy. The Directors assess our KPIs on an annual basis and modify them as needed, taking into account current business
developments. The following KPIs focus on corporate and environmental responsibility, consistent cash flow generation
underpinned by prudent cost management, low leverage and adequate liquidity to protect the sustainability of the business.
Please refer to the APMs section in Additional Information within this Annual Report & Form 20-F for information on how
these metrics are calculated and reconciled to IFRS measures.
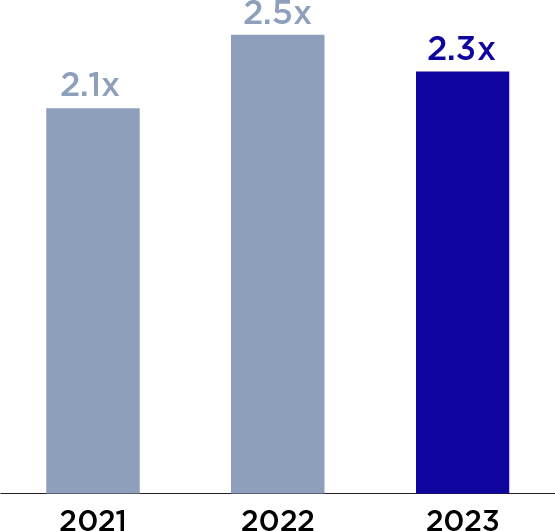
MAINTAIN NET DEBT-TO-ADJUSTED EBITDA AT OR
BELOW 2.5x
During 2023 our leverage ratio remained consistent at 2.3x and within our
preferred goal of 2.0x to 2.5x.
LINK TO STRATEGY
—Acquire long-life stable assets
—Generate reliable free cash flow
(a)2023 is pro forma for the Tanos II acquisition completed in March 2023. 2022 is pro
forma for the East Texas Assets and ConocoPhillips acquisitions. 2021 is pro forma for
the Indigo, Blackbeard, Tanos and Tapstone acquisitions as well as Oaktree’s
subsequent participation in the Indigo transaction.
|
NET DEBT-TO-PRO FORMA
ADJUSTED EBITDA(a)
 |
||
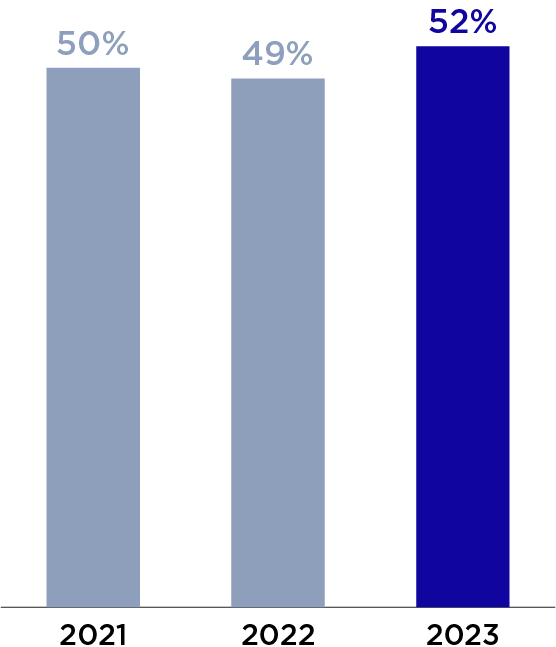
CONSISTENT ADJUSTED EBITDA MARGIN
Total revenue, inclusive of settled hedges for 2023 was $1,046 million, an
increase of 2% compared to 2022. Adjusted EBITDA for 2023 was $543 million,
an increase of 8% compared to 2022.
LINK TO STRATEGY
—Generate reliable free cash flow
—Operate our assets in a safe, efficient and responsible manner
|
ADJUSTED EBITDA MARGIN
 |
||
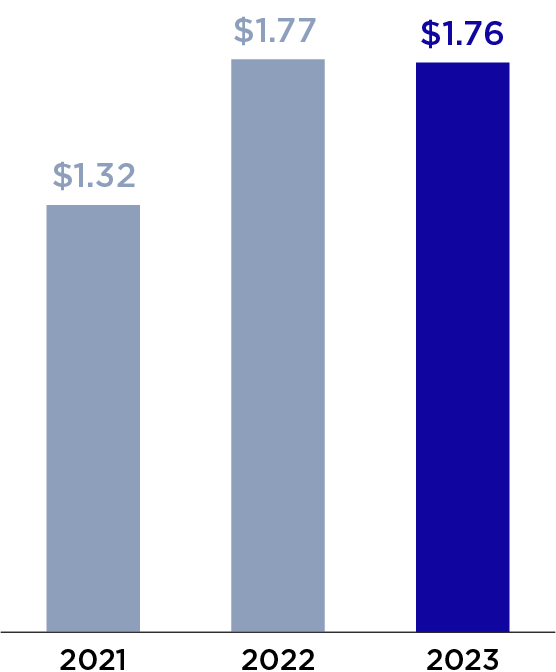
ADJUSTED OPERATING COST PER MCFE
Adjusted operating cost per Mcfe for 2023 was $1.76, a decrease of 1%
compared with 2022.
LINK TO STRATEGY
—Operate our assets in a safe, efficient and responsible manner
—Generate reliable free cash flow
|
ADJUSTED OPERATING COST
PER MCFE
 |
||
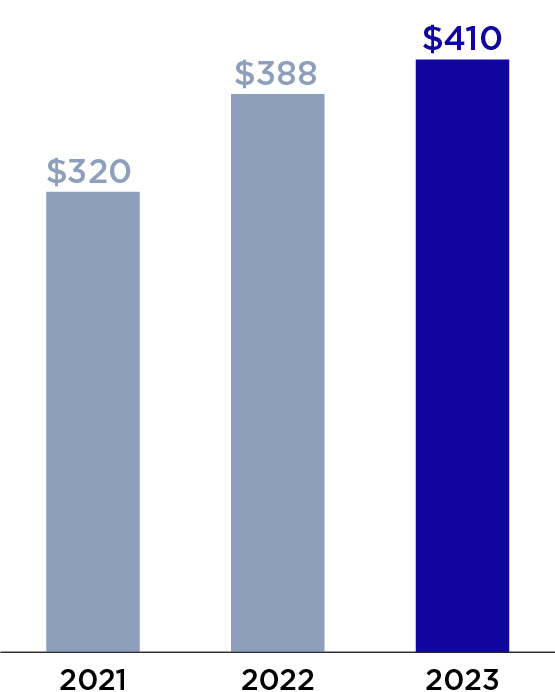
NET CASH PROVIDED BY OPERATING ACTIVITIES
Net cash provided by operating activities for 2023 was $410 million an increase
of 6% compared with 2022.
LINK TO STRATEGY
—Operate our assets in a safe, efficient and responsible manner
—Generate reliable free cash flow
—Retire assets safely and responsibly and restore the environment to its
natural state
|
NET CASH PROVIDED BY
OPERATING ACTIVITIES
 |
||
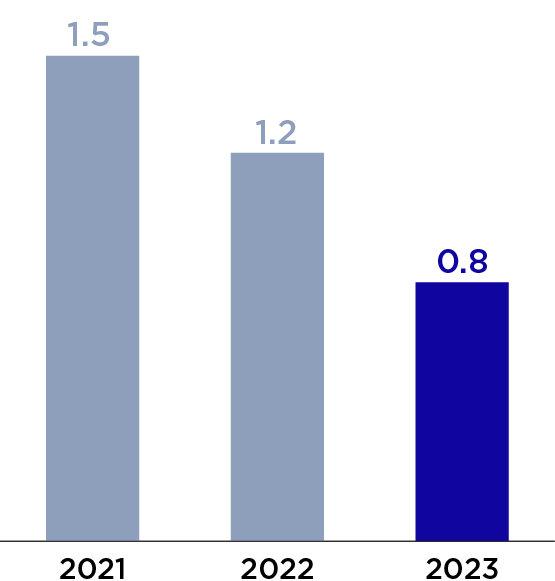
EMISSIONS INTENSITY
Significant improvement in our Scope 1 methane emissions intensity is primarily
a result of our team’s steadfast focus on leak detection and mitigation across
our portfolio, including meeting current year objectives to survey 100% of
Central Region upstream assets while continuing like surveys in Appalachia to
maintain no leak rates. Conversion of natural gas-driven pneumatic devices to
compressed air also supported this tremendous achievement of a 33% year-
over-year reduction.
LINK TO STRATEGY
—Acquire long-life stable assets
—Operate our assets in a safe, efficient and responsible manner
—Generate reliable free cash flow
—Retire assets safely and responsibly and restore the environment to its
natural state
|
METHANE EMISSIONS INTENSITY
(MT CO2e/MMcfe)
 |
||
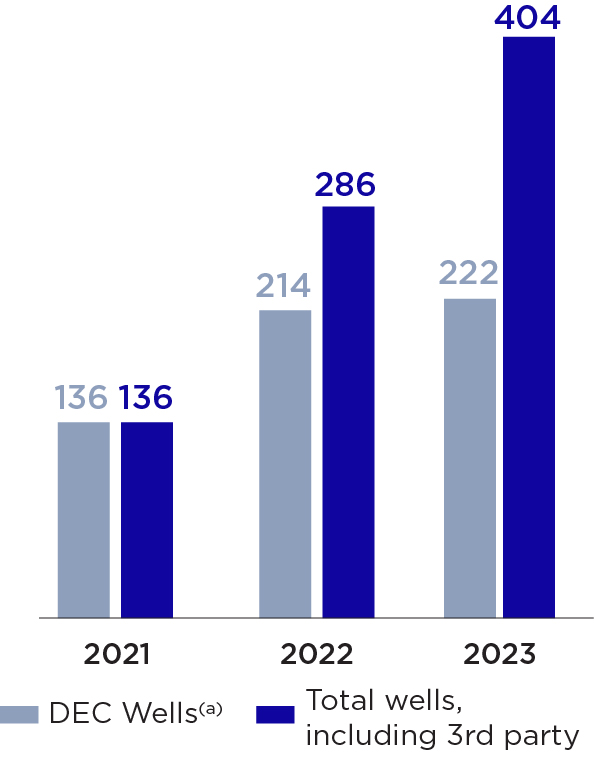
MEET OR EXCEED STATE ASSET RETIREMENT GOALS
During 2023, we meaningfully expanded our asset retirement operations and
permanently retired 222 wells, inclusive of our Central Regions operations. This
achievement allowed us to more than double our Appalachian state
requirements of 80 wells and exceed our goal to retire 200 wells by the end of
2023. Additionally, with our Next LVL Energy assets, we plugged 182 wells for
third parties, including other operators and for the states of Ohio, Pennsylvania
and West Virginia.
LINK TO STRATEGY
—Retire assets safely and responsibly and restore the environment to its
natural state
(a)DEC wells inclusive of 14 and 21 Central Region wells retired during 2022 and
2023, respectively.
|
ACTUAL WELLS RETIRED(a)
 |
||
SAFETY PERFORMANCE
Our 2023 MVA rate is 0.55 incidents per million miles driven, a 20%
improvement from 2022. Though five of nine operating areas incurred zero
incidents in 2023, including two states who have not recorded an incident in
more than four years, TRIR increased to 1.28, primarily driven by an increase in
reported incidents in the remaining areas, in part a function of short-service
employees with less than one year experience under the Group’s safety
expectations. A new Safety Strategy Committee has been created to identify
and advance specific areas for improvement and accountability.
LINK TO STRATEGY
—Operate our assets in a safe, efficient and responsible manner
|
MOTOR VEHICLE ACCIDENTS &
TOTAL RECORDABLE
INCIDENT RATE
 |
||

Our Business
HISTORY AND DEVELOPMENT OF THE GROUP
The Group, formerly Diversified Gas & Oil PLC, is an
independent energy company engaged in the production,
transportation and marketing of natural gas as well as oil
from its complementary onshore upstream and midstream
assets, primarily located within the Appalachian and Central
Regions of the United States. Our Appalachia assets consist
primarily of producing wells in conventional reservoirs and
the Marcellus and Utica shales, within Pennsylvania, Ohio,
Virginia, West Virginia, Kentucky, and Tennessee, while our
Central Region, located in Oklahoma, Louisiana, and
portions of Texas, includes producing wells in multiple
producing formations, including the Bossier, Haynesville
Shale and Barnett Shale Plays, as well as the Cotton Valley
and the Mid-Continent producing areas. The Group was
incorporated in 2014 in the United Kingdom, and our
predecessor business was founded in 2001 by our Chief
Executive Officer, Robert Russell (“Rusty”) Hutson, Jr., with
an initial focus on primarily natural gas and also oil
production in West Virginia. In recent years, we have grown
rapidly by capitalizing on opportunities to acquire and
enhance producing assets and leveraging the operating
efficiencies that result from economies of scale. Since 2017,
and through December 31, 2023, we have completed 24
acquisitions for a combined purchase price of
approximately $2.7 billion. We had average daily net
production of 821 MMcfepd and 811 MMcfepd for the years
ended December 31, 2023 and December 31,
2022, respectively.
We have consistently driven our operations towards
sustainability and efficiency throughout our history, but we
believe we are also at the forefront of U.S. natural gas and
oil producers in our commitment to sustainability goals.
While the global energy economy is reliant on natural gas
as an energy source, we believe it is imperative that natural
gas wells and pipelines be operated by responsible owners
with a strong commitment to the environment, and we
believe our operational track record demonstrates that
responsibility and stewardship. Given our operational focus
on efficient, environmentally sound natural gas production,
we believe we are ideally positioned to help serve current
energy demands and play a key role in the clean
energy transition.
Other Information
We were incorporated as a public limited company with the
legal name Diversified Gas & Oil PLC under the laws of the
United Kingdom on July 31, 2014 with the company number
09156132. On May 6, 2021, we changed our company name
to Diversified Energy Company PLC.
Our registered office is located at 4th Floor Phoenix House,
1 Station Hill, Reading, Berkshire United Kingdom, RG1 1NB.
In February 2017, our shares were admitted to trading on
the AIM Market of the London Stock Exchange (“AIM”)
under the ticker “DGOC.” In May 2020, our shares were
admitted to the premium listing of the Official List of the
Financial Conduct Authority and to trading on the Main
Market of the LSE. With the change in corporate name in
2021, our shares listed on the LSE began trading under the
new ticker “DEC.” In December 2023, the Group’s shares
were admitted to trading on the New York Stock Exchange
(“NYSE”) under the ticker “DEC.” As of December 31, 2023,
the principal trading market for the Group’s ordinary shares
was the LSE.
Our principal executive offices are located at 1600
Corporate Drive, Birmingham, Alabama 35242, and our
telephone number at that location is +1 205 408 0909. Our
website address is www.div.energy. The information
contained on, or that can be accessed from, our website
does not form part of this Annual Report & Form 20-F. We
have included our website address solely as an inactive
textual reference.

Safety
No compromises
Ensuring the care and wellbeing of our employees, our families and our communities
is our top priority
|
||
Production
Every unit counts
Ensuring every unit we safely produce provides affordable, reliable energy to our
communities and generates value for our shareholders
|
||
Efficiency
Every dollar counts
Ensuring every dollar we spend protects our employees, our communities and the
investment of our shareholders
|
||
Enjoyment
Have fun delivering great results
Ensuring our company is a great place to work, encouraging innovation and
celebrating our employees’ accomplishments
|
BUSINESS OVERVIEW
Our strategy is primarily to acquire and manage natural gas
and oil properties while leveraging our associated
midstream assets to maximize cash flows. We seek to
improve the performance and operations of our acquired
assets through our deployment of rigorous field
management programs and/or refreshing infrastructure.
Through operational efficiencies, we demonstrate our
ability to maximize value by enhancing production while
lowering costs and improving well productivity. We adhere
to stringent operating standards, with a strong focus on
health, safety and the environment to ensure the safety of
our employees and the local communities in which we
operate. We believe that acting as a careful steward of our
assets will improve revenue and margins through captured
natural gas emissions while reducing operating costs, which
benefits our profitability. This focus on operational
excellence, including the aim of reducing natural gas
emissions, also benefits the environment and communities
in which we operate.
OUR BUSINESS STRATEGY
—Optimization of long-life, low-decline assets to enhance
margins and improve cash flow
—Generate consistent shareholder returns through vertical
integration, strategic hedging and cost optimization
—Disciplined growth through accretive acquisitions of
producing assets
—Maintain a strong balance sheet with ability to
opportunistically access capital markets
—Operate assets in a safe, efficient manner with what we
believe are industry-leading sustainability initiatives
OUR STRENGTHS
—Low-risk and low-cost portfolio of assets
—Long-life and low-decline production
—High margin assets benefiting from significant scale and
owned midstream and asset retirement infrastructure
and internal product marketing team
—Highly experienced management and operational team
—Track record of successful consolidation and integration
of acquired assets
OUTLOOK
Looking forward, we will continue to prudently manage our
long-life, low-decline asset portfolio and the consistent
cashflows they produce. We plan to maintain our hedging
strategy to protect cash flow. We will seek to retain our
strategic advantages in purposeful growth through a
disciplined acquisition strategy that continues to secure
low-cost financing that supports acquisitive growth while
maintaining low leverage and ample liquidity. In addition,
we intend to remain proactive in our sustainability
endeavors by seeking to secure future capital allocation for
sustainability initiatives.

RESERVE DATA
Summary of Reserves
The following table presents our estimated net proved reserves, Standardized Measure and PV-10 as of December 31, 2023,
using SEC pricing. Standardized Measure has been presented inclusive and exclusive of taxes and is based on the proved
reserve report as of such date by Netherland, Sewell & Associates, Inc. (“NSAI”), our independent petroleum engineering firm.
A copy of the proved reserve report is included as an exhibit to the Annual Report & Form 20-F. Refer to the Preparation of
Reserve Estimates and Estimation of Proved Reserves sections within this Annual Report & Form 20-F for a definition of
proved reserves and the technologies and economic data used in their estimation.
December 31, 2023 |
|
SEC Pricing(a)
|
|
Proved developed reserves |
|
Natural gas (MMcf) |
3,184,499 |
NGLs (MBbls) |
94,391 |
Oil (MBbls) |
12,380 |
Total proved developed reserves (MMcfe) |
3,825,125 |
Proved undeveloped reserves |
|
Natural gas (MMcf) |
15,545 |
NGLs (MBbls) |
1,310 |
Oil (MBbls) |
236 |
Total proved undeveloped reserves (MMcfe) |
24,821 |
Total proved reserves |
|
Natural gas (MMcf) |
3,200,044 |
NGLs (MBbls) |
95,701 |
Oil (MBbls) |
12,616 |
Total proved reserves (MMcfe) |
3,849,946 |
Prices used |
|
Natural gas (Mmbtu) |
$2.64 |
Oil and NGLs (Bbls) |
$78.21 |
PV-10 (thousands) |
|
Pre-tax (Non-GAAP)(b)
|
$2,139,690 |
PV of Taxes |
(394,154) |
Standardized Measure |
$1,745,536 |
Percent of estimated total proved reserves that are: |
|
Natural gas |
83% |
Proved developed |
99% |
Proved undeveloped |
1% |
(a)Our estimated net proved reserves were determined using average first-day-of-the-month prices for the prior 12 months in accordance with
SEC guidance. For natural gas volumes, the average Henry Hub spot price of $2.64 per MMBtu as of December 31, 2023 was adjusted for
gravity, quality, local conditions, gathering and transportation fees, and distance from market. For NGLs and oil volumes, the average WTI
price of $78.21 per Bbl as of December 31, 2023 was similarly adjusted for gravity, quality, local conditions, gathering and transportation fees,
and distance from market. All prices are held constant throughout the lives of the properties.
(b)The PV-10 of our proved reserves as of December 31, 2023 was prepared without giving effect to taxes or hedges. PV-10 is a non-GAAP and
non-IFRS financial measure and generally differs from Standardized Measure, the most directly comparable GAAP measure, because it does
not include the effects of income taxes on future net cash flows. We believe that the presentation of PV-10 is relevant and useful to our
investors as supplemental disclosure to the Standardized Measure because it presents the discounted future net cash flows attributable to
our reserves prior to taking into account future corporate income taxes and our current tax structure. While the Standardized Measure is free
cash dependent on the unique tax situation of each company, PV-10 is based on a pricing methodology and discount factors that are
consistent for all companies. Because of this, PV-10 can be used within the industry and by creditors and securities analysts to evaluate
estimated net cash flows from proved reserves on a more comparable basis. Investors should be cautioned that neither PV-10 nor the
Standardized Measure represents an estimate of the fair market value of our proved reserves.
Proved Reserves
As of December 31, 2023, our estimated proved reserves totaled 3,849,946 MMcfe, a decrease of 24% from the prior year-end
with a Standardized Measure of $1.7 billion. Natural gas constituted approximately 83% of our total estimated proved reserves
and 83% of our total estimated proved developed reserves. The following table provides a summary of the changes in our
proved reserves during the years ended December 31, 2023, 2022 and 2021.
Total (MMcfe) |
|
Total proved reserves as of December 31, 2020 |
3,250,588 |
Extensions and discoveries |
— |
Revisions to previous estimates |
541,509 |
Purchase of reserves in place |
1,260,514 |
Sales of reserves in place |
(164,039) |
Production |
(259,543) |
Total proved reserves as of December 31, 2021 |
4,629,029 |
Extensions and discoveries |
13,326 |
Revisions to previous estimates |
379,812 |
Purchase of reserves in place |
331,043 |
Sales of reserves in place |
(6,912) |
Production |
(296,121) |
Total proved reserves as of December 31, 2022 |
5,050,177 |
Extensions and discoveries |
1,012 |
Revisions to previous estimates |
(659,379) |
Purchase of reserves in place |
126,803 |
Sales of reserves in place |
(369,035) |
Production |
(299,632) |
Total proved reserves as of December 31, 2023 |
3,849,946 |
Extensions and Discoveries
During 2023, 1,012 MMcfe were adjusted due to well assignments recorded in the accounting actuals.
During 2022, we elected to participate in select development activities on a non-operated basis generating 13,326 MMcfe
in reserves.
During 2021, no reserves were added from extension or discovery activities.
Revisions to Previous Estimates
During 2023, we recorded 659,379 MMcfe in revisions to previous estimates. The downward revisions were primarily
associated with changes in the trailing 12-month average realized Henry Hub first day spot price, which decreased
approximately 58% as compared to the December 31, 2022 along with a 17% decrease in the 12 month average WTI first day
spot price. These factors primarily drove a net downward revision that impacted well economics and well life.
During 2022, we recorded 379,812 MMcfe in revisions to previous estimates. These positive performance revisions were
primarily associated with changes in the trailing 12-month average realized Henry Hub spot price, which increased
approximately 77% as compared to the December 31, 2021 Henry Hub spot price due to the war between Russia and Ukraine,
as well as other geopolitical factors. These factors primarily drove a net upward revision of 386,064 MMcfe due to changes in
pricing that impacted well economics. These increases were offset by a 6,252 MMcfe downward revision for changes in timing.
During 2021, 541,509 MMcfe in revisions to previous estimates were primarily associated with changes in the 12-month average
realized Henry Hub spot price, which increased approximately 81% as compared to December 31, 2020.
Purchase of Reserves in Place
During 2023, 126,803 MMcfe of purchases of reserves in place were associated with the Tanos II acquisition. Refer to Note 5 in
the Notes to the Group Financial Statements for additional information about these acquisitions.
During 2022, 331,043 MMcfe of purchases of reserves in place were associated with the East Texas and ConocoPhillips
acquisitions. Refer to Note 5 in the Notes to the Group Financial Statements for additional information about
these acquisitions.
During 2021, 1,260,514 MMcfe of purchases of reserves in place were associated with the Indigo, Tanos, Blackbeard and
Tapstone acquisitions. Refer to Note 5 in the Notes to the Group Financial Statements for additional information about these
acquisitions.
Sales of Reserves in Place
During 2023, 369,035 MMcfe of sales of reserves in place were primarily associated with the divestitures of non-core assets.
During 2022, 6,912 MMcfe of sales of reserves in place were primarily associated with the divestitures of non-core assets.
During 2021, 164,039 MMcfe of sales of reserves in place were primarily associated with the divestment of assets to Oaktree for
their subsequent participation in the Indigo acquisition. Refer to Note 5 in the Notes to the Group Financial Statements for
additional information about divestitures.
Proved Undeveloped Reserves
We aim to obtain proved developed producing wells through acquisitions in accordance with our growth strategy rather than
through development activities. We accordingly contribute limited capital to development activities. From time to time, when
acquiring packages of wells, we will acquire certain locations that are in development by the acquiree at the time of the
acquisition or could be developed in the future. When economic, we will engage third parties to complete the existing
development activities, and such reserves are included below as proved undeveloped reserves. We do not have a
development program and, as a result, any additional undrilled locations that we hold cannot be classified as undeveloped
reserves in accordance with SEC rules unless a development plan is in place. As of December 31, 2023, we had no such
development plans and therefore have not classified these undrilled locations as proved undeveloped reserves.
The following table summarizes the changes in our estimated proved undeveloped reserves during the years ended
December 31, 2023, 2022 and 2021:
Total (MMcfe) |
|
Proved undeveloped reserves as of December 31, 2020 |
— |
Extensions and discoveries |
— |
Revisions to previous estimates |
— |
Purchase of reserves in place |
3,505 |
Sales of reserves in place |
— |
Converted to proved developed reserves |
— |
Proved undeveloped reserves as of December 31, 2021 |
3,505 |
Extensions and discoveries |
8,832 |
Revisions to previous estimates |
— |
Purchase of reserves in place |
— |
Sales of reserves in place |
— |
Converted to proved developed reserves |
(3,505) |
Proved undeveloped reserves as of December 31, 2022 |
8,832 |
Extensions and discoveries |
— |
Revisions to previous estimates |
— |
Purchase of reserves in place |
24,821 |
Sales of reserves in place |
(8,832) |
Converted to proved developed reserves |
— |
Proved undeveloped reserves as of December 31, 2023 |
24,821 |
Extensions and Discoveries
During 2023, no reserves were added from extension or discovery activities.
During 2022, we elected to participate in select development activities where third parties were engaged to complete the
development. Seven of these wells were in progress as of December 31, 2022, generating 8,832 MMcfe in proved
undeveloped reserves.
During 2021, no reserves were added from extension or discovery activities.
Purchase of Reserves in Place
During 2023, the 24,821 MMcfe of purchase of reserves in place were associated with the Tanos II acquisition and related to
four wells in progress that have been drilled and are awaiting hydraulic fracture stimulation.
During 2022, there were no purchases of proved undeveloped reserves in place.
During 2021, the 3,505 MMcfe of purchase of reserves in place were associated with the Tapstone Acquisition and related to
five wells that were under development as of December 31, 2021. We engaged third parties to complete this development
activity and during 2022 these were converted to proved developed reserves. Refer to Note 5 in the Notes to the Group
Financial Statements for additional information about acquisitions.
Sales of Reserves in Place
During 2023, the 8,832 in sales of reserves in place were divested as part of the sale of 80% of the equity interest in DP Lion
Equity Holdco LLC in December 2023. Refer to Note 5 in the Notes to the Group Financial Statements for additional
information.
During 2022, there were no sales of reserves in place.
During 2021, there were no sales of reserves in place.
Developed and Undeveloped Acreage
The following table sets forth certain information regarding the total developed and undeveloped acreage in which we owned
an interest as of December 31, 2023. Developed acres are acres spaced or assigned to productive wells and do not include
undrilled acreage held by production under the terms of the lease. Undeveloped acres are acres on which wells have not been
drilled or completed to a point that would permit the production of commercial quantities of oil or natural gas, regardless of
whether such acreage contains proved reserves. Approximately 99.9% of our acreage was held by production at
December 31, 2023.
Developed Acreage |
Undeveloped Acreage |
Total Acreage |
||||
Gross(a)
|
Net(b)
|
Gross(a)
|
Net(b)
|
Gross(a)
|
Net(b)
|
|
As of December 31, 2023
|
5,600,383 |
3,039,447 |
8,005,314 |
5,519,159 |
13,605,697 |
8,558,606 |
(a)A gross acre is an acre in which a working interest is owned. The number of gross acres is the total number of acres in which a working
interest is owned.
(b)A net acre is deemed to exist when the sum of the fractional ownership working interests in gross acres equals one. The number of net acres
is the sum of the fractional working interests owned in gross acres expressed as whole numbers and fractions thereof.
The undeveloped acreage numbers presented in the table above have been compiled using best efforts to review and
determine acreage that is not currently drilled but may be available for drilling at the current time under certain circumstances.
Whether or not undrilled acreage may be drilled and thereafter produce economic quantities of oil or gas is related to many
factors which may change over time, including natural gas and oil prices, service vendor availability, regulatory regimes,
midstream markets, end user demand, and macro and micro financial conditions; the undeveloped acreage described herein is
presented without an opinion as to economic viability, as a result of the aforesaid factors. Additionally, it is noted that certain
formations on a land tract may be already developed while other formations are undeveloped.
The following table sets forth the number of total gross and net undeveloped acres as of December 31, 2023 that will expire in
2024, 2025 and 2026 unless production is established within the spacing units covering the acreage prior to the expiration
dates or unless such acreage is extended or renewed.
Gross |
Net |
|
2024 |
5,404 |
663 |
2025 |
24,906 |
2,876 |
2026 |
2,869 |
87 |
Our primary focus is to operate our existing producing assets in a safe, efficient and responsible manner, however we also
assess areas subject to lease expiration for potential development opportunities when prudent. As of December 31, 2023, we
had no development plans other than the in-progress wells described above and therefore have not classified any other
potential undrilled locations on this acreage as proved undeveloped reserves.
Preparation of Reserve Estimates
Our reserve estimates as of December 31, 2023 included in
this Annual Report & Form 20-F were independently
evaluated by our independent engineers, NSAI, in
accordance with petroleum engineering and evaluation
standards published by The Petroleum Resources
Management System jointly published by the Society of
Petroleum Engineers, the World Petroleum Council, the
American Association of Petroleum Geologists and the
Society of Petroleum Evaluation Engineers, as amended and
definitions and guidelines established by the SEC.
NSAI is a worldwide leader of petroleum property analysis
for industry and financial organizations and government
agencies. NSAI was founded in 1961 and performs
consulting petroleum engineering services under Texas
Board of Professional Engineers Registration No. F-2699.
Within NSAI, the technical persons primarily responsible for
auditing the estimates set forth in the NSAI reserves report
incorporated herein are Mr. Robert C. Barg and Mr. William
J. Knights. Mr. Barg, a Licensed Professional Engineer in the
State of Texas (No. 71658), has been practicing consulting
petroleum engineering at NSAI since 1989 and has over six
years of prior industry experience. He graduated from
Purdue University in 1983 with a Bachelor of Science
Degree in Mechanical Engineering. Mr. Knights, a Licensed
Professional Geoscientist in the State of Texas, Geology
(No. 1532), has been practicing consulting petroleum
geoscience at NSAI since 1991 and has over 10 years of prior
industry experience. He graduated from Texas Christian
University in 1981 with a Bachelor of Science Degree in
Geology in 1984 with a Master of Science Degree in
Geology. Both technical principals meet or exceed the
education, training and experience requirements set forth in
the Standards Pertaining to the Estimating and Auditing of
Oil and Gas Reserves Information promulgated by the
Society of Petroleum Engineers; both are proficient in
judiciously applying industry standard practices to
engineering and geoscience evaluations, as well as applying
SEC and other industry reserves definitions and guidelines.
Our internal staff of petroleum engineers and geoscience
professionals work closely with our independent reserve
engineers to ensure the integrity, accuracy and timeliness
of data furnished to our independent reserve engineers for
their reserve evaluation process. Our technical team
regularly meets with the independent reserve engineers to
review properties and discuss methods and assumptions
used to prepare reserve estimates. The reserve estimates
and related reports are reviewed and approved by our Vice
President of Reservoir Engineering. The Vice President of
Reservoir Engineering has been with the Group since 2018
and has 24 years of experience in petroleum engineering,
with over 20 years of experience evaluating natural gas and
oil reserves, and holds a Bachelor of Science in Petroleum
Engineering. Prior to joining the Group in 2018, our Vice
President of Reservoir Engineering served in various
reservoir engineering roles for public companies engaged in
the exploration and production operations, and is also a
member of the Society of Petroleum Engineers.
Estimation of Proved Reserves
Proved reserves are reserves which, by analysis of
geoscience and engineering data, can be estimated with
reasonable certainty to be economic1ally producible from a
given date forward from known reservoirs under existing
economic conditions, operating methods and government
regulations prior to the time at which contracts providing
the right to operate expires, unless evidence indicates that
renewal is reasonably certain. The term “reasonable
certainty” implies a high degree of confidence that the
quantities of oil or natural gas actually recovered will equal
or exceed the estimate. To achieve reasonable certainty, we
and the independent reserve engineers employed
technologies that have been demonstrated to yield results
with consistency and repeatability. The technologies and
economic data used in the estimation of our proved
reserves include, but are not limited to, well logs, geologic
maps and available downhole and production data,
micro-seismic data and well-test data.
Reserve engineering is and must be recognized as a
subjective process of estimating volumes of economically
recoverable oil and natural gas that cannot be measured in
an exact manner. The accuracy of any reserve estimate is a
function of the quality of available data and of engineering
and geological interpretation. As a result, the estimates of
different engineers often vary. In addition, the results of
drilling, testing and production may justify revisions of such
estimates. Accordingly, reserve estimates often differ from
the quantities of natural gas, NGLs and oil that are
ultimately recovered. Estimates of economically
recoverable natural gas, NGLs and oil and of future net cash
flows are based on a number of variables and assumptions,
all of which may vary from actual results, including geologic
interpretation, prices and future production rates and costs.
Productive Wells
Productive wells consist of producing wells, wells capable of production and wells awaiting connection to production facilities.
Gross wells are the total number of producing wells in which we have an interest, operated and non-operated, and net wells
are the sum of our fractional working interest owned in gross wells. The following table summarizes our productive natural gas
and oil wells as of December 31, 2023.
As of December 31, 2023
|
|
Natural gas wells |
71,471 |
Oil wells |
3,044 |
Total gross productive wells |
74,515 |
Natural gas wells |
59,226 |
Oil wells |
1,413 |
Total net productive wells |
60,639 |
As of December 31, 2023(a)
|
|
Total gross in progress wells |
4.0 |
Total net in progress wells |
3.8 |
(a)Comprised of wells in the Central Region.
Exploratory and Development Drilling Activities
Information regarding our drilling and development activities is set forth below:
Development |
||||||
Productive Wells |
Dry Wells |
Total |
||||
Year |
Gross |
Net |
Gross |
Net |
Gross |
Net |
2023 |
4 |
4 |
— |
— |
4 |
4 |
2022 |
5 |
2 |
— |
— |
5 |
2 |
2021 |
— |
— |
— |
— |
— |
— |
We drilled no exploratory wells (productive or dry) during the years ended December 31, 2023, 2022 and 2021.
During 2021, we completed the Tapstone Acquisition, which included five wells in the Central Region that were under
development by Tapstone as of December 31, 2021. We engaged third parties to complete this development activity, however
they remained in progress as of December 31, 2021.
During 2022, we completed the development of the five wells referenced in the preceding paragraph that had been under
development as of December 31, 2021. We then elected to participate in seven development opportunities on a non-
operating basis in our Appalachian Region. All seven of the Appalachian development wells remained in progress as of
December 31, 2022.
During 2023, we completed the development of two of the seven Appalachian wells that were under development as of
December 31, 2022. The remaining five Appalachian wells were divested in connection with the sale of 80% of the equity
interest in DP Lion Equity Holdco LLC in December 2023. On March 1, 2023, we also completed the Tanos II acquisition, which
included five wells in the Central Region that were under development at the date of acquisition. During 2023, we completed
one of these five wells. As of December 31, 2023, four Central Region development wells remain in progress. Refer to Note 5 in
the Notes to the Group Financial Statements for additional information regarding the sale of equity interest in DP Lion Equity
Holdco LLC.
Production Volumes, Average Sales Prices and Operating Costs
Year Ended |
|||
December 31, 2023 |
December 31, 2022 |
December 31, 2021 |
|
Production |
|||
Natural Gas (MMcf) |
256,378 |
255,597 |
234,643 |
NGLs (MBbls) |
5,832 |
5,200 |
3,558 |
Oil (MBbls) |
1,377 |
1,554 |
592 |
Total production (MMcfe) |
299,632 |
296,121 |
259,543 |
Average realized sales price |
|||
(excluding impact of derivatives settled in cash) |
|||
Natural gas (Mcf) |
$2.17 |
$6.04 |
$3.49 |
NGLs (Bbls) |
24.23 |
36.29 |
32.53 |
Oil (Bbls) |
75.46 |
89.85 |
65.26 |
Total (Mcfe) |
$2.68 |
$6.33 |
$3.75 |
Average realized sales price |
|||
(including impact of derivatives settled in cash) |
|||
Natural gas (Mcf) |
$2.86 |
$2.98 |
$2.36 |
NGLs (Bbls) |
26.05 |
19.84 |
15.52 |
Oil (Bbls) |
68.44 |
72.00 |
71.68 |
Total (Mcfe) |
$3.27 |
$3.30 |
$2.51 |
Operating costs per Mcfe |
|||
LOE(a)
|
$0.71 |
$0.62 |
$3.31 |
Production taxes(b)
|
0.21 |
0.25 |
0.53 |
Midstream operating expense(c)
|
0.23 |
0.24 |
1.42 |
Transportation expense(d)
|
0.32 |
0.40 |
1.28 |
Total operating expense per Mcfe |
$1.47 |
$1.51 |
$6.54 |
(a)LOE is defined as the sum of employee and benefit expenses, well operating expense (net), automobile expense and insurance cost.
(b)Production taxes include severance and property taxes. Severance taxes are generally paid on produced natural gas, NGLs and oil
production at fixed rates established by federal, state or local taxing authorities. Property taxes are generally based on the taxing
jurisdictions’ valuation of our natural gas and oil properties and midstream assets.
(c)Midstream operating expenses are daily costs incurred to operate our owned midstream assets inclusive of employee and benefit expenses.
(d)Transportation expenses are daily costs incurred from third-party systems to gather, process and transport our natural gas, NGLs and oil.
Significant Fields
The Group operates in four primary fields: (i) Appalachia, which is comprised of the stacked Marcellus and Utica shales and
other conventional formations (that form our Central Region) (ii) East Texas and Louisiana, which consists of the stacked
Cotton Valley, Haynesville, and Bossier shales, (iii) the Barnett Shale and (iv) the Midcontinent region, in North Texas and
Oklahoma, which also consists of various stacked plays. The following table presents production for the Group’s Appalachian
region, which is considered significant, or greater than 15% of the Group’s total proved reserves, for the periods presented.
Year Ended |
|||
APPALACHIA |
December 31, 2023 |
December 31, 2022 |
December 31, 2021 |
Production |
|||
Natural Gas (MMcf) |
167,930 |
180,194 |
201,635 |
NGLs (MBbls) |
3,018 |
2,810 |
2,690 |
Oil (MBbls) |
394 |
423 |
446 |
Total production (MMcfe) |
188,402 |
199,592 |
220,451 |
Customers
Our production is generally sold on month-to-month contracts at prevailing market prices.
During the year ended December 31, 2023, no customers individually comprised more than 10% of total revenues.
During the year ended December 31, 2022, no customers individually comprised more than 10% of total revenues.
During the year ended December 31, 2021, two customers individually comprised more than 10% of total revenues,
representing 22% of consolidated revenues.
Because alternative purchasers of oil and natural gas are readily available, we believe that the loss of any of these purchasers
would not result in a material adverse effect on our ability to sell future oil and natural gas production. In order to mitigate
potential exposure to credit risk, we may require from time to time for our customers to provide financial security.
Delivery Commitments
We have contractually agreed to deliver firm quantities of natural gas to various customers, which we expect to fulfill with
production from existing reserves. We regularly monitor our proved developed reserves to ensure sufficient availability to
meet these commitments. The following table summarizes our total gross commitments, compiled using best estimates based
on our sales strategy, as of December 31, 2023.
Natural gas (MMcf) |
|
2024 |
70,769 |
2025 |
16,658 |
2026 |
— |
Thereafter |
360,114 |
Transportation and Marketing
Diversified Energy Marketing, LLC, our wholly owned
marketing subsidiary, specializes in commodity marketing,
asset optimization, producer services and the strategic
management of our transportation portfolio. Our mission
extends to enhancing operational efficiency and
profitability, leveraging market insights, operational
expertise, strategic asset management and the right sizing
of our contractual transport assets to ensure flow reliability
and access to various markets.
Our comprehensive suite of services encompasses the
marketing of natural gas, NGL’s and oil, risk management,
logistical support and the strategic management of
transportation agreements. This approach is designed to
maximize market presence, financial outcomes, ensure
consistent product flow and capitalize on strengthening
markets through our transportation infrastructure and
vertically integrated midstream systems. Our midstream
infrastructure and strategic arrangements enable us to
access high-demand markets, notably in the U.S. Gulf Coast
region, while leveraging low cost transportation in
Appalachia. The synergistic nature of our asset base allows
for access to advantageous pricing year-round and flow
assurance with minimal firm transportation agreements. As
of December 31, 2023, our transportation arrangements
provide access to 515 MMcfepd of takeaway capacity.
As a dedicated arm of the Group, our marketing team
ensures our operations and strategies are closely aligned
with our broader goals. With a team of experienced
professionals and a deep understanding of the energy
market’s nuances, we are committed to delivering value and
reliability to our stakeholders. We navigate through the
industry’s complexities to achieve operation excellence.
Competition
Our marketing activities compete with numerous other
companies offering the same services, many of which
possess larger financial and other resources than we have.
Some of these competitors are other producers and
affiliates of companies with extensive pipeline systems that
are used for transportation from producers to end users.
Other factors affecting competition are the cost and
availability of alternative fuels, the level of consumer
demand and the cost of and proximity to pipelines and
other transportation facilities. We believe that our ability to
compete effectively within the marketing segment in the
future depends upon establishing and maintaining strong
relationships with customers.
Seasonality
Demand for natural gas and oil generally decreases during
the spring and fall months and increases during the summer
and winter months. However, seasonal anomalies and
consumers’ procurement initiatives can also lessen seasonal
demand fluctuations. Seasonal anomalies can increase
competition for equipment, supplies and personnel and
can lead to shortages and increase costs or delay
our operations.
Title to Properties
We believe that we have satisfactory title to substantially all
of our active properties in accordance with standards
generally accepted in the oil and natural gas industry. Our
properties are subject to customary royalty and overriding
royalty interests, certain contracts relating to the
exploration, development, operation and marketing of
production from such properties, consents to assignment
and preferential purchase rights, liens for current taxes,
applicable laws and other burdens, encumbrances and
irregularities in title, which we believe do not materially
interfere with the use of or affect the value of such
properties. Prior to acquiring producing wells, we endeavor
to perform a title investigation on an appropriate portion of
the properties that is thorough and is consistent with
standard practice in the natural gas and oil industry.
Generally, we conduct a title examination and perform
curative work with respect to significant defects that we
identify on properties that we operate. We believe that we
have performed reasonable and protective title reviews
with respect to an appropriate cross-section of our
operated natural gas and oil wells.
GOVERNMENT REGULATION
General
Our operations in the United States are subject to various
federal, state and local (including county and municipal
level) laws and regulations. These laws and regulations
cover virtually every aspect of our operations including,
among other things: use of public roads; construction of
well pads, impoundments, tanks and roads; pooling and
unitizations; water withdrawal and procurement for well
stimulation purposes; wastewater discharge, well drilling,
casing and hydraulic fracturing; stormwater management;
well production; well plugging; venting or flaring of natural
gas; pipeline construction and the compression and
transportation of natural gas and liquids; reclamation and
restoration of properties after natural gas and oil operations
are completed; handling, storage, transportation and
disposal of materials used or generated by natural gas and
oil operations; the calculation, reporting and payment of
taxes on natural gas and oil production; and gathering of
natural gas production. Various governmental permits,
authorizations and approvals under these laws and
regulations are required for exploration and production as
well as midstream operations. These laws and regulations,
and the permits, authorizations and approvals issued
pursuant to such laws and regulations, are intended to
protect, among other things: air quality; ground water and
surface water resources, including drinking water supplies;
wetlands; waterways; protected plants and wildlife; natural
resources; and the health and safety of our employees and
the communities in which we operate.
We endeavor to conduct our operations in compliance with
all applicable U.S. federal, state and local laws and
regulations. However, because of extensive and
comprehensive regulatory requirements against a backdrop
of variable geologic and seasonal conditions,
non-compliance during operations can occur. Certain
non-compliance may be expected to result in fines or
penalties, but could also result in enforcement actions,
additional restrictions on our operations, or make it more
difficult for us to obtain necessary permits in the future. The
possibility exists that new legislation or regulations may be
adopted which could have a significant impact on our
operations or on our customers’ ability to use our natural
gas, natural gas liquids and oil, and may require us or our
customers to change their operations significantly or incur
substantial costs.
Environmental Laws
Many of the U.S. laws and regulations referred to above are
environmental laws and regulations, which vary according
to the jurisdiction in which we conduct our operations. In
addition to state or local laws and regulations, our
operations are also subject to numerous federal
environmental laws and regulations. Below is a discussion
of some of the more significant federal laws and regulations
applicable to us and our operations.
Clean Air Act
The federal Clean Air Act and associated Federal and state
regulations regulate air emissions through permitting and/
or emissions control requirements. These regulations affect
the entire value chain from oil and natural gas production,
to gathering, to processing, to transmission and storage,
and then to distribution operations. Various equipment and
activities in our assets are subject to regulation, including
compressors, engines, dehydrators, storage tanks,
pneumatic devices, fugitive components, and blowdowns.
We obtain permits, typically from state or local authorities,
or document exemptions necessary to authorize these
activities. Further, we are required to obtain pre-approval
for construction or modification of certain facilities, and/or
to use specific equipment, technologies or best
management practices to control emissions. Some states
also require a separate operating permit to be obtained for
on-going operations.
Federal and state governmental agencies continue to
review and revise the air quality regulations affecting oil
and natural gas activities, and further regulation could
increase our cost or otherwise affect our ability to produce.
For instance, on March 7, 2024, the U.S. Environmental
Protection Agency (“EPA”) finalized New Source
Performance Standard Subpart OOOOb (NSPS OOOOb) for
new, modified, and reconstructed sources after
December 6, 2022, and Emissions Guideline Subpart
OOOOc (EG OOOOc) for sources existing prior to
December 6, 2022. Most provisions of NSPS OOOOb take
effect immediately while certain requirements have phase-
in periods. EG OOOOc requires individual states to
incorporate similar provisions into their regulations (or rely
upon EPA’s model requirements) and will require
approximately five years to be implemented. The affected
source categories under OOOOb and OOOOc include well
completions, fugitive emissions, liquids unloading, process
controllers, process pumps, storage vessels, and
associated gas.
EPA has also recently proposed two interrelated
regulations. On August 1, 2023, EPA proposed revisions to
the greenhouse gas reporting rule for the oil and natural
gas industry to change the calculation methodology to be
primarily based on actual emission measurements rather
than emission factors. These changes facilitate the
implementation of a methane fee under the Waste Emission
Charge (WEC) rule which was proposed on
January 26, 2024. Both rules are expected to be finalized
by August 2024 as required by the Inflation Reduction Act
(IRA) of 2022. Under the WEC rule, reporters would be
subject to a fee beginning in 2025 at $900 per ton of
methane emissions that exceed thresholds prescribed
under the rule. These methane emissions would be based
on those reported under the greenhouse gas reporting rule.
Clean Water Act
The federal Clean Water Act (“CWA”) and corresponding
state laws affect our operations by regulating storm water
or other discharges of substances, including pollutants,
sediment, and spills and releases of oil, brine and other
substances, into surface waters, and in certain instances
imposing requirements to dispose of produced wastes and
other oil and gas wastes at approved disposal facilities. The
discharge of pollutants into jurisdictional waters is
prohibited, except in accordance with the terms of a permit
issued by the EPA, the U.S. Army Corps of Engineers, or a
delegated state agency. These permits require regular
monitoring and compliance with effluent limitations, and
include reporting requirements. Federal and state
regulatory agencies can impose administrative, civil and/or
criminal penalties for non-compliance with discharge
permits or other requirements of the CWA and analogous
state laws and regulations.
Endangered Species and Migratory Birds
The Endangered Species Act and related state laws
regulations protect plant and animal species that are
threatened or endangered. The Migratory Bird Treaty Act
and the Bald and Golden Eagle Protection Act provides
similar protections to migratory birds and bald and golden
eagles, respectively. Some of our operations are located in
areas that are or may be designated as protected habitats
for endangered or threatened species, or in areas where
migratory birds or bald and golden eagles are known to
exist. Laws and regulations intended to protect threatened
and endangered species, migratory birds, or bald and
golden eagles could have a seasonal impact on our
construction activities and operations. New or additional
species that may be identified as requiring protection or
consideration could also lead to delays in obtaining permits
and/or other restrictions, including operational restrictions.
Safety of Gas Transmission and
Gathering Pipelines
Natural gas pipelines serving our operations are subject to
regulation by the U.S. Department of Transportation’s
PHMSA pursuant to the NGPSA, as amended by the Pipeline
Safety Act of 1992, the Accountable Pipeline Safety and
Partnership Act of 1996, the PSIA, the Pipeline Inspection,
Protection, Enforcement and Safety Act of 2006, and the
2011 Pipeline Safety Act. The NGPSA regulates safety
requirements in the design, construction, operation and
maintenance of natural gas pipeline facilities, while the PSIA
establishes mandatory inspections for all U.S. oil and natural
gas transmission pipelines in high-consequence areas.
Additionally, certain states, such as West Virginia, also
maintain jurisdiction over intrastate natural gas lines. In
October 2019, PHMSA finalized the first of three rules that,
collectively, are referred to as the natural gas “Mega Rule.”
The first rule imposed additional safety requirements on
natural gas transmission pipelines, including maximum
operating pressure and integrity management near HCAs
for onshore gas transmission pipelines. PHMSA finalized the
second rule extending federal safety requirements to
onshore gas gathering pipelines with large diameters and
high operating pressures in November 2021. PHMSA
published the final of the three components of the Mega
Rule in August 2022, which took effect in May 2023. The
final rule applies to onshore gas transmission pipelines,
clarifies integrity management regulations, expands
corrosion control requirements, mandates inspection after
extreme weather events, and updates existing repair
criteria for both HCA and non-HCA pipelines. Finally,
PHMSA published a Notice of Proposed Rulemaking
regarding more stringent gas pipeline leak detection and
repair requirements to reduce natural gas emissions on May
18, 2023. The adoption of laws or regulations that apply
more comprehensive or stringent safety standards could
increase the expenses we incur for gathering service.
Resource Conservation and Recovery Act
The federal Resource Conservation and Recovery Act
(“RCRA”) and corresponding state laws and regulations
impose requirements for the management, treatment,
storage and disposal of hazardous and non-hazardous
wastes, including wastes generated by our operations.
Drilling fluids, produced waters and most of the other
wastes associated with the exploration, development and
production of natural gas and oil are currently regulated
under RCRA’s solid (non-hazardous) waste provisions.
However, legislation has been proposed from time to time,
and various environmental groups have filed lawsuits, that,
if successful, could result in the reclassification of certain
natural gas and oil exploration and production wastes as
“hazardous wastes,” which would make such wastes subject
to much more stringent handling, disposal and clean-up
requirements. A change in the RCRA exclusion for drilling
fluids, produced waters and related wastes could result in
an increase in our costs to manage and dispose of
generated wastes, which could have a material adverse
effect on the industry as well as on our results of operations
and financial position.
Comprehensive Environmental Response,
Compensation, and Liability Act
The Comprehensive Environmental Response,
Compensation, and Liability Act (“CERCLA” or
“Superfund”) imposes joint and several liability for costs of
investigation and remediation, and for natural resource
damages without regard to fault or the legality of the
original conduct, on certain classes of persons with respect
to the release into the environment of substances
designated under CERCLA as hazardous substances. These
classes of persons, so-called potentially responsible parties
(“PRP”), include the current and past owners or operators
of a site where the release occurred and anyone who
disposed, transported, or arranged for the disposal,
transportation, or treatment of a hazardous substance
found at the site. CERCLA also authorized the EPA and, in
some instances, third parties to take actions in response to
threats to public health or the environment, and to seek to
recover from the PRPs the costs of such action. Many
states, including states in which we operate, have adopted
comparable state statutes.
Although CERCLA generally exempts “petroleum” from
regulation, in the course of our operations we have
generated and will generate wastes that may fall within
CERCLA’s definition of hazardous substances, and may
have disposed of these wastes at disposal sites owned and
operated by others. We may also be the owner or operator
of sites on which hazardous substances have been released.
In the event contamination is discovered at a site on which
we are or have been an owner or operator, or to which we
have sent hazardous substances, we could be jointly and
severally liable for the costs of investigation and
remediation and natural resource damages. Further, it is not
uncommon for neighboring landowners and other third
parties to file claims for personal injury and property
damage allegedly caused by hazardous substances or other
pollutants released into the environment.
Oil Pollution Act
The primary federal law related to oil spill liability is the Oil
Pollution Act (“OPA”), which amends and augments oil spill
provisions of the Clean Water Act and imposes certain
duties and liabilities on certain “responsible parties” related
to the prevention of oil spills and damages resulting from
such spills in or threatening waters of the United States or
adjoining shorelines. A liable “responsible party” includes
the owner or operator of a facility, vessel or pipeline that is
a source of an oil discharge or that poses the substantial
threat of discharge. OPA assigns joint and several liability,
without regard to fault, to each liable party for oil removal
costs and a variety of public and private damages.
Although defenses exist to the liability imposed by OPA,
they are limited. In the event of an oil discharge or
substantial threat of discharge, we may be liable for costs
and damages.
Regulation of the Sale and Transportation of
Natural Gas, NGLs and Oil
The transportation and sale, or resale, of natural gas in
interstate commerce are regulated by the Federal Energy
Regulatory Commission (“FERC”) under the Natural Gas
Act of 1938, the Natural Gas Policy Act of 1978, and
regulations issued under those statutes. FERC regulates
interstate natural gas transportation rates and terms and
conditions of service, which affects the marketing of natural
gas that we produce, as well as the revenues we receive for
sales of our natural gas. FERC regulations require that rates
and terms and conditions of service for interstate service
pipelines that transport crude oil and refined products and
certain other liquids be just and reasonable and must not be
unduly discriminatory or confer any undue preference upon
any shipper. FERC regulations also require interstate
common carrier petroleum pipelines to file with FERC and
publicly post tariffs stating their interstate transportation
rates and terms and conditions of service.
Section 1(b) of the Natural Gas Act exempts natural gas
gathering facilities from regulation by FERC. However, the
distinction between federally unregulated gathering
facilities and FERC regulated transmission facilities is a
fact-based determination, and the classification of facilities
is the subject of ongoing litigation. We own certain natural
gas pipeline facilities that we believe meet the traditional
tests FERC has used to establish a pipeline’s primary
function as “gathering,” thus exempting it from the
jurisdiction of FERC under the Natural Gas Act.
Intrastate natural gas transportation is also subject to
regulation by state regulatory agencies. The basis for
intrastate regulation of natural gas transportation and the
degree of regulatory oversight and scrutiny given to
intrastate natural gas pipeline rates and services varies from
state to state. Like the regulation of interstate
transportation rates, the regulation of intrastate
transportation rates affects the marketing of natural gas
that we produce, as well as the revenues we receive for
sales of our natural gas.
FERC regulates the transportation of oil and NGLs on
interstate pipelines under the provisions of the Interstate
Commerce Act, the Energy Policy Act of 1992 and
regulations issued under those statutes. Intrastate
transportation of oil, NGLs and other products is dependent
on pipelines whose rates, terms and conditions of service
are subject to regulation by state regulatory bodies under
state statutes.
Natural gas, NGLs and crude oil prices are currently
unregulated, but Congress historically has been active in
the area of natural gas, NGLs and crude oil regulation. We
cannot predict whether new legislation to regulate sales
might be enacted in the future or what effect, if any, any
such legislation might have on our operations.
Health and Safety Laws
Our operations are subject to regulation under the federal
Occupational Safety and Health Act (“OSHA”) and
comparable state laws in some states, all of which regulate
health and safety of employees at our operations.
Additionally, OSHA’s hazardous communication standard,
the EPA community right-to-know regulations under Title III
of the federal Superfund Amendment and Reauthorization

Act and comparable state laws require that information be
maintained about hazardous materials used or produced by
our operations and that this information be provided to
employees, state and local governments and the public.
Climate Change Laws and Regulations
Climate change continues to be a legislative and regulatory
focus. There are a number of proposed and recently-
enacted laws and regulations at the international, federal,
state, regional and local level that seek to limit greenhouse
gas emissions, and such laws and regulations that restrict
emissions could increase our costs should the requirements
necessitate the installation of new equipment or the
purchase of emission allowances. For example, the Inflation
Reduction Act, which was signed into law in August 2022,
includes a “methane fee” that is expected to be imposed
beginning with emissions reported for calendar year 2024.
In addition, the current U.S. administration has proposed
more stringent methane pollution limits for new and
existing gas and oil operations. These laws and regulations
could also impact our customers, including the electric
generation industry, making alternative sources of energy
more competitive and thereby decreasing demand for the
natural gas and oil we produce. Additional regulation could
also lead to permitting delays and additional monitoring
and administrative requirements, in turn impacting
electricity generating operations.
At the international level, President Biden has recommitted
the United States to the UN-sponsored “Paris Agreement,”
for nations to limit their greenhouse gas emissions through
non-binding, individually-determined reduction goals every
five years after 2020. In April 2021, President Biden
announced a goal of reducing the United States’ emissions
by 50 – 52% below 2005 levels by 2030. In November 2021,
the international community gathered in Glasgow at the
26th Conference of the Parties to the UN Framework
Convention on Climate Change, during which multiple
announcements were made, including a call for parties to
eliminate certain fossil fuel subsidies and pursue further
action on non-carbon dioxide greenhouse gases. In a
related gesture, the United States and the European Union
jointly announced the launch of the “Global Methane
Pledge,” which aims to cut global methane pollution by at
least 30% by 2030 relative to 2020 levels, including “all
feasible reductions” in the energy sector. Such
commitments were re-affirmed at the 27th Conference of
the Parties in Sharm El Sheikh. Although it is not possible at
this time to predict how legislation or new regulations that
may be adopted pursuant to the Paris Agreement to
address greenhouse gas emissions would impact our
business, any such future laws and regulations imposing
reporting obligations on, or limiting emissions of
greenhouse gases from, our equipment and operations
could require us to incur costs to implement such measures
associated with our operations.
In addition, activists concerned about the potential effects
of climate change have directed their attention at sources
of funding for energy companies, which has resulted in
certain financial institutions, funds and other sources of
capital restricting or eliminating their investment in natural
gas and oil activities. Ultimately, this could make it more
difficult to secure funding for exploration and production
activities. Litigation risks are also increasing, as a number of
cities and other local governments have sought to bring
suits against the largest oil and natural gas exploration and
production companies in state or federal court, alleging,
among other things, that such companies created public
nuisances by producing fuels that contributed to global
climate change effects, such as rising sea levels, and
therefore are responsible for roadway and infrastructure
damages, or alleging that the companies have been aware
of the adverse effects of climate change for some time but
defrauded their investors by failing to adequately disclose
those impacts.
Additionally, the SEC published its long-awaited climate
rule in early March 2024, requiring the disclosure of a range
of climate-related risks and financial impacts. We are
currently assessing this rule, and at this time we cannot
predict the costs of implementation or any potential
adverse impacts for either the Group or our customers
resulting from the rule. Additionally, enhanced climate
disclosure requirements could accelerate the trend of
certain stakeholders and lenders restricting or seeking more
stringent conditions with respect to their investments in
certain carbon-intensive sectors.


A Letter from Our Senior
VP of Sustainability
“ |
|||
We remain focused on environmental
stewardship as well as meaningful and
effective employee and community
engagement, delivered with an intentional
adherence to a strong foundation of
good governance.”
|
Sustainability Review
Thank you for your interest in Diversified’s sustainability
journey, which we believe aligns with not only our
stewardship business model but also value creation for our
stakeholders. I am pleased to share this annual review of
the successes and challenges on our 2023 journey,
inclusive of updates on key environmental, social and
governance objectives.
Of primary importance and consideration to our
sustainability efforts is our environmental impact, and
specifically our emissions footprint. During 2023, our well
tenders and midstream personnel remained focused on
progressing voluntary leak detection and repairs and other
emission reduction initiatives, while our environmental
teams were equally focused on identifying, researching and
field testing a multitude of emission abatement or reduction
technology alternatives for consideration in our near- and
long-term emissions reduction roadmap in order to achieve
our stated 2040 net zero goal.
These diligent efforts benefited the Group alongside both
our long-standing, proven Smarter Asset Management
optimization and efficiency improvement actions and the
increasingly demonstrable environmental and risk
mitigation wins from our multiple remote monitoring Gas
Control and Integrated Operating centers.
As we have said before, we are committed to reporting
transparently on our performance, even when it falls short
of our expectations. For example, our 2023 personal safety
performance did not meet our high standards as it relates
specifically to Total Recordable Incident Rate which
increased year-over-year as a result of an increase in
reported incidents. While our OneDEC corporate culture
and number one daily priority of ‘Safey-No Compromises’
remains steadfast, what is changing is our approach of how
improvement is best achieved.
Much like we did previously when liquids spill rates were
not meeting our expectations, we have already begun
dedicating focused time, attention and manpower to this
matter to ascertain how best to move forward with making
improvements. Having identified accountability as a key
contributor to this shortfall, we have already begun
addressing accountability with both field leadership and
staff. We look forward to sharing more about these actions
as we work towards delivering on the high expectations we
set for ourselves.
During 2023, we also updated our periodic materiality
assessment with both internal and external stakeholders,
the results of which reflected that employee safety remains
our top priority across the stakeholder groups. These
results reinforce our desire and drive to promptly and
appropriately address all matters related to employee
safety, beginning with our work thus far on TRIR.
We remain committed to setting appropriate objectives
related to our sustainability journey and reporting
transparently on the same. This priority is being recognized
in the marketplace as evidenced by our 2022 Sustainability
Report receiving the ESG Report of the Year award from
ESG Awards 2023 and that same report driving an
improved MSCI ESG rating score to Leadership status.
Furthermore, the Oil and Gas Methane Partnership 2.0 has
awarded our emissions reduction roadmap a Gold Standard
Pathway designation for the second consecutive year,
signaling the validity of our environmental stewardship
model and transparency thereof.
2023 was another successful year in many respects, but we
will not stop there as we have much more we want, and
need, to do to bolster our long-term sustainability. We will
remain focused on environmental stewardship (PLANET) as
well as meaningful and effective employee and community
engagement (PEOPLE), delivered with an intentional
adherence to a strong foundation of good governance
(PRINCIPLES).
The best is yet to come!

Teresa B. Odom
Senior Vice President - Sustainability
March 19, 2024
Additional information on our climate, environmental, safety and
social performance will be available in our separate sustainability
communications on our website at www.div.energy.
Our Strategy Supports Sustainability
Our sustainability strategy is centered around prudent risk management,
asset integrity, employee safety, environmental protection, and emissions
reduction. From the wellhead to the boardroom, we are committed to our
role as responsible stewards of the natural resources we manage, the
people we employ and the environment in which we operate. We strive to
adhere to quality operating standards with a strong focus on the
environment, the health and safety of employees and positive
engagement with our local communities.
We believe our efforts to connect the meaningful and differentiated
attributes associated with our natural gas will increasingly be recognized
by the market as value is progressively placed on highly responsible
operators of natural gas assets. We are committed to addressing key
climate and environmental issues for our PLANET and likewise relevant
social issues for the PEOPLE across our operations, and doing so with a
constant focus on the values and PRINCIPLES under which we were
founded and continue to operate.
|
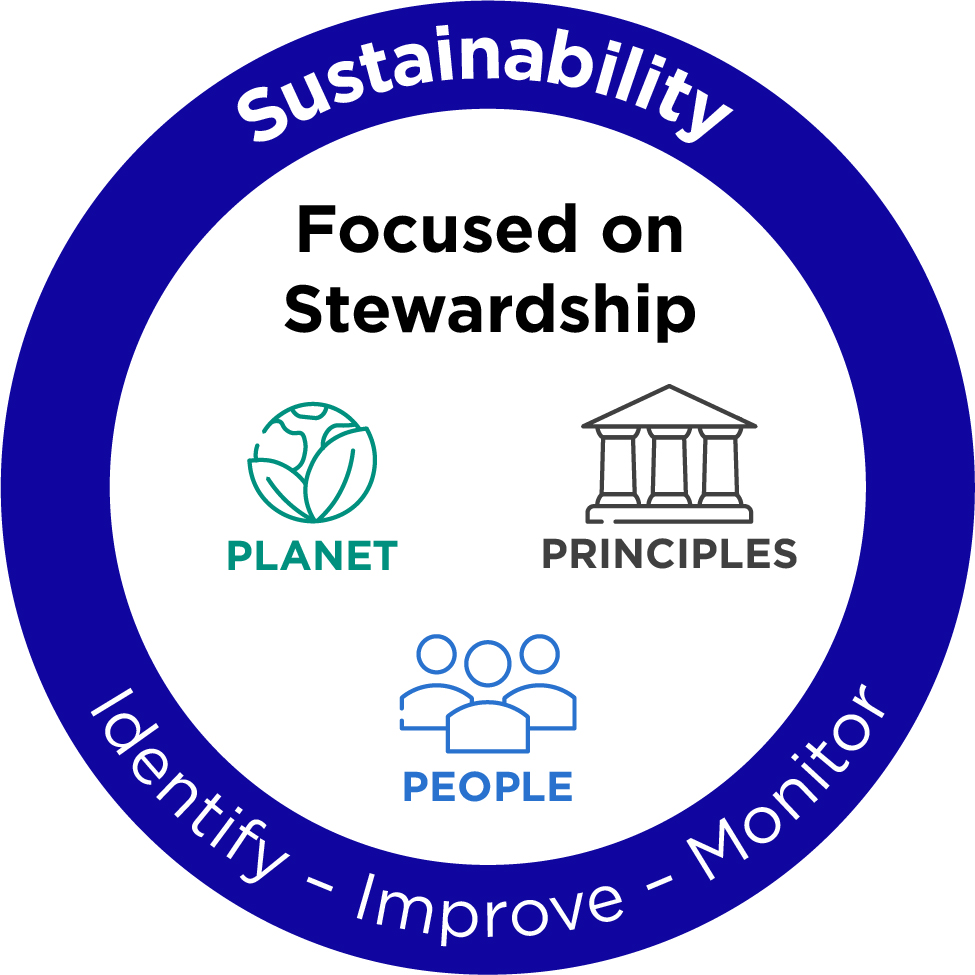 |
Commitment to Leadership and Transparency
Responsible stewardship and sustainability go hand-in-hand
and are at the core of our operations. Through sustainability
leadership and our unique business model, we
systematically strengthen our performance and execute on
our sustainability plans and commitments. We work
diligently to foster a culture of stewardship and
transparency, and a key aspect of our approach is to seek
stakeholder input while also keeping them apprised of
progress against our sustainability ambitions.
In 2023, we updated our periodic, formal multi-stakeholder
materiality assessment, utilizing our prior materiality
assessment, stakeholder outreach and peer benchmarking
to identify 29 relevant topics spread among eight key
clusters that include health and safety, climate change,
environmental management, resource management,
socio-economic value creation, our employees, suppliers
and partners, and risks and compliance.
We engaged both internal stakeholders such as Board
members and employees at all levels and locations as well
as external stakeholders across our value chain such as
equity and debt investors, financial service providers, trade
associations, customers, contractors and suppliers. The
assessment was conducted via a third-party, anonymous
online survey and the results were then compiled for
distribution and review by management and the
Sustainability & Safety Committee.
Among the relevant topics, the survey reflected that eight
topics of the top ten shared highest materiality among both
internal and external stakeholders, including the following:
—Employee safety
—Driver safety
—Cybersecurity
—Legal compliance
—Accident prevention
—Ethical behavior
—Access to funding
—Incident management
Survey over survey, the protection and safety of employees
continues to be a top priority while cybersecurity and
related data protection protocols was the single largest
upward mover and is now a top five priority for internal
stakeholders and likewise a top ten priority for external
stakeholders. Safe and efficient asset retirement fell out of
the top five relevance for both internal and external
stakeholders, though remains a top ten priority for external
stakeholders. For external stakeholders, emissions control
and reductions also fell in relevance, settling among their
top 20 material topics. Importantly, all of these issues
should not be viewed in isolation as they are increasingly
interconnected and can often impact each other.
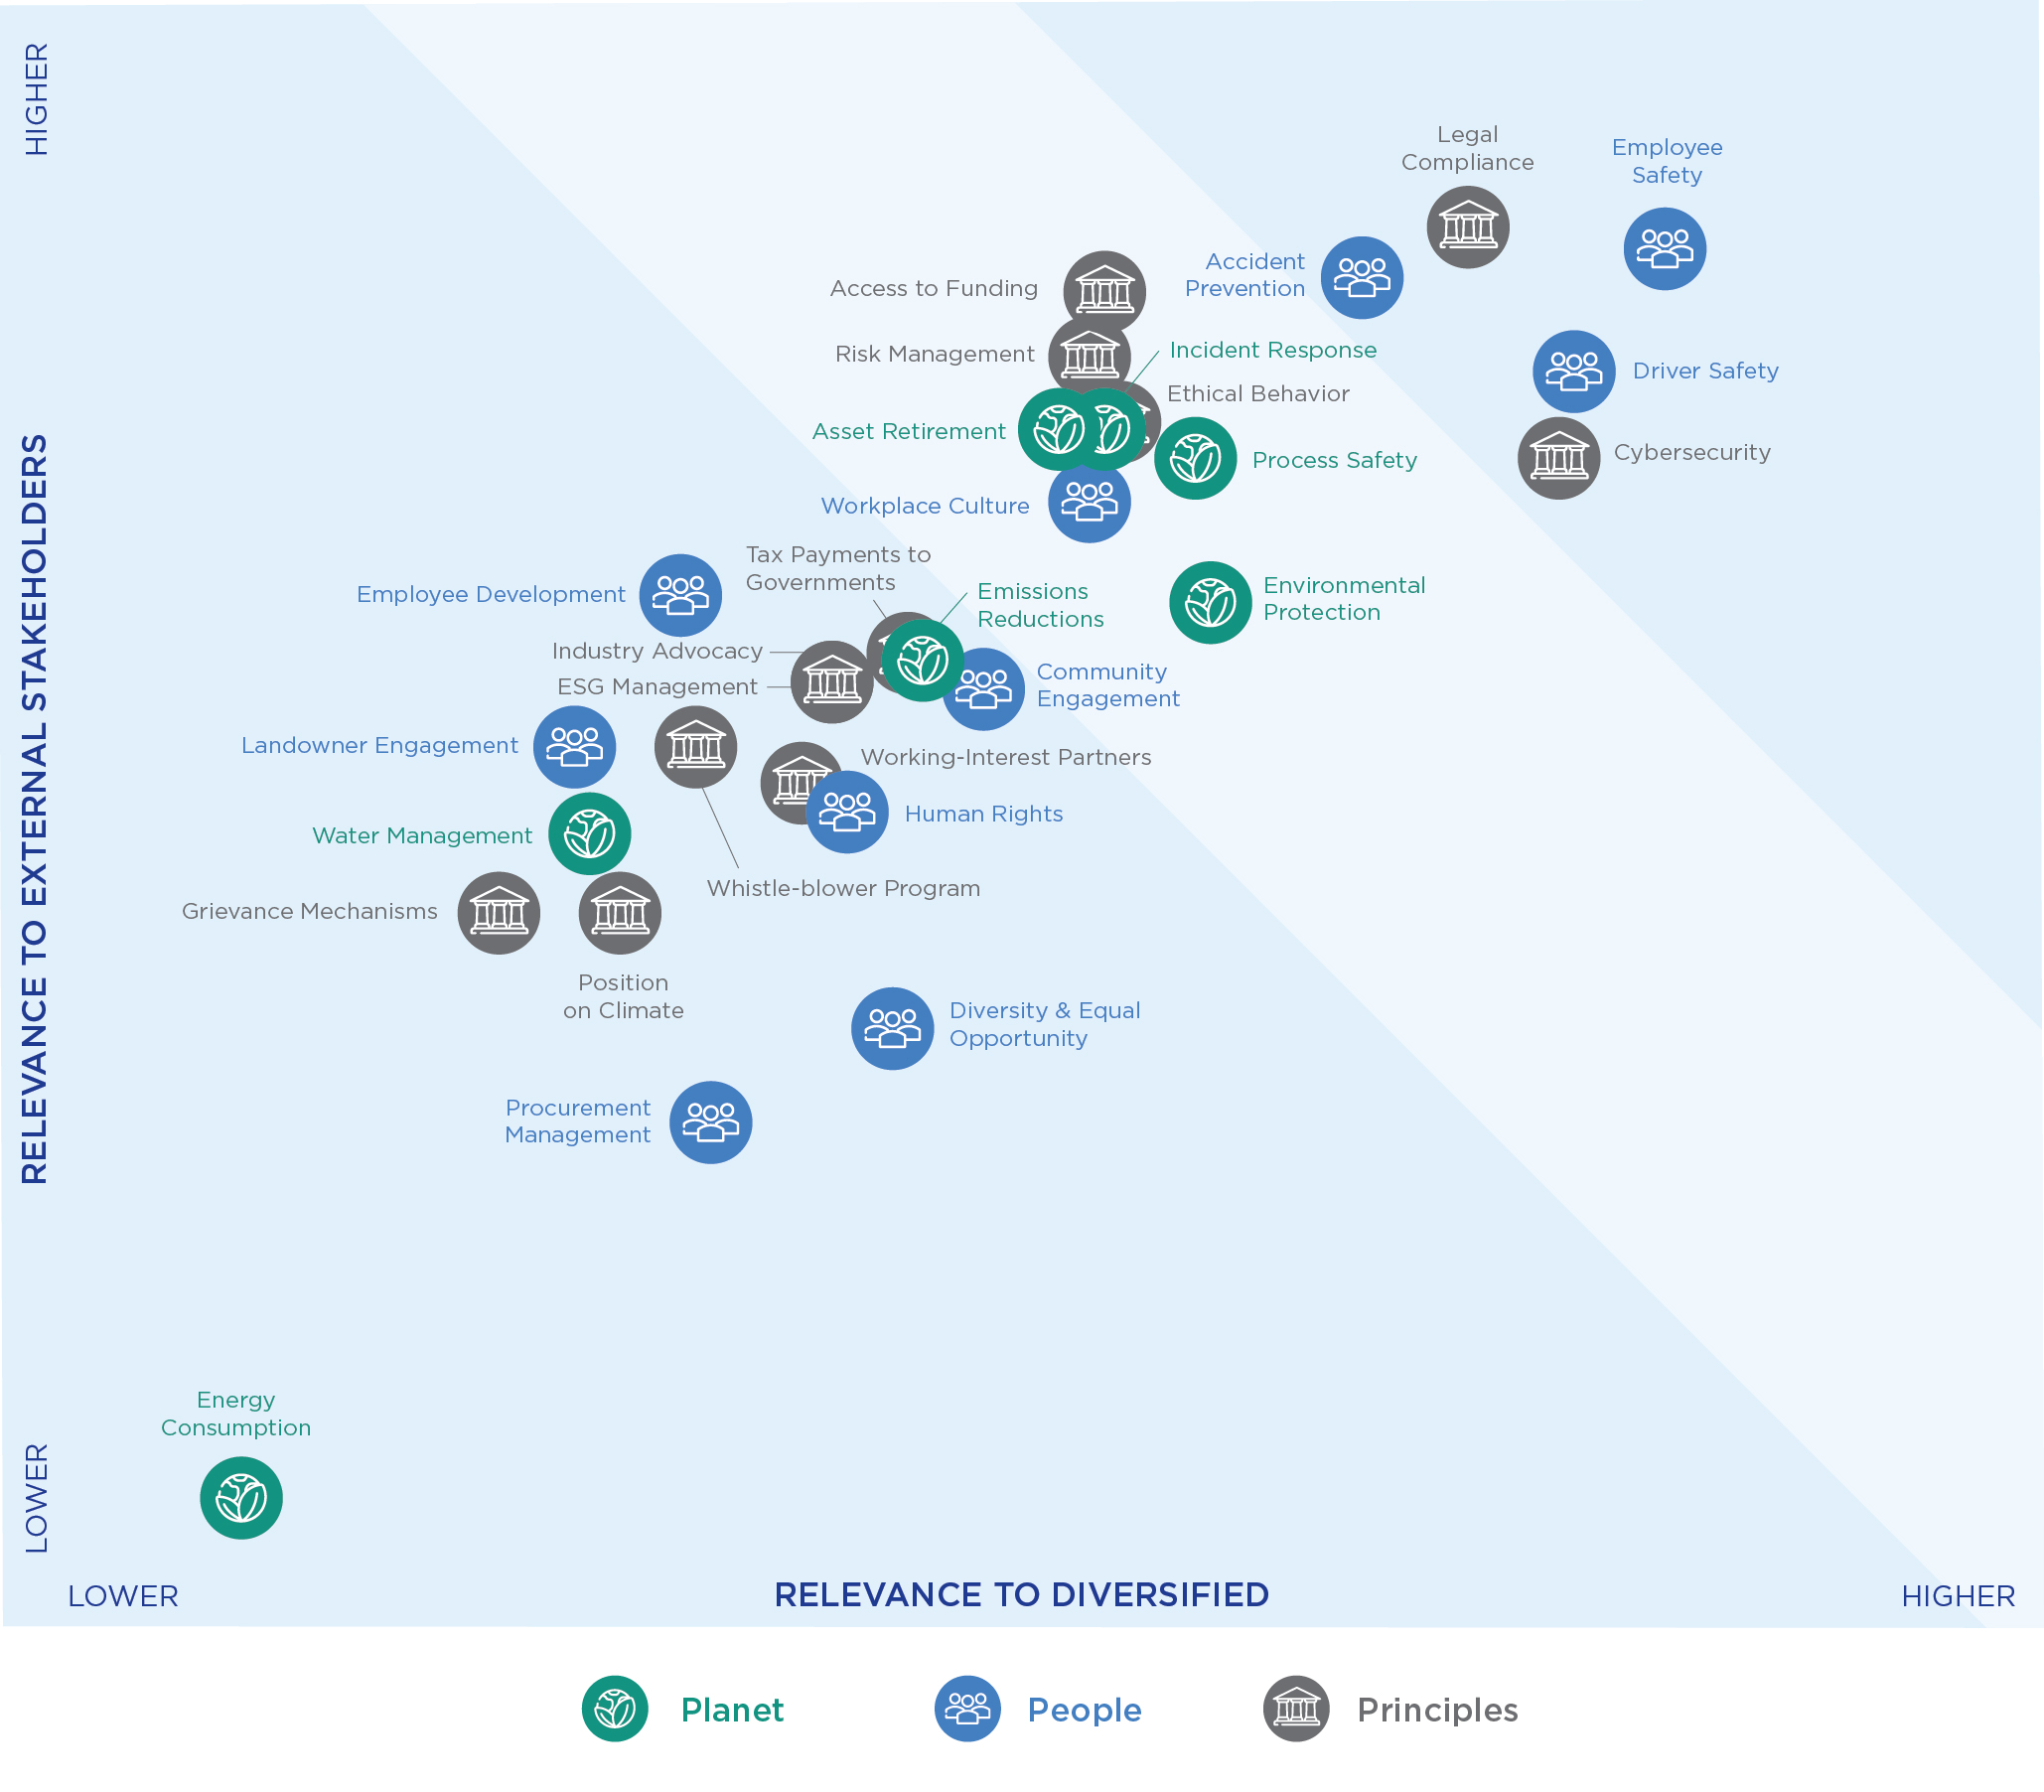
Our Approach to Sustainability
Our approach to sustainability encompasses consideration
of our climate, environmental and social impacts as well as
our responsibility to conduct business in accordance with
the highest standards of governance. These topics remain
front of mind as we proudly accept the responsibility and
privilege to be part of the solution to the significant
challenges of our country’s energy, climate and economic
security. To that end,
—by providing a reliable supply of abundant domestic
energy from assets that have a significantly smaller
environmental footprint than newly drilled wells, we
support our nation’s energy security.
—by making investments and implementing measures to
reduce emissions at the facilities we acquire, producing
differentiated natural gas through our industry-
recognized emissions detection, measurement and
mitigation processes, and retiring orphan wells for
several states, we are part of the solution for
climate security.
—by providing an affordable and sustainable domestic
energy supply while also providing both direct and
indirect employment, paying mineral royalties, and
supporting tax revenues for the communities where we
operate, we are grateful to be contributing to our
country’s economic security.
LIFE-CYCLE STEWARDSHIP
With a unique business model that reflects growth through
acquisitions and an operating strategy that embodies
stewardship of our natural resources and the environment,
we understand the importance of a full, life-cycle focus on
the assets we manage. As such, we have established an
employee-driven, data-focused sustainability program
which integrates sustainability considerations and actions
throughout our assets’ life cycles, beginning with pre-
acquisition diligence screening and continuing until we
safely and permanently retire the acquired assets at the end
of their productive lives. These considerations are the very
heart of the operational priorities that collectively represent
our proven SAM program, which is designed to increase
efficiencies, reduce fugitive greenhouse gas (“GHG”)
emissions, and deliver improvements in production at
existing facilities.
SUPPORTING LONG-TERM SUSTAINABILITY
We view sustainability through the lens of creating
long-term sustainable value for our stakeholders while
ensuring our daily actions contribute to a sustainable
environment and planet for society at large. We
demonstrate this focus when we align our stewardship-
focused business model and OneDEC culture with our
commitment to continuously identify, improve and monitor
our sustainability actions, as evidenced through our setting
and tracking of relevant and measurable targets.
These targets include, in part, our previously disclosed
Scope 1 methane emissions intensity reductions of 30% and
50% by 2026 and 2030, respectively, as compared to our
2020 baseline. Ongoing human and financial capital
investments across our asset portfolio, aimed largely at
methane reduction through leak detection and repair
“(LDAR”) efforts and conversion of natural gas-driven
pneumatic devices to compressed air, contributed to a 33%
reduction in reported methane emissions intensity for
While this accomplishment achieves our 2030 reduction
target seven years earlier than anticipated, we continue to
seek opportunities to further reduce our methane footprint.
In light of forthcoming environmental regulations that may
add new source categories of reported emissions, we will
evaluate those regulations as we consider new interim
targets. Even so, our year-over-year focused efforts and
life-cycle stewardship actions will continue to play a vital
role in keeping us on track toward our stated goal of Scope
1 and 2 net zero absolute GHG emissions by 2040.
In addition to our own guiding values for sustainability
management, we also utilize the United Nations’
Sustainable Development Goals (“SDGs”), which call on
individuals, corporations and governments to work
together towards the ultimate, unified goal of creating a
better and more sustainable future for all citizens globally.
At Diversified, we challenge ourselves to consider these
topics and more when we effectuate our business model,
corporate strategy, sustainability commitments, daily
operations, and risk management practices. We believe our
OneDEC approach supports important contributions to the
SDGs illustrated below, and we’ve identified several other
SDGs to which our business model aligns yet also provides
added opportunities for us to make continuous
improvement and contribution.
 |
 |
 |
 |
 |
 |
Task Force on Climate-Related
Financial Disclosures (“TCFD”)
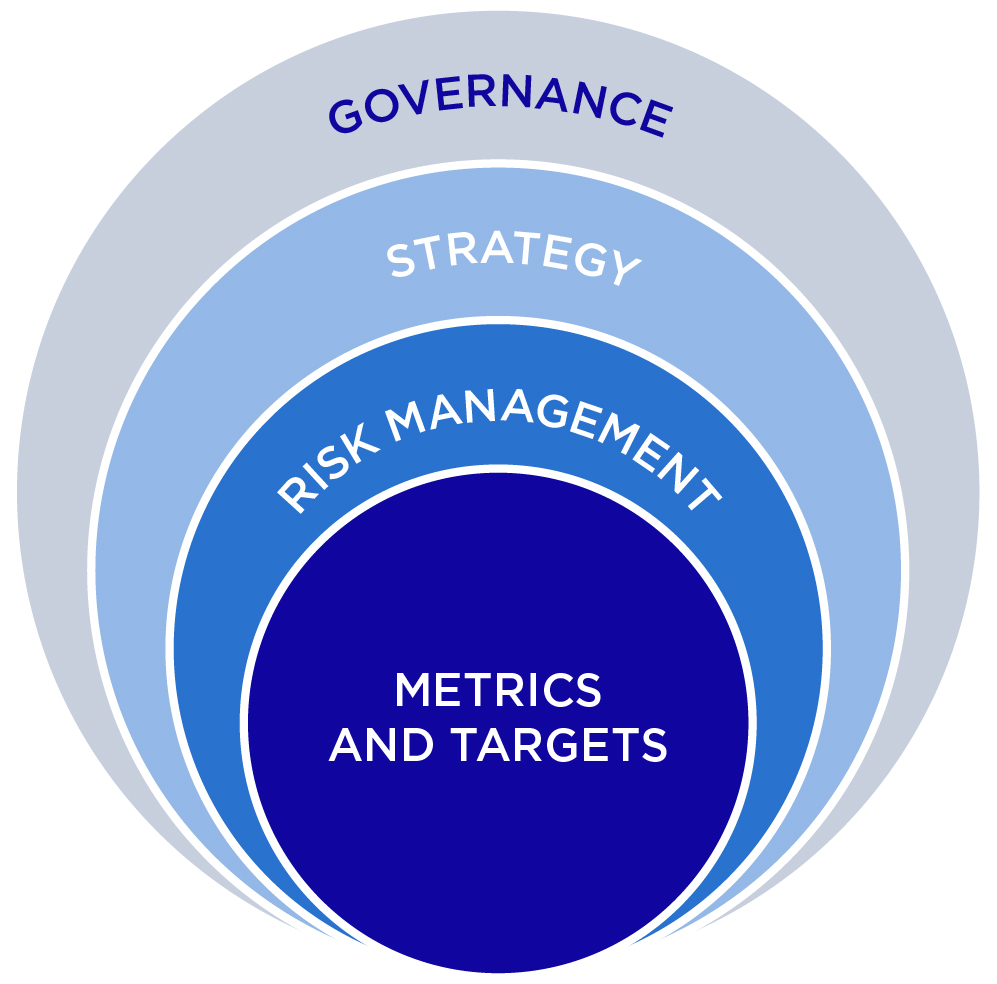
The report is consistent with the recommendations of the
TCFD, with the exception of Scope 3 emissions, as noted
below, and in line with the Financial Conduct Authority’s
Listing Rule 9.8.6 requirement. The report also reflects the
guidance provided in Section C of the TCFD Annex, entitled
“Guidance for All Sectors” and Section E of the TCFD
Annex, entitled “Supplemental Guidance for Non-Financial
Groups”, related to the Energy sector. We are in the
process of developing a Scope 3 inventory in line with
existing protocols and evolving market expectations and
aim to report Scope 3 emissions for the 2024 year end.
While we remain focused on emissions reductions where we
have the most control, and thus are making good progress
in decarbonizing our own operations, we recognize that the
GHG emissions associated with our value chain are
proportionately greater than non-energy producing
companies as our Scope 3 emissions are associated mostly
with the end-use of our products. Therefore, we seek to
identify GHG reduction opportunities from our upstream
and downstream supply chains. We also evaluate initiatives,
including renewable natural gas and carbon capture and
storage projects which, in the longer-term, would allow us
to mitigate or offset some or all of our Scope 1 and
2 GHG emissions.
 |
GOVERNANCE
EMBEDDING SUSTAINABILITY ACROSS THE
ORGANIZATION
|
Our Board of Directors (“Board” or “Directors”) continues
to take a hands-on approach to identifying, assessing and
managing climate-related risks and seeking new
commercial opportunities from an energy transition, such as
alternative uses for our wellbores. The processes by which
the Board does this are fully integrated into our Board
calendar and our governance procedures. Climate-related
topics were included in discussions at each of the six
regular Board meetings held throughout 2023.
The Directors receive regular briefings at Board meetings
on applicable climate matters from the Executive team as
well as the Chair of the Sustainability & Safety Committee.
From time to time the Board also receives training or
briefings from external third-party experts on specific
topics. In 2023, Deloitte LLP delivered a board education
session on biodiversity and the upcoming Taskforce on
Nature-related Financial Disclosures (“TNFD”).
Key climate-related topics discussed by the Board
throughout 2023, included:
—Assessing progress on emission detection and
mitigation, including handheld fugitive surveys and
repair, pneumatic conversions, aerial LiDAR, and
compressor conversions;
—Reviewing output from the marginal abatement cost
curve ("MACC") and approving the Emissions Program
budget for 2023; and
—Ensuring proposed acquisitions are consistent with
emissions reduction targets and plans.
Using an internally developed acquisition emissions
screening tool, target assets are assessed for their methane
intensity in accordance with the Methane Intensity Protocol
developed by the Natural Gas Sustainability Initiative
(“NGSI"). This information is then used by the Board as one
metric to inform its acquisition decision-making. The NGSI
voluntary reporting protocol complements existing
regulatory reporting by providing a consistent, transparent
and comparable methodology for measuring and reporting
methane emissions throughout the natural gas supply chain.
Our Board Committees provide oversight of our climate-
related risks and opportunities although these
considerations are a primary focus of our Sustainability &
Safety Committee. The roles of the four Board Committees
are reflected in the climate-related governance framework
depicted below.
CLIMATE-RELATED GOVERNANCE FRAMEWORK - BOARD
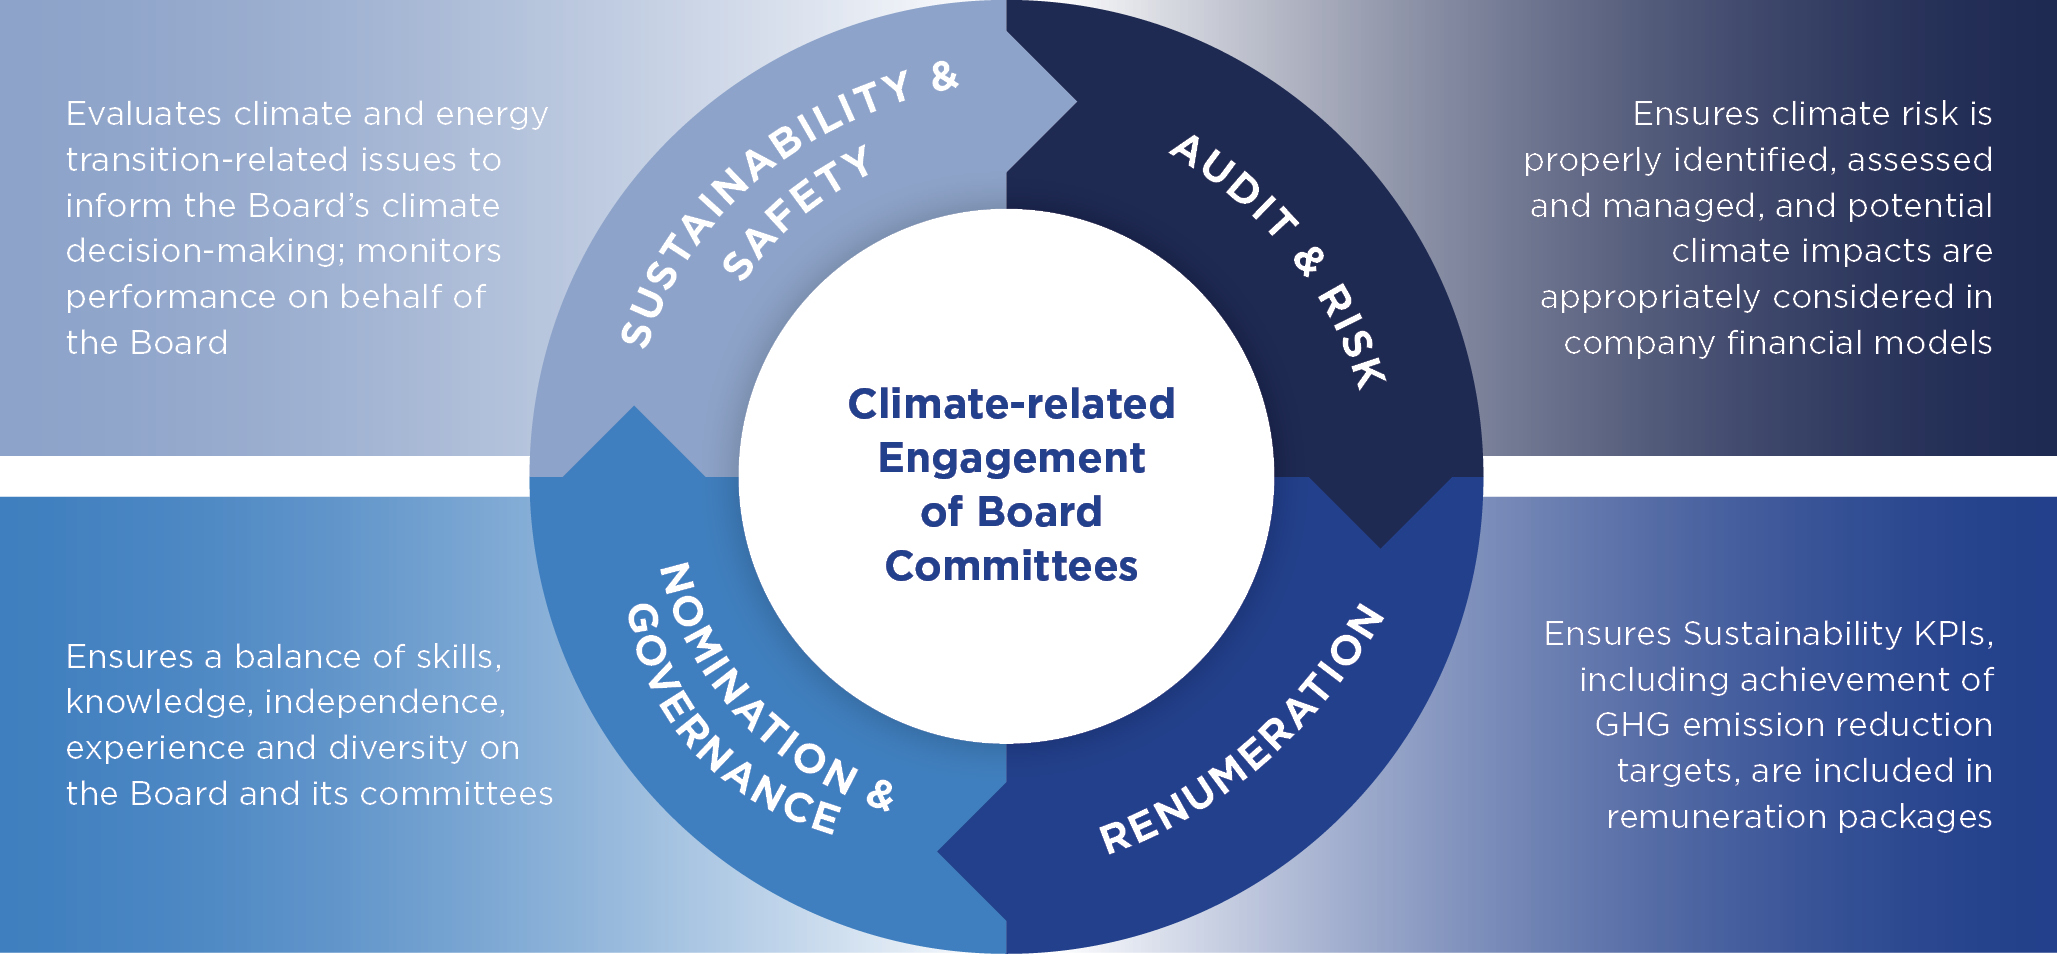
MANAGEMENT’S ROLE IN ASSESSING & MANAGING
CLIMATE-RELATED RISKS & OPPORTUNITIES
Management remains abreast of climate-related issues
through (i) its knowledge of our industry, business
environment and ongoing operating activities, (ii) frequent
interactions with both internal and external stakeholders,
including senior leaders in the Group, state and national
regulators and investors, and (iii) engagement with
vendors, industry associations and benchmarking groups
where current trends and best practice operating standards
and emissions reductions solutions are shared.
Climate-related responsibilities are assigned to
management-level positions according to each individual’s
area of responsibility and contribution to our overall
corporate strategy.
Collectively, our executive team, including in part the CEO,
CFO, COO (formerly) and Executive Vice President-
Operations (presently), provide frequent climate-related
operational and financial updates to the Board at each
Board meeting and throughout the year via interim
communications. However, the CEO assumes ultimate
responsibility for delivery of the Group’s climate and energy
transition strategy, including management of climate-
related risks and opportunities.
Climate-related actions by management during the year
include, but are not limited to: ensuring annual budgets
include operating and expenses for climate initiatives;
considering the impacts of new or emerging climate-related
policy and regulatory development on the Group; aiding in
the design or advancement of emission reduction initiatives;
ensuring Board directives on climate are integrated into
appropriate compensation plans and monitoring progress
of the same; and considering the impact of potential
acquisitions on standalone and consolidated Group
emissions and decarbonization strategies.
THE CULTURAL SHIFT UNDERPINS OUR TRANSITION TO
NET ZERO
Environmental management and the energy transition are
deeply embedded into our company’s culture and actions,
as climate impact is recognized as a key strategic
consideration across multiple business functions. For
example, we have trained and equipped 100% of our well
tenders to become leak detection and repair technicians.
Finding and repairing leaks has always been a priority for
Diversified and is truly just a daily routine for our employees
as we seek to positively impact our climate while delivering
a lower-carbon energy solution to market. Furthermore, at
an operational level, we have optimized well tender routes
to increase efficiency and reduce driving time, therefore
reducing emissions. We also use lightweight, fuel-efficient,
well-maintained vehicles to drive down fuel consumption.
In addition to the aforementioned responsibilities of various
teams with regard to climate oversight and action, the
figure below provides a broader view of certain individual
company departments whose actions incorporate
climate considerations.
CLIMATE CULTURE DRIVES DAILY ACTIONS
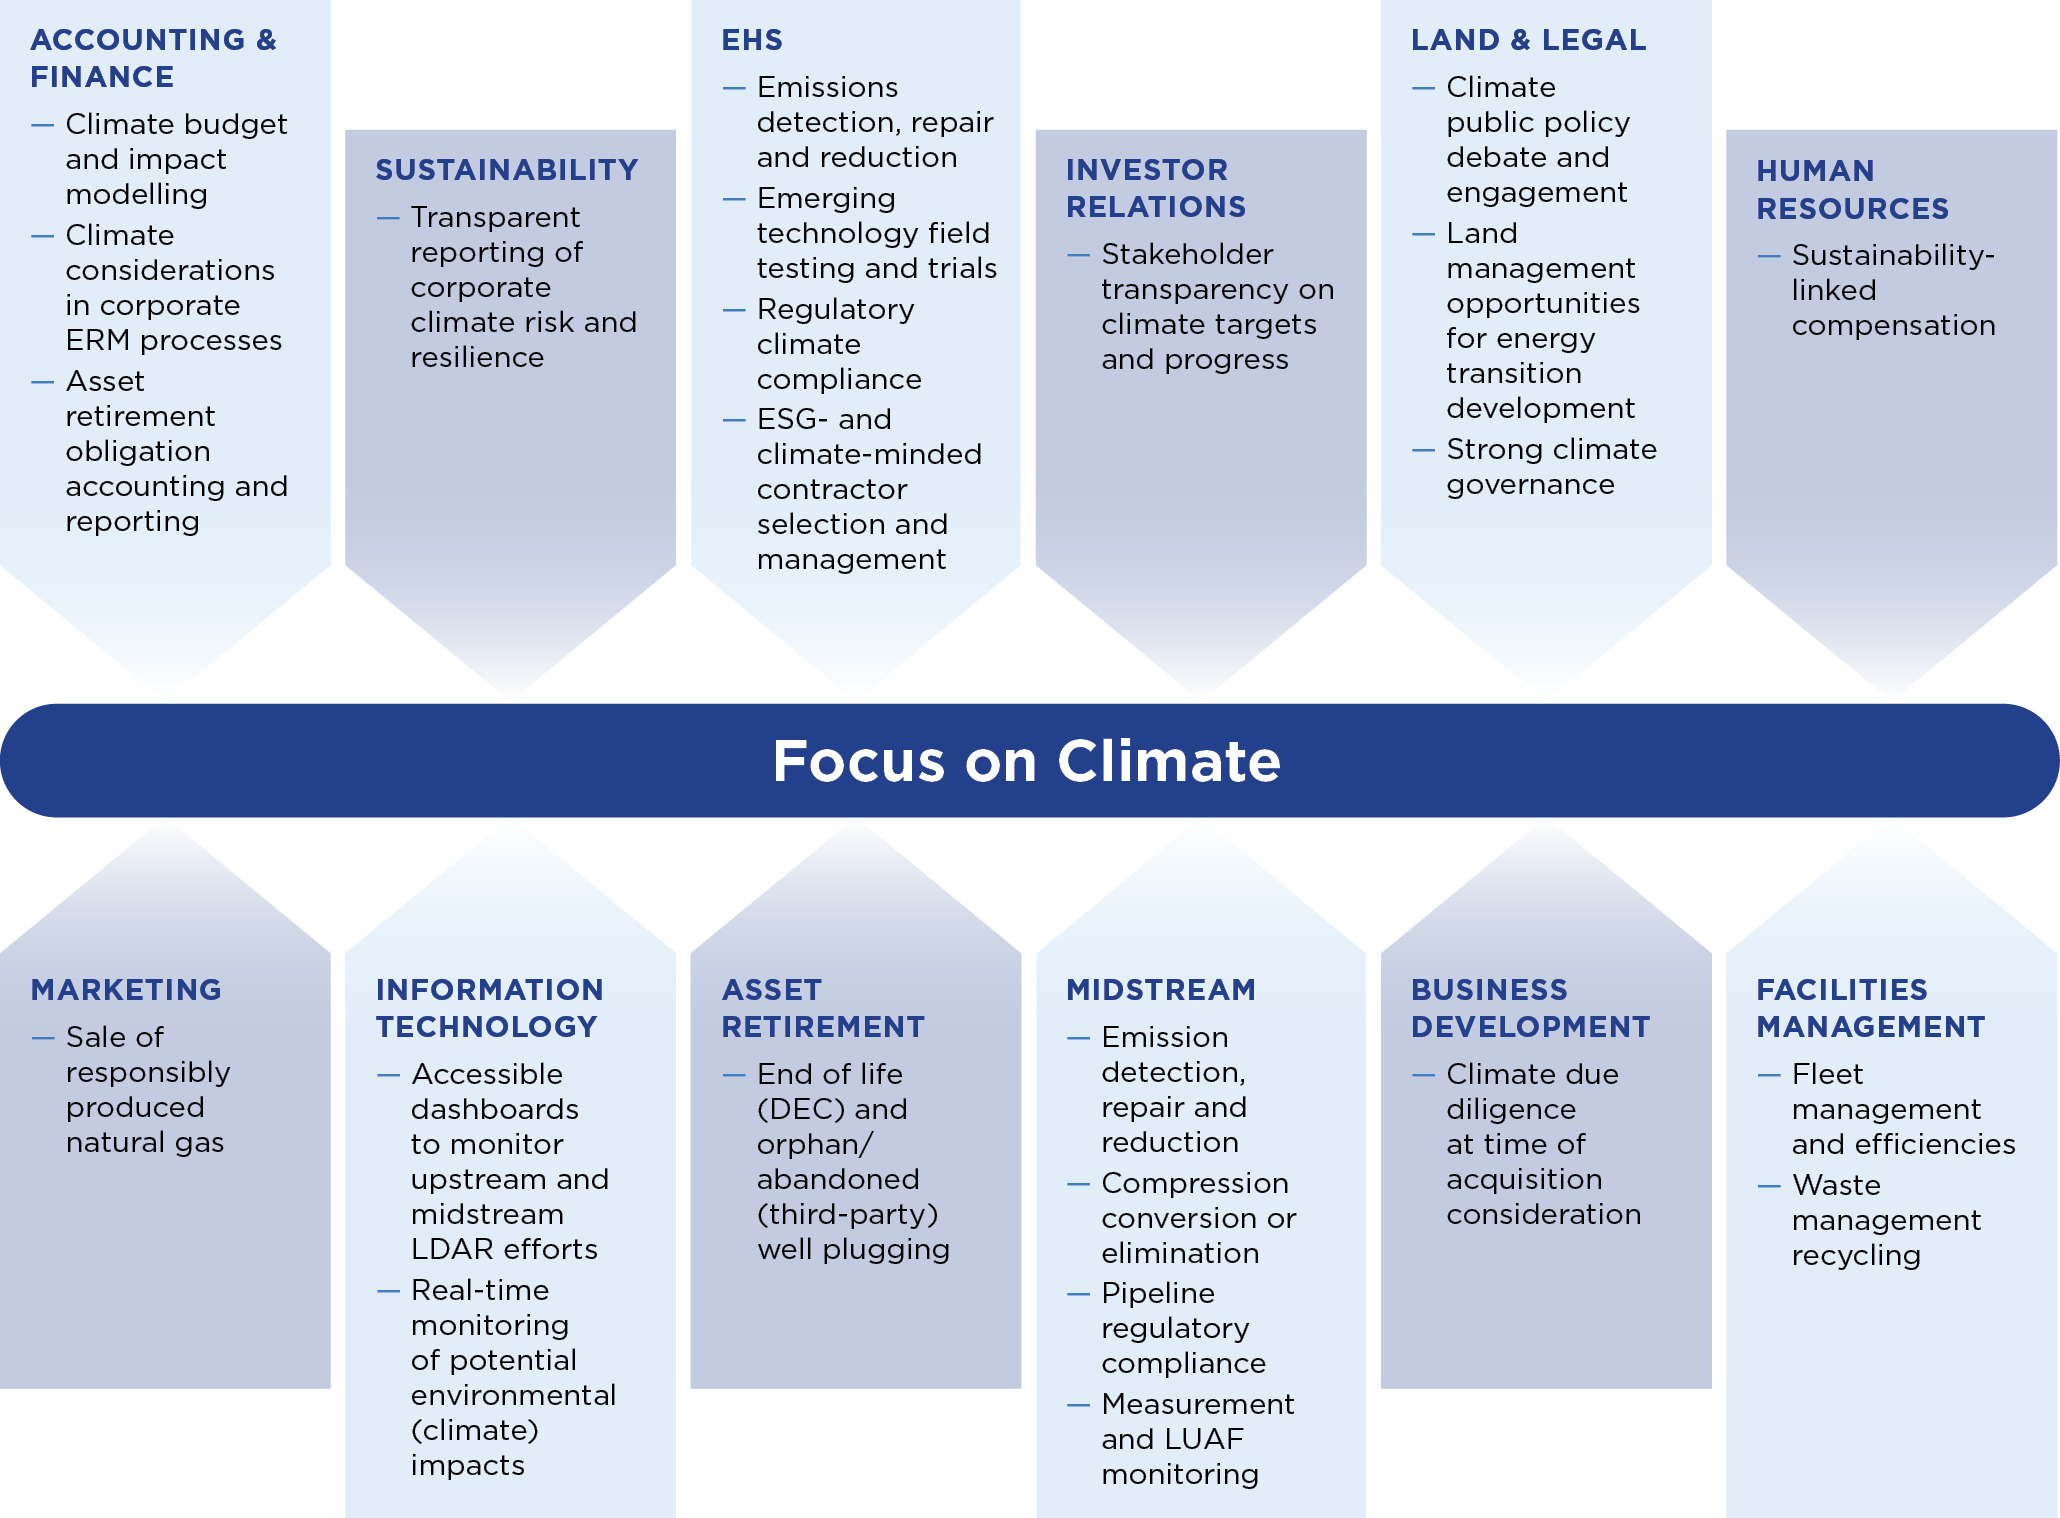
 |
STRATEGY
UNDERPINNED BY DE-METHANIZATION OF
OUR GAS PRODUCTION
|
The reduction of methane emissions is at the heart of our
corporate strategy and underpins our pragmatic approach
to the ongoing decarbonization of our operations.
While our de-methanization activities are focused on the
decarbonization of our existing assets, we are also keen to
explore opportunities that will help us utilize our asset
portfolio, as well as our skills and competencies, beyond our
current business model.
OUR NET ZERO PATHWAY: OUTPERFORMING
OUR TARGETS
In line with our pragmatic approach, we set out our
emissions reduction targets aiming to reduce Scope 1
methane intensity by 30% by 2026 and 50% by 2030,
reaching net zero from Scope 1 and 2 absolute GHG
emissions by 2040. We also set out our net zero pathway
showing how we plan to achieve our targets, beginning
with a near-term focus on methane emissions, as
depicted below.
We have been resolute in our focus on reducing emissions
from our operations. We are delighted that our significant
efforts to date, largely through the deployment of state-of-
the-art technologies for methane detection and reduction
and the conversion of natural gas-driven pneumatic
devices, have yielded outstanding results, with our 2030
methane intensity reduction target being achieved in 2023,
seven years ahead of schedule and directly aiding our
overall goal toward net zero in 2040.
Even so, we will continue to progress our decarbonization
strategy, focusing primarily on additional methane emission
reductions in the near-term as we seek to unpack the
impact on our reported emissions from new EPA
regulations where future real emission reductions could be
offset by potential increases stemming from both recent
and forthcoming changes in regulatory reporting
requirements. We are committed to tackling those changes
and delivering tangible results with continued financial
investment and diligent execution to achieve our 2040 net
zero GHG goal.
We discuss our deployment of decarbonization
technologies in the Climate-related Risks and Opportunities
tables on the following pages.
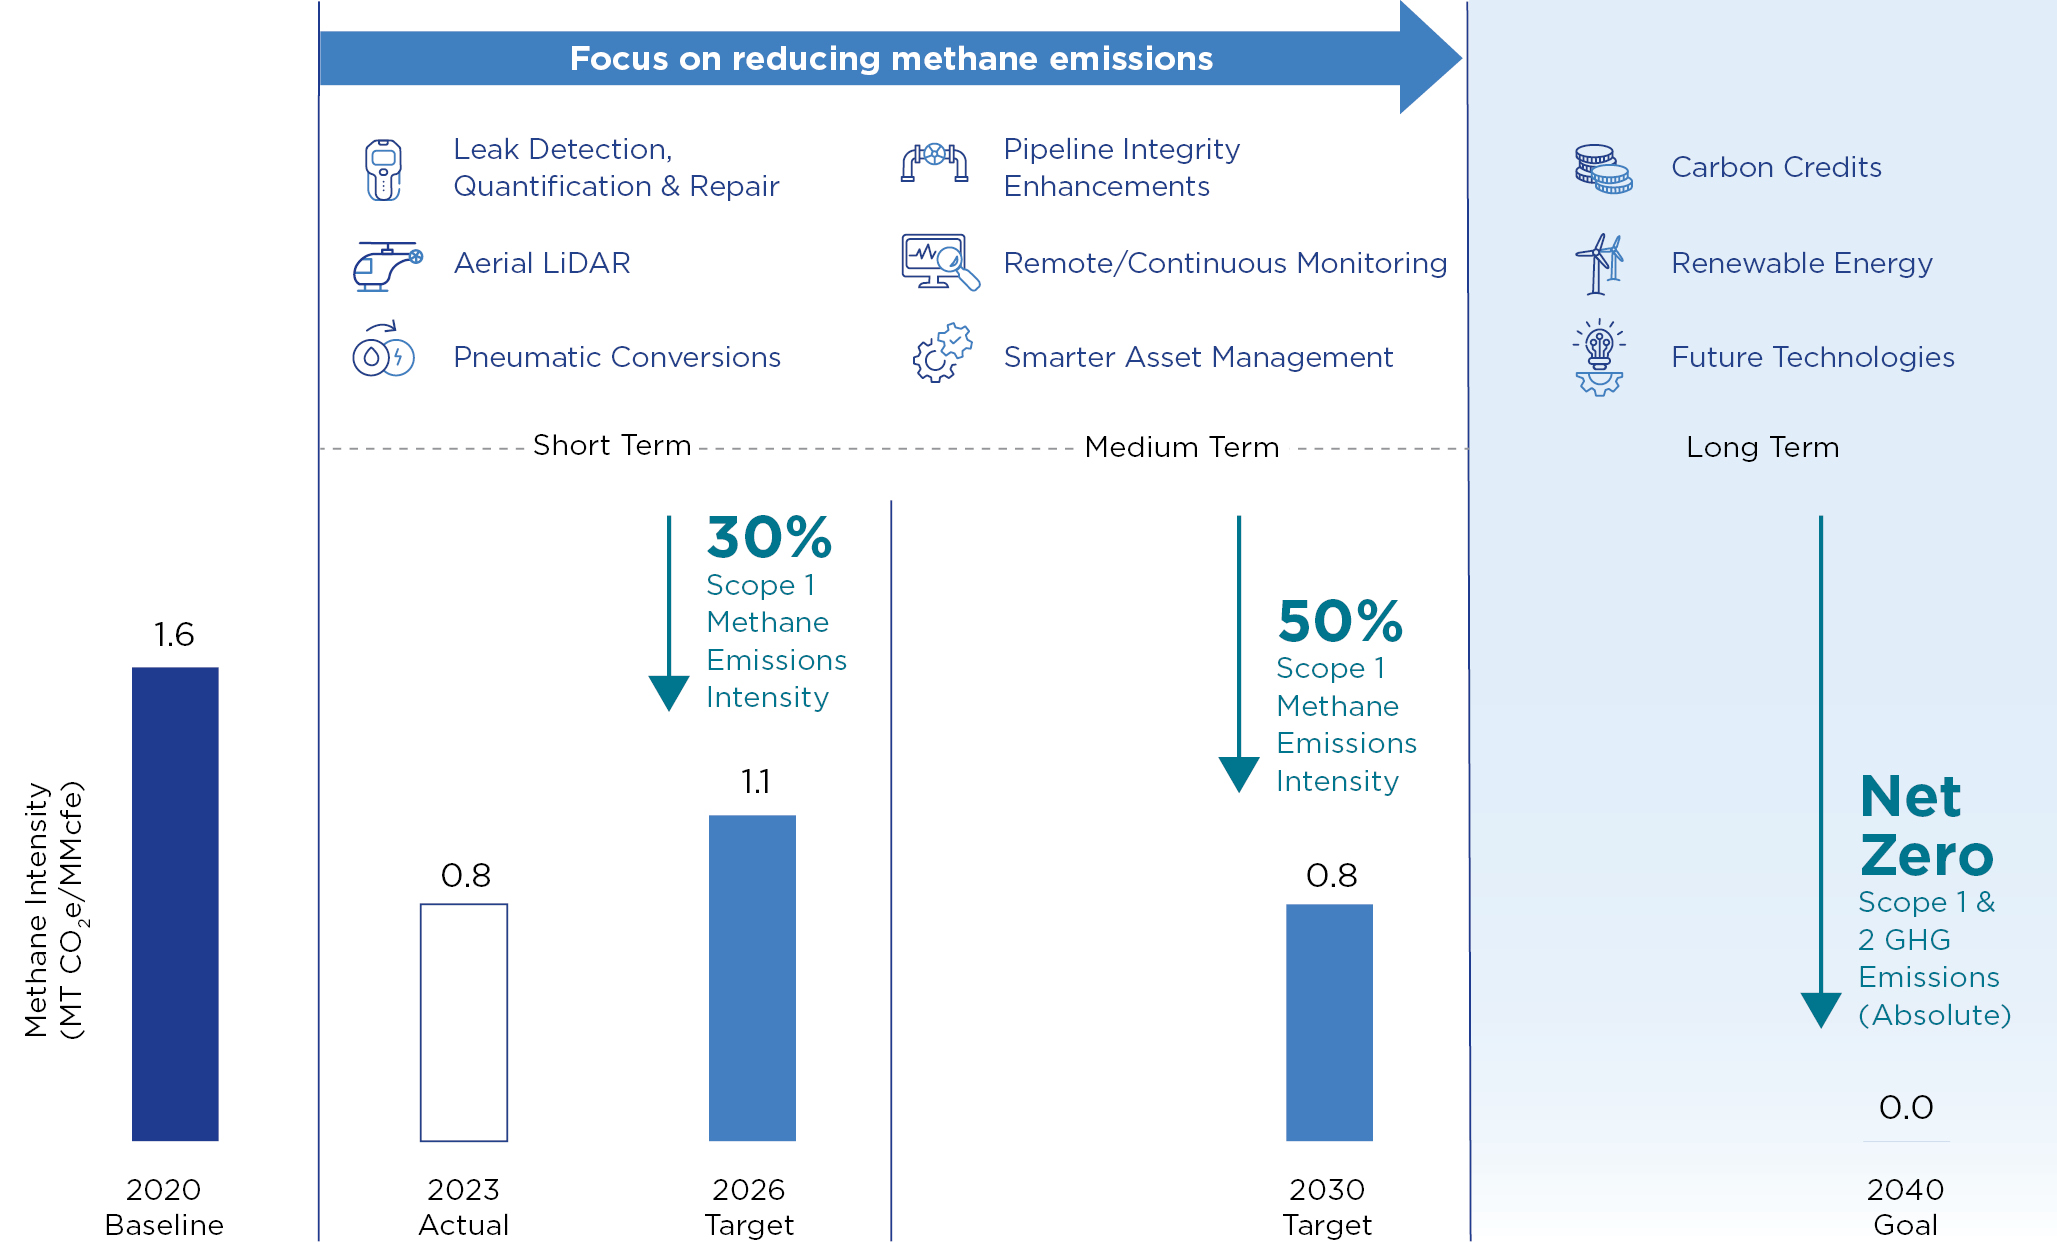
CLIMATE-RELATED RISKS AND OPPORTUNITIES
In line with TCFD guidance, we consider climate-related
risks and opportunities that could have a material financial
impact on our business on a short-, medium- and long-term
basis. For this analysis, our considered timeframes are as
follows: short-term 2024 to 2026, medium-term 2027 to
2030, and long-term 2031 and beyond. The timeframes
align with our methane intensity reduction targets set for
2026 and 2030 while contributing to our net zero GHG
emissions goal in 2040.
The climate-related risks and opportunities presented
below were identified through workshops with executive
management, senior leaders, and third-party advisors as
well as through peer comparisons.
Climate-related risks have been grouped according to the
risk types suggested by the TCFD: Transition Risk
(including Market, Policy & Legal, Technology, and
Reputation) and Physical Risk (chronic and acute), while
climate-related opportunities are categorized as Resource
Efficiency, Energy Source, Products & Services,
and Markets.
The specific climate-related risks and opportunities
identified are set out in the following tables together with
the potential impacts they could have on our business, the
timeframes associated with each, and the progress being
made to mitigate or exploit them.
CLIMATE-RELATED RISKS
Risk |
Potential Impact |
Timeframe(a)
|
Risk Management Actions |
||
S |
M |
L |
|||
MARKET |
|||||
Changing global
market sentiment
as consumers
transition away
from fossil fuels
will result in reduced
natural gas & oil
demand and impact
the price outlook
|
—Negative impact on
revenues and
portfolio value
—Reduced
opportunities
for acquiring
commercially
viable assets
|
•
|
•
|
—We conduct scenario analysis of portfolio impacts
under a range of commodity price and demand
outlooks to assess portfolio resiliency.
—Our portfolio is heavily weighted towards gas, which is
expected to remain more resilient than oil through the
energy transition, particularly in North America.
—Our low-cost production provides considerable
resilience to lower commodity price environments.
—Our robust hedging strategy provides financial
assurance and protection against commodity price
volatility in the short-, medium- and long-term.
—Our compliance with OGMP Gold Standard Pathway
will ensure we remain differentiated as a responsible
gas producer, helping us sustain our competitive
advantage through the decarbonization of our Scope 1
and 2 emissions.
—We are pursuing other differentiated gas initiatives like
TrustWell and other quantification-based efforts to
market our lower gas intensity.
|
|
Increased cost
of and more
challenging or
conditional access
to capital
|
—Investors/lenders
look to decrease
their portfolio
exposure to
hydrocarbon assets
—Capital available to
Diversified
may become
more difficult
to access, more
costly, or come
with additional
climate-specific
obligations
|
•
|
•
|
•
|
—We have committed to achieving Net Zero by 2040
from our Scope 1 and 2 emissions, aligning with
mainstream lenders and investors in Western capital
markets.
—Our existing levels of fixed-rate debt and amortizing
payments provide significant protection in the
short/medium term.
—We continue to pursue ESG-aligned asset-backed
securitization (“ABS”) financing structures, where our
achievement or out-performance of commitments to
ambitious ESG KPIs attached to these ABS financings
can improve borrowing rates and financing capacity.
—Our hedging strategy provides short- to medium-term
certainty and protection for cash flows available
for reinvestment.
—Our strategy of incremental M&A enables adaptation to
changing market or financing conditions.
|
Risk |
Potential Impact |
Timeframe(a)
|
Risk Management Actions |
||
S |
M |
L |
|||
POLICY & LEGAL |
|||||
Cost of carbon |
—Implementation
of some form of
carbon cost or
regulation in states
where we operate
could increase
operating costs
and make our
natural gas less
competitive vs.
other forms
of energy
—Such policies could
also accelerate
pressure from
investors and
stakeholders to
reduce emissions
or improve
energy efficiency,
increasing our
decarbonization
costs
|
•
|
•
|
—Ongoing engagement in proactive, voluntary
measurement of our Scope 1 emissions to ensure we
fully understand potential portfolio liability.
—We continue to engage in efforts to reduce
emissions across our portfolio, such as leak detection
and repair, pneumatics replacements, and
compressor optimization.
—We engage in cost-efficient operations and deploy
SAM initiatives across our upstream and
midstream portfolio.
—We are engaging with third-party consultants to
more fully develop our internal price of carbon
metrics and strategy.
—We include the evaluation of acquisition targets’
carbon footprints in our M&A process and final
investment decisions.
—Our evolving internal MACC analysis aided by field
testing and/or small-scale pilot projects allows us to
optimize the prioritization of identified emissions
reduction projects.
|
|
Well retirement |
—Acceleration of
existing state
well retirement
commitments
could significantly
increase annual
capital and
operating costs
—Underestimation
of well retirement
costs could
significantly
increase asset
retirement
obligation and
future cash outlay
for well retirement
activities
|
•
|
•
|
—We actively engage with regulators regarding well
retirement policies and activities.
—We are committed to retiring wells ahead of state
requirements (2023: 80 wells), including 201
Diversified-operated wells retired in 2023.
—Our low-cost retirement capacity enables us to increase
our own well-retirement targets, participate in state
orphan well programs and carry out asset retirement
for third parties.
—Our extensive experience of well retirement,
particularly in Appalachia, and our expanded
retirement capabilities puts us in the best position to
accurately forecast the future capital requirements for
these activities.
—Revenue streams from third-party asset retirements
help to offset the cost of retiring our own wells. In
addition, Diversified is exploring potential opportunities
in alternative energy uses for wellbores (e.g.
hydrogen production, carbon storage, mechanical
battery storage).
|
|
Risk |
Potential Impact |
Timeframe(a)
|
Risk Management Actions |
||
S |
M |
L |
|||
Litigation |
—Potential litigation
tied specifically
to Diversified’s
climate-related
reporting (e.g. for
misrepresentation)
or actions could
bring additional
legal and
reputational costs
—Potential litigation
around leaks or
other sources of
emissions (now
or historical)
|
•
|
•
|
•
|
—We have focused, near-term efforts to achieve Scope 1
methane intensity reductions with a goal of net zero
Scope 1 and 2 GHG emissions by 2040.
—We expect continued development, funding, and
execution of formal plans and projects will enable the
achievement of emissions targets.
—We continue to transparently report and communicate
climate and emission reduction initiatives, keeping
stakeholders abreast of such actions.
—We actively engage with federal and U.S. state
regulators, and consistently demonstrate our
commitment to meet or exceed their requirements.
—We maintain strong community support in our
operating areas.
—We are transitioning to an emissions intelligence
software, Iconic Air, to track, report, and manage
emissions, which will enable us to increase
transparency, improve the integrity of our emissions
measurements and therefore minimize potential
litigation risk around leaks.
—We work with independent consultants to verify our
GHG accounting.
—We engage an independent, third-party consultant to
provide moderate Level II assurance for Scope 1 & 2
GHG emissions.
|
Current &
emerging climate-
related regulation
and policy
|
—Increasing costs of
doing business as a
fossil fuel-focused
company;
regulatory fines for
emission levels;
regulatory
constraints on
hydrocarbon
commerce
—Mandates on and
regulation of
existing products
and services
|
•
|
•
|
•
|
—We actively monitor U.S. and international climate-
related regulations and frameworks and engage as
applicable, including: IFRS S1 & S2, Transition Plan
Taskforce, SEC Climate Disclosures and TNFD.
—We have multiple emissions reduction activities in
place aimed at reducing methane emissions and
achieving our 2040 net zero goal.
—We actively engage with industry associations to
ensure we are using best practices in operating
procedures and emissions reductions.
—Our experience from the many voluntary efforts
made to date to reduce our methane emissions
positions us to manage any impact arising from the
U.S. EPA OOOOb and OOOOc regulations and U.S.
Inflation Reduction Act’s Methane Emissions
Reduction Program.
|
Risk |
Potential Impact |
Timeframe(a)
|
Risk Management Actions |
||
S |
M |
L |
|||
TECHNOLOGY |
|||||
Cost of GHG
emissions detection
and reduction
technology
|
—Increased costs
of required
technology;
possible cost
upside if more
mitigation than
expected is
required
|
•
|
•
|
—Our emissions detection and reduction plans are
already well-advanced with short- and medium-term
costs factored into budgets.
—We continue to benefit from the successful use of aerial
and handheld leak detection equipment and from
continuous investment in our low-cost SAM program to
repair and eliminate fugitive emissions.
—We continue to invest in leading-edge emissions
reduction technologies and to monitor new technology
developments, including aerial LiDAR, compressor
conversions, handheld emissions detection, and
pneumatic conversions.
—We piloted two emerging emission detection and
quantification technologies in 2023. Both technologies
are expected to substantially reduce the cost of
emissions detection while providing emissions
quantification and a digital twin.
—To date, we’ve experienced lower-than-expected
costs of compressed air applications for pneumatic
controllers. Our internally developed solutions for
pneumatics and level controllers are well below
market prices.
—We continue to demonstrate innovative actions to
reduce emissions, including retrofitting/elimination of
existing emitting equipment (e.g. pneumatic devices
and compressors).
—Throughout 2023, we have continued to build and
maintain our emissions intelligence using Iconic Air
carbon accounting software to track, report and
manage emissions. Using Iconic Air will allow us to
streamline emissions accounting and reporting and
manage our emissions sources at the asset-level.
|
|
Substitution of
natural gas and oil
with lower-carbon
forms of energy
|
—Faster acceleration
and adoption/
substitution of
alternative energy/
lower carbon
solutions (i.e.,
electric vehicles,
more efficient
appliances) drives
lower demand for
natural gas and oil
|
•
|
•
|
—The scenario analysis shows that gas plays an
important role throughout the Energy Transition even
in the Net Zero scenario (accounting for 22% of global
energy demand in 2040).
—Our scenario analysis shows that even under low-
carbon scenarios our portfolio is relatively resilient. Due
to our low cost of production, we are able to maintain
profitable operations across our portfolio even under
low commodity price environments (see Portfolio
Resilience section).
|
|
Risk |
Potential Impact |
Timeframe(a)
|
Risk Management Actions |
||
S |
M |
L |
|||
REPUTATIONAL |
|||||
Overall perception
of fossil fuels/
energy sector
|
—Increased
stakeholder
pressure to
accelerate
emissions reduction
projects could
increase short-term
costs and challenge
profit margins
—Changes in
stakeholder/society
expectations of
Diversified’s role in
the energy
transition could
impact company
valuation or brand
—Increasing
challenge to attract
and/or retain talent
|
•
|
•
|
•
|
—We are committed to transparency in emissions and
climate risk reporting, and to our plan of achieving our
climate-related targets.
—We engage regularly with shareholders, regulators and
other key stakeholders to ensure understanding of our
climate strategy.
—We include climate metrics in short- and long-term
remuneration policies to incentivize ongoing
improvement in climate actions.
—We are continuing to explore longer-term opportunities
in new revenue-generating low-carbon energy projects,
for example through waste heat recovery.
—Broad leadership engagement through multiple
communication channels keeps our current employees
abreast of business strategy and emissions reduction
actions and results.
—Our community engagement initiatives and talent
acquisition programs, including scholarship and
internship programs, facilitate broader awareness of
the Company and its climate-related actions among
potential employee candidates.
—Our community tree planting programs, such as
Diversified’s 10,000 tree replanting effort with West
Virginia State University in 2023, support communities,
provide carbon sequestration, and increase the
company’s visibility and engagement with our
future talent.
|
PHYSICAL |
|||||
Acute – Changing
weather patterns,
including increased
frequency and
severity of extreme
weather events
such as extreme
rainfall and
hurricanes
|
—Increased risk
of compromised
infrastructure
or forced
abandonment of
operations could
cause loss of
revenue and
decrease
portfolio value
|
•
|
•
|
•
|
—We have robust business continuity and crisis
management plans in place, which were tested during
the central Appalachia floods of 2022 and resulted in
minimal business disruption.
—We use 24-hour monitoring centers, enabling a more
rapid response to weather-related disruptions.
|
Chronic –
Persistent or
constantly
recurring weather
patterns, including
water stress and
heat stress
|
—Increasingly
challenging
and potentially
dangerous
environmental and
climate conditions
could increase
operating costs
and risks
|
•
|
•
|
—Our business model inherently requires minimal water
consumption in our operations.
—We maintain appropriate levels of insurance to
mitigate losses.
—The geographic spread of our asset portfolio mitigates
any large-scale disruption to production from individual
weather events e.g., flooding.
—Further details on our exposure to physical risks and
our qualitative assessment of our portfolio’s
vulnerability to identified hazards are described in a
separate section below.
|
|
(a)Timeframes are defined as S - short (2024 to 2026), M - medium (2027 to 2030), and L - long (2031 and beyond).
CLIMATE-RELATED OPPORTUNITIES
Timeframe(a)
|
|||||
Opportunity |
Potential Impact |
S |
M |
L |
Steps and Progress |
RESOURCE EFFICIENCY |
|||||
Emissions
monitoring and
replacement of
inefficient
equipment
|
—Early detection
of methane leaks
reduces the loss
of sales gas and
associated
revenues across
the portfolio
|
•
|
•
|
•
|
—To reduce our GHG footprint, we continue to invest in
remote leak detection, aerial surveillance, replacement
of pneumatic devices, and inefficient compressors.
—We actively track advances in emissions monitoring
technologies and plan to take advantage of any
suitable applications and technology cost reductions
that evolve.
—We continue to work on emissions intelligence
digitalization and automation plans, supporting the
connection of reported emissions data in the Iconic
Air software to our MACC tool, to enhance the
process of evaluating a broad scope of emissions
reduction projects.
|
Lowering vehicle-
derived carbon
emissions through
optimization and
more efficient
vehicles; waste
management
recycling
|
—Fuel and operating
cost savings by
using vehicles that
are more efficient
and have lower
carbon emissions
|
•
|
•
|
—We utilize lighter weight, more fuel-efficient vehicles in
our fleet replacement program, which could further
expand in the future to include the use of longer-range
electric vehicles.
—We are exploring new technologies to allow remote
operations at well sites thus reducing vehicle use and
associated emissions.
—We utilize optimized route mapping to create the
most efficient well tender routes thereby reducing
vehicle run time, maintenance, fuel consumption and
vehicle emissions.
—We work internally to identify opportunities to reduce
our carbon footprint within our office environment, for
example paper consumption and waste recycling.
|
|
ENERGY SOURCE |
|||||
Increase use of
renewable energy
sources
|
—Replace natural gas
with renewable
energy sources to
support operational
power needs
|
•
|
•
|
—Diversified uses solar equipment and small wind
turbines to provide auxiliary power at certain smaller or
remote well sites and has been increasing the use of
solar equipment in its pneumatic conversion projects.
—38% of our sources for Scope 2 electrical usage in 2023
were zero carbon (including nuclear and renewables).
An additional 33% results from lower-carbon energy
sources (including natural gas) versus coal or
petroleum products.
—We are exploring new technologies to expand the use
of renewable and alternative energy in operations,
including waste heat recovery and solid oxide fuel cells.
Additionally, we are exploring the use of wellbores for
mechanical battery energy storage to aid in the energy
transition by providing off-peak energy storage.
|
|
Timeframe(a)
|
|||||
Opportunity |
Potential Impact |
S |
M |
L |
Steps and Progress |
PRODUCTS & SERVICES |
|||||
Asset retirement
capabilities for third
parties
|
—Providing
third-party asset
retirement services
as an additional
revenue stream and
advancing states’
resolution of
orphan wells
—Support regional
well retirement
compliance
—Continue to build
internal asset
retirement
capabilities
|
•
|
•
|
•
|
—Our expanded well retirement capability supports
our regional leadership position in responsible
asset retirement.
—We see an opportunity to grow our retirement capacity
further via our subsidiary Next LVL Energy, positioning
Diversified to further support states’ efforts to eliminate
orphan wells.
—Potential for expanded services including the
generation of voluntary and regulated carbon credits
related to well retirement of orphan wells held by state
governments.
—Expanded plugging commitments increase return of
well pads to original, natural conditions thus supporting
natural reforestation and biodiversity initiatives in
those areas.
|
Fuel cells and
hydrogen
applications
|
—Explore potential
long-term revenue
opportunities in
blue hydrogen and/
or emissions
reductions using
fuel cells
|
•
|
•
|
—We continue to explore new opportunities in low-
carbon technologies.
—We are currently in the early stages of pursuing
partnerships to evaluate potential of using
existing midstream infrastructure for future
hydrogen applications.
|
|
Carbon capture
utilization and
storage (CCUS)
|
—Explore the
potential to provide
carbon storage
services to
neighboring
emitters
—Potential to offset
our Scope 1 & 2
emissions
|
•
|
•
|
—We are working with external partners to explore the
potential of using our gas storage capacity for CCUS.
|
|
Solar |
—Opportunities
to lease land
surface rights to
third parties
|
•
|
•
|
•
|
—We are evaluating opportunities to expand surface
rights leases to third parties for their development of
solar power farms.
|
MARKETS |
|||||
OGMP Gold
Standard
Recognition
|
—Recognition of our
commitment to
deliver responsibly
produced gas to
the market
—Enables further
differentiation of
our produced
natural gas versus
competitors
|
•
|
•
|
•
|
—Achieving Gold Standard Pathway in both 2022 and
2023 positions us to offer responsibly produced gas in
the marketplace to differentiate it from other natural
gas production.
—As a member of OGMP, Diversified is committed to
disclosing actual methane emissions data aligned with
the OGMP 2.0 framework, thus further increasing our
level of transparency for the market’s consideration
when seeking differentiated gas.
|
(a)Timeframes are defined as S - short (2024 to 2026), M - medium (2027 to 2030), and L - long (2031 and beyond).
EMBRACING ENERGY TRANSITION
TECHNOLOGIES MITIGATES RISKS AND
OPENS OPPORTUNITIES
MARGINAL ABATEMENT COST CURVE
(“MACC”) ANALYSIS
MACC is a tool that allows for the visualization of a portfolio
of projects that, when taken as a whole, provide
complementary choices for the most efficient reduction of
GHG emissions. Both the GHG emission reduction potential
and the associated abatement cost for each project are
identified within the MACC.
Anticipated emission reductions are estimated based on
source-specific emissions calculations or through direct
measurement. Total costs include direct costs for project
implementation and the value generated from the project,
including decreased product loss or reduced operating
costs. When estimated emission reduction costs and
benefits are combined in the MACC, emissions reduction
project ranking based on economic feasibility and potential
impact is realized.
We are utilizing our MACC analysis as a warehouse of
potential technologies identified through extensive research
and collaboration within the industry, where each
technology is at various stages of evaluation and
applicability. Of the first emphasis for us in the MACC was
natural gas-driven pneumatics, where we have now
identified multiple technologies and solutions that are
effective and promising for the elimination of methane
emissions from pneumatic controllers and pumps.
Before our use of the MACC, we began our pneumatic
controller emission reduction efforts two years ago,
targeting the highest emitting pads first. Now, with the
MACC’s capability to provide a conversion cost break point
of dollars per MT CO2e for a growing database of
alternative technologies, we can make more informed
decisions as to optimal locations and technologies for our
future conversion plans. Thus, going forward we currently
plan to employ customized solutions on a site-by-site basis
as informed by our MACC.
MACC CONSIDERATIONS IN EMISSIONS ABATEMENT (illustrative)
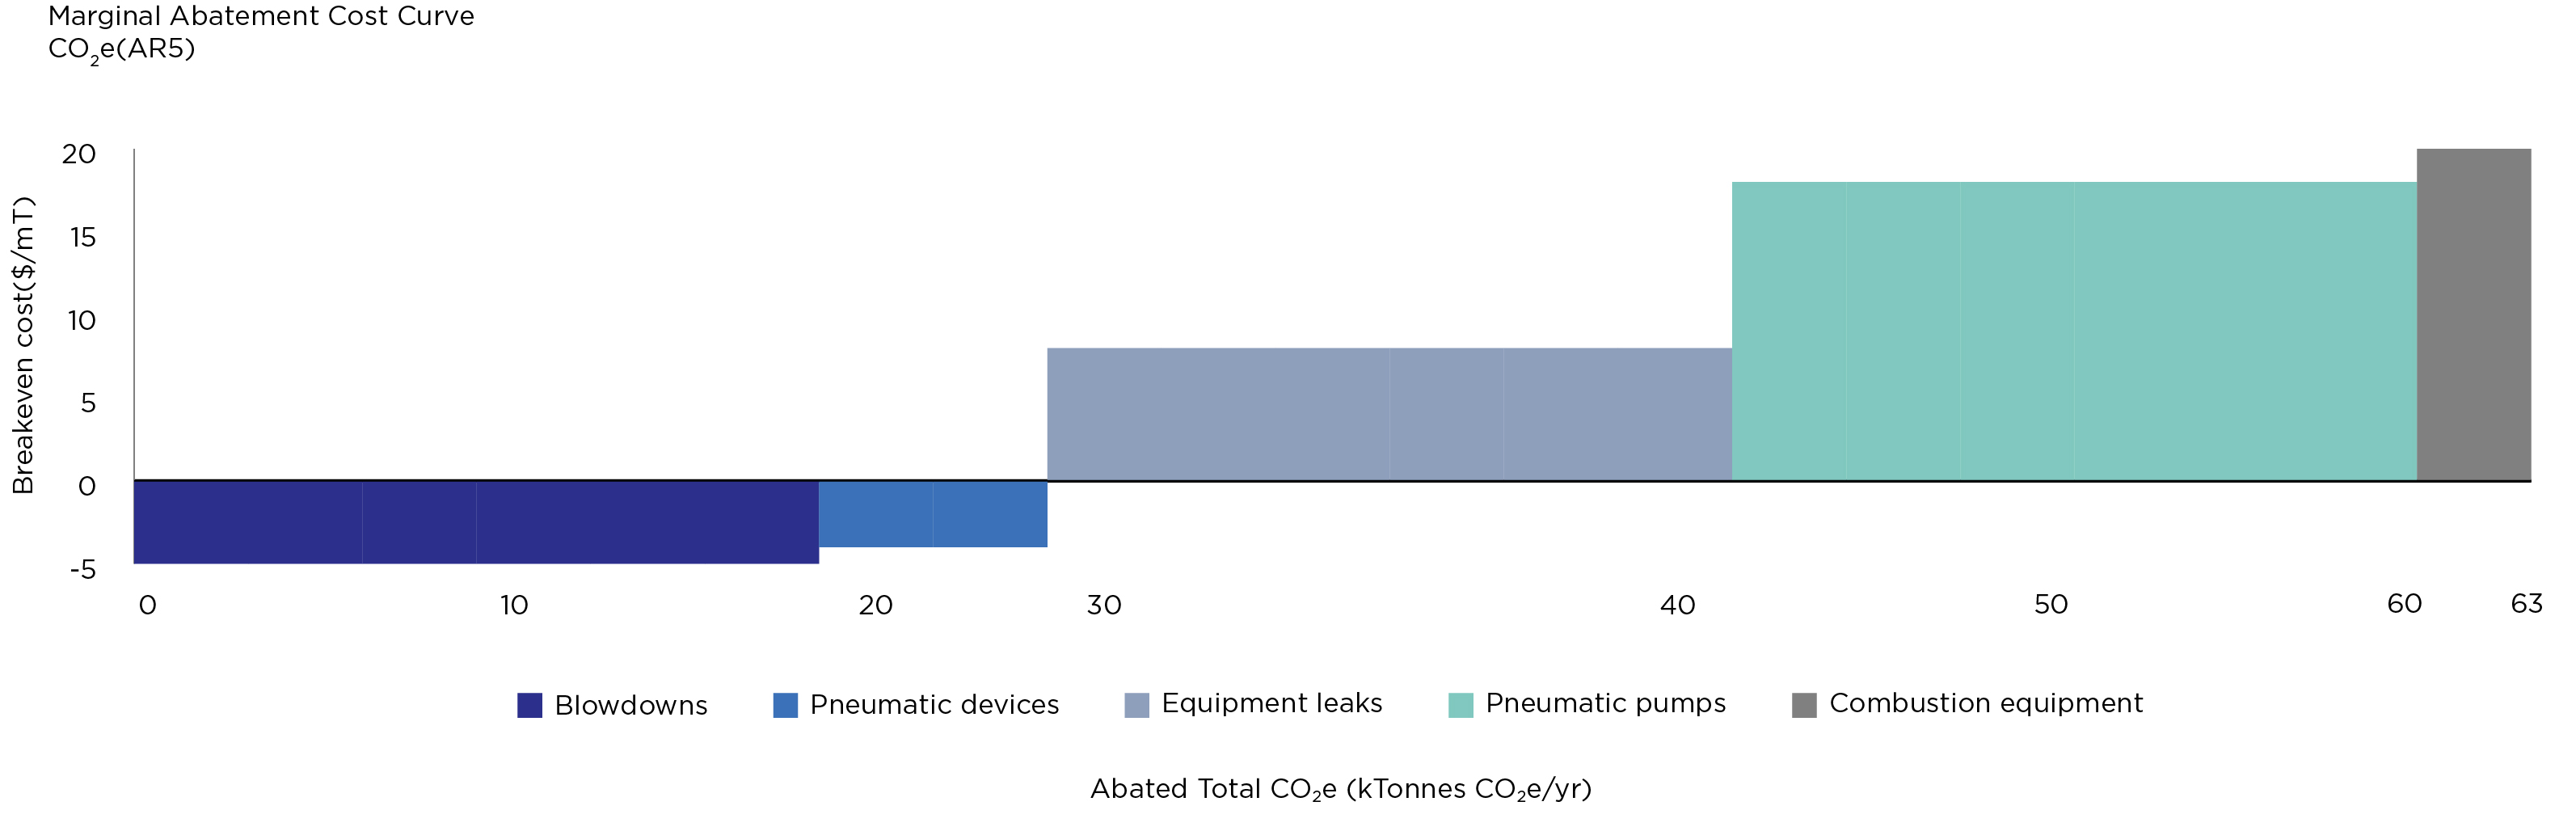
Diversified has achieved the OGMP 2.0 Gold Standard
Pathway for the second consecutive year. The OGMP 2.0 is
the only comprehensive measurement-based reporting
framework created to report methane emissions accurately
and transparently for the oil and gas industry. This award
recognizes our commitment to developing aggressive and
attainable multi-year plans to measure and reduce methane
emissions. Our team worked diligently to fulfil the
requirement throughout the year and continues to do so.
For our operated assets, Diversified has now achieved Level
4 on all but two of OGMP’s 10 categories, with only
methane slip and leak quantification data remaining to
address. As we look to close out these remaining two
categories for Level 4, we also continue to advance our
efforts to achieve Level 5 on all categories as per OGMP 2.0
Gold Standard expectations.
PHYSICAL RISK
We recognize that the physical risks of climate events can
impact our business. These risks have been incorporated
into our risk assessment through our Viability and Going
Concern assessment where we consider the impacts that
certain climate events may have on our production.
Physical climate risks are functions of hazard, exposure and
vulnerability and are therefore complex and frequently
multidimensional. They are related to tangible, physical
impacts of changes in climate and are considered either
acute or chronic. Acute physical risks are event-driven,
including weather events such as extreme rainfall, flooding,
droughts, or wildfires, whereas chronic risks refer to longer-
term shifts in climate patterns, such as rising temperatures
or rising sea levels.
HAZARD IDENTIFICATION
To identify key physical risks to our portfolio, we leveraged,
in part, data published by the American Communities
Project (“ACP”) which included physical risk projections
through 2040. The ACP climate risk analysis was
underpinned by data from Four Twenty Seven, an affiliate
of Moody’s specializing in physical climate risk. Pinkus, A.
(2021) “Mapping Climate Risks by County and Community”,
American Communities Project (accessed January 30,
2024). The 2040 data refers to IPCC’s RCP 8.5 scenario,
which assumes GHG emissions continue to grow
unmitigated, leading to a ‘hothouse world’ with an
estimated global average temperature rise of 4.3°C by
2100. This scenario implies no concerted effort is taken by
society to cut GHG emissions. In contrast, the International
Energy Administration’s (“IEA’s”) most conservative
scenario, STEPS, assumes the implementation of existing
policies, leading to a 2.5°C rise in temperatures by 2100.
Therefore, the scenario used in our assessment of the
impact of physical climate risks on our portfolio is more
extreme than any of the three scenarios used to test the
resilience of our portfolio against the climate-related
transition risks.
We focused on four key hazards that could impact Diversified’s portfolio: acute risks of extreme rainfall, hurricanes, chronic
risks of water stress, and heat stress. We carried out a qualitative assessment of our portfolio exposure to these hazards. The
impact of rising sea levels as addressed in the ACP report has not been analyzed, since we currently have no coastal or
offshore exposure.
IDENTIFIED HAZARDS IN THE STATES IN WHICH WE OPERATE*
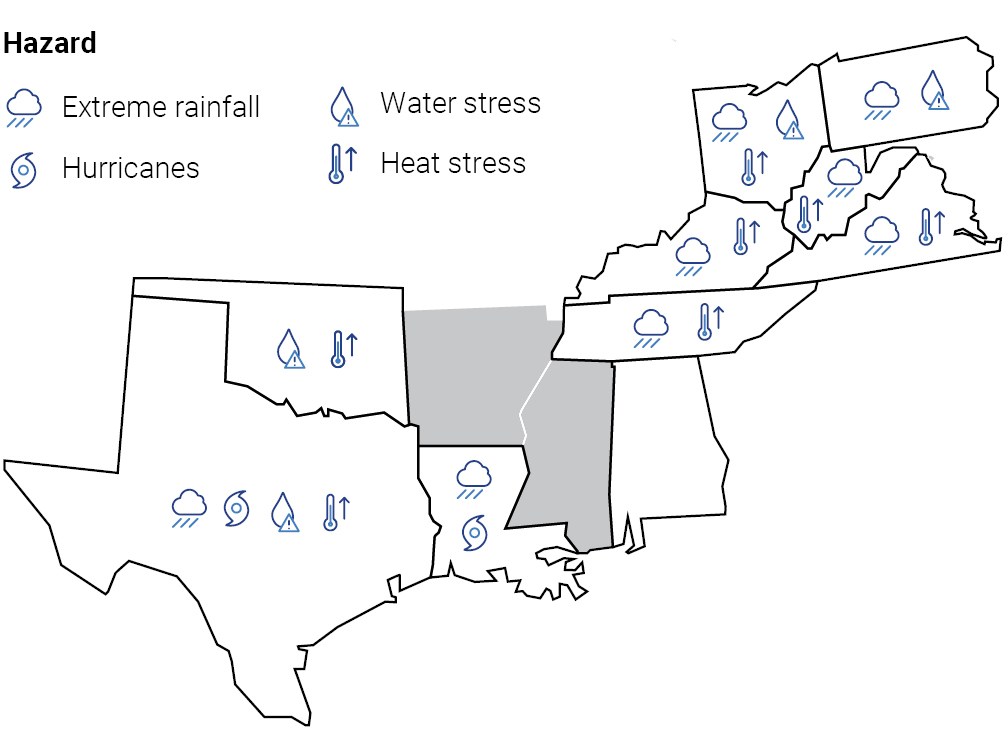
*Includes high and extreme (red flag) risks only as per ACP data
Source: ACP, Diversified Energy
EXPOSURE ANALYSIS
Our upstream and midstream assets are considered
exposed if they are located in an area where a climate
hazard may occur. The degree of exposure is defined by the
intensity of that particular hazard, with the range of
exposure including no risk, low, medium, high, and extreme
risk (which corresponds to ACP’s ‘red flag’).
While our portfolio is located entirely U.S. onshore, our
exposure to suffering a significant financial loss from a
single extreme weather event is minimized due to the
dispersion of our production footprint over a large
geographical area covering nine states – Pennsylvania,
Ohio, West Virginia, Virginia, Kentucky, Tennessee,
Louisiana, Texas, and Oklahoma, with our headquarters
in Alabama.
We compared the locations of our current assets at the
county level to the same counties within the ACP analysis.
This enabled us to quickly assess the exposure of our
assets, and therefore production, to the projected 2040 risk
profile of those counties, as reflected below. We also
identified potential physical impacts associated with each
of the identified risks.
OUR PROJECTED GEOGRAPHICAL EXPOSURE TO KEY PHYSICAL RISKS OF CLIMATE CHANGE IN 2040
Acute |
Extreme Rainfall |
Hurricanes |
||
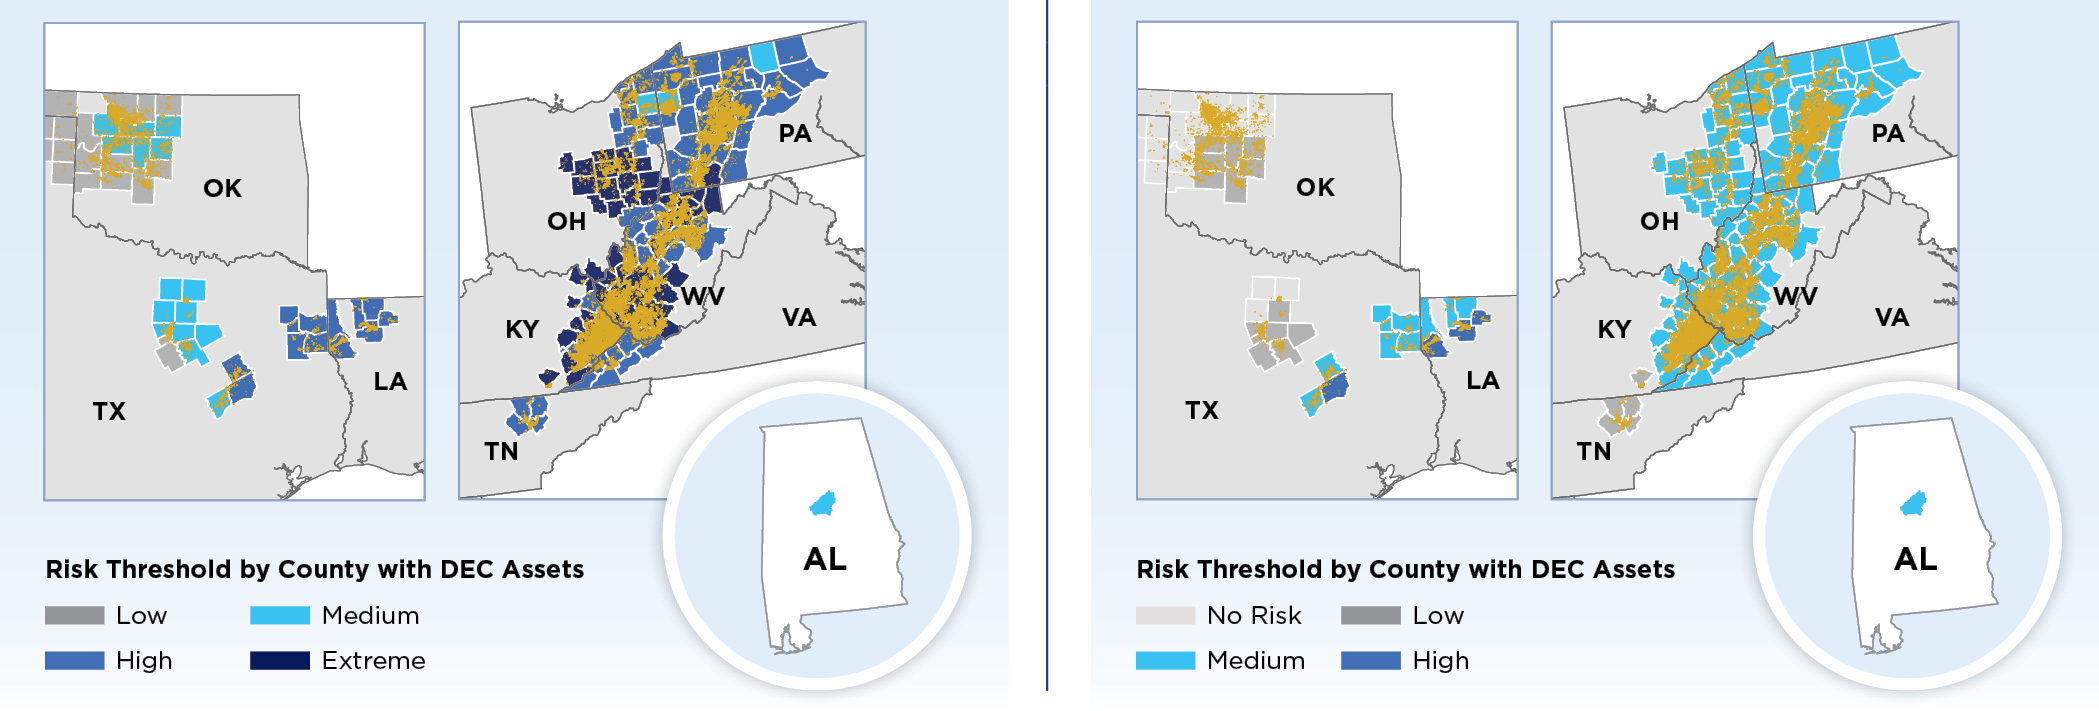
Potential impacts: |
Potential impacts: |
||
—Disruptions of operations
due to flooding
—Infrastructure damage
|
—Supply chain disruption
—Increased operating costs
—Impact on revenue
|
—Infrastructure damage due to
extreme winds
—Operational disruption from
hurricanes
|
—Inland flooding
—Increased operating
costs
—Impact on revenue
|
Chronic |
Water Stress |
Heat Stress |
||
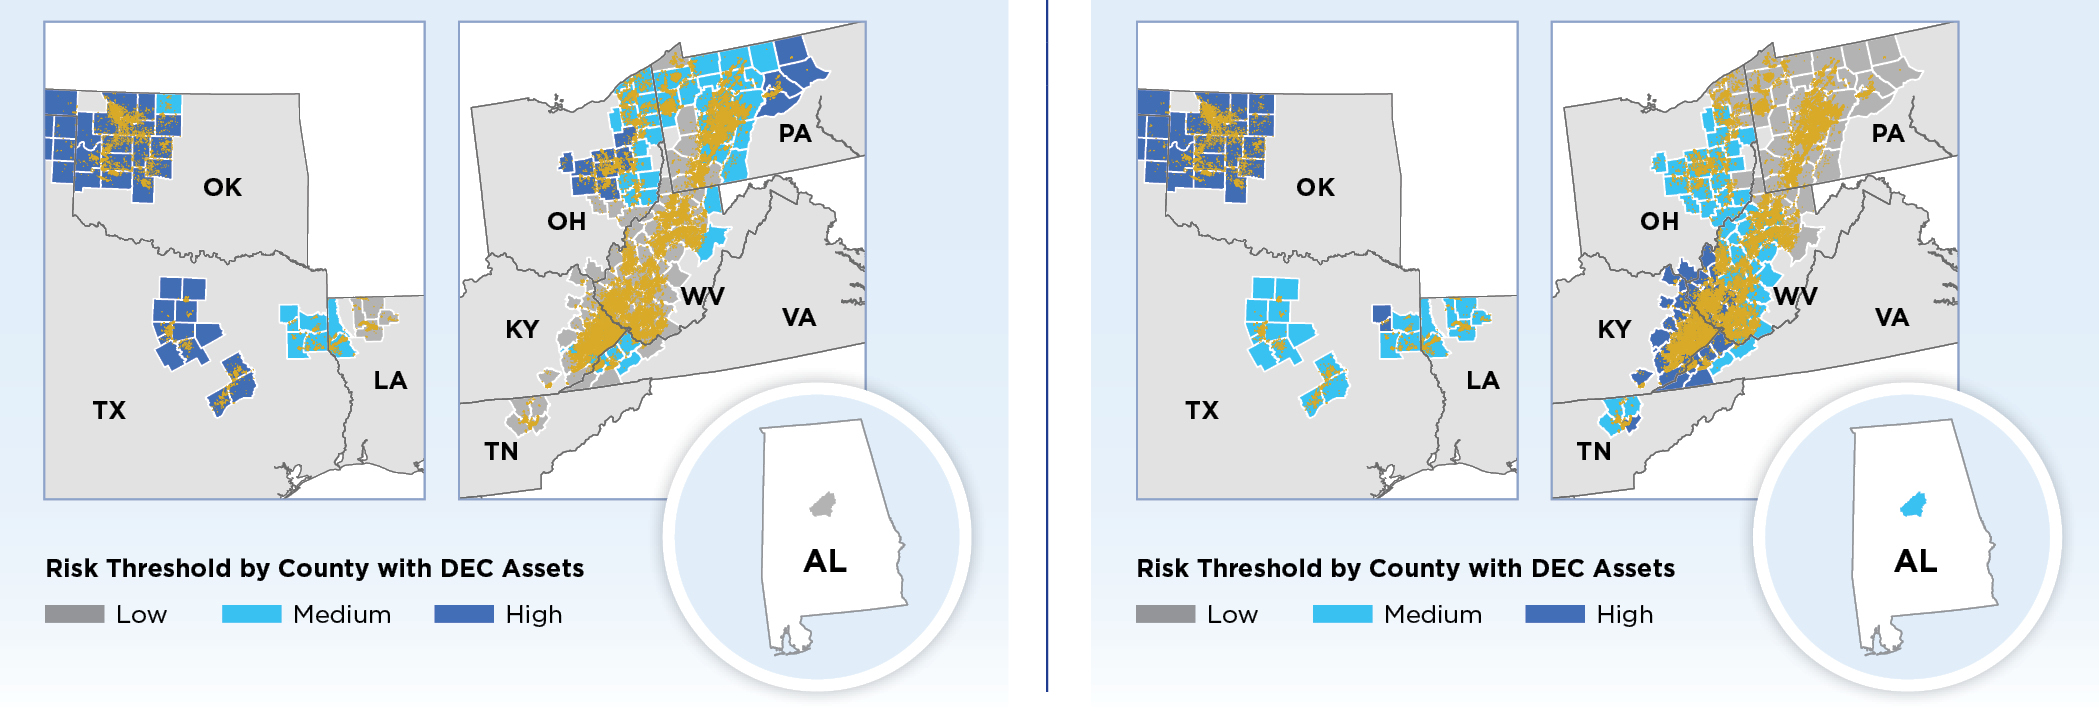
Potential impacts: |
Potential impacts: |
||
—Reduced community
access to water
—Infrastructure cost of fresh
water supply
|
—Impact on supply chain
—Increased operating costs
—Impact on revenue
|
—Increased heat exposure is a health
and safety risk for people
—Decrease in work productivity
—Infrastructure failure due to excess
heat exceeding the design criteria
(gas leaks)
|
—Additional energy
needed for cooling
—Increased operating
costs
—Impact on revenue
|
Source: ACP, Diversified Energy
Using the ACP’s county-based hothouse world scenario,
and when considering each of these four risks, we believe
that our current portfolio is most exposed to extreme
rainfall. That is, we estimate that approximately 84% of our
projected production could be exposed to extreme rainfall
in 2040, as shown in the following table. It is important to
note that ACP’s analysis is at the county level, whereas our
assets may be located in a specific portion of the county
which may bear a different risk level than that of the overall
county. Thus, we believe our exposure will be mitigated by
the specific location of our wells within the counties that
are exposed to extreme rainfall risk, for example. Further,
we estimate that less than 3% of our existing production is
located in a designated flood plain.
OUR PRODUCTION EXPOSURE TO KEY PHYSICAL RISKS
Physical Risk |
% of Diversified’s
Projected 2040
Production in
High or Extreme
Risk Areas
|
|
Acute Risk |
Extreme Rainfall |
84% |
Hurricanes |
4% |
|
Chronic Risk |
Water Stress |
22% |
Heat Stress |
41% |
|
VULNERABILITY ASSESSMENT
Our qualitative assessment of vulnerability addresses the
sensitivity of our operations to the respective hazard,
including actions taken to reduce or adapt to the hazard.
Acute Physical Risks
Extreme rainfall and associated risk of flooding represent
the highest risk to our assets in the Appalachian Basin in
2040, especially in Kentucky, Ohio, and West Virginia,
where our exposure to this risk is characterized as extreme.
Indeed, in July 2022, several central Appalachia states
within our footprint, including primarily Kentucky but also
Virginia and West Virginia to a lesser extent, experienced
devastating floods resulting in loss of life and extensive
damage to housing and public infrastructure within the
states. While the flooding also temporarily impacted our
operations, including compressor facilities, communications,
and pipelines, we were able to efficiently restore the
affected facilities to operations within approximately 10
days. This flooding event did not require the full
implementation of our formal Crisis Management and
Business Continuity plans, yet our teams were able to
professionally respond as a result of our preparation for
such events.
Hurricanes represent a moderate risk to our portfolio, with
only limited increased exposure in Texas and Louisiana,
where this risk is characterized as medium-to-high and is
largely a function of the states’ location on the U.S. Gulf
Coast where Atlantic Basin hurricanes have historically, in
part, impacted the coastline. In the last three years, since
we acquired our first Central Region assets in 2021, the
Texas and Louisiana coastlines have directly experienced
two out of a total of 22 recorded hurricanes in the Atlantic
Basin with no impact on our inland operations.
From a mitigation perspective, we aim for prevention rather
than response when it comes to physical impacts to our
business from any emergency, including those which may
be climate-related. This prevention starts with training our
employees to respond to potential emergencies such as
natural disasters, where all emergency response-related
processes exceed the needs of situations that may arise.
We are also prepared to be effective and expeditious in our
response to any emergency as a function of our separate,
formal Crisis Management and Business Continuity plans
which are reviewed at least twice annually by senior
leadership and which help to ensure the resilience of our
critical business functions and the safety of our employees
and other stakeholders in the case of significant business
disruption. The resilience of our systems is supported in
large part by our intentional, 100% cloud-based information
systems strategy which eliminates the physical risk
exposure of this aspect of our business.
Our Central Region acquisitions in 2021 and 2022 also
brought three district Integrated Operations Centers
(“IOCs”) into our portfolio, two in our upstream operations
and one in our midstream operations. These IOCs
complement our existing gas control center in West
Virginia which monitors the majority of our midstream
Appalachia assets. These 24-hour monitoring centers
facilitate streamlining the collection, standardization and
dissemination of timely, decision-useful data for both
normal operations and atypical events such as those
created by physical climate risks. The central management
of data through these remote monitoring centers leverages
our supervisory control and data acquisition (SCADA)
system and therefore affords a more rapid response to
weather-related disruptions.
Further, we consistently maintain appropriate levels of
hazard risk insurance coverage that mitigate potential
material financial losses from extreme weather events, such
as extreme rainfall, tornadoes, hurricanes, etc.
Chronic Physical Risks
Water stress is the most significant chronic physical risk
associated with our portfolio in 2040, particularly for our
assets in Texas and Oklahoma, where this risk is
categorized as high. Nevertheless, our business model is
focused on operating existing assets, rather than the
extensive drilling of new wells which requires significant
amounts of water for completion of the wells. To date, we
have not experienced an instance of water use limitations
or restrictions when fresh water has been needed for our
typical field and well operations or asset retirement
activities. Therefore, we do not anticipate any significant
disruptions to our operations from this risk categorization.
We do recognize, however, that the increased risk of
drought-like conditions can impact local communities and
ecosystems, lead to increased cost of freshwater supply
where we do intake water, and potentially affect our supply
chain. We expect to adapt to these conditions, especially
since we already operate in these areas which are subject
to strict environmental regulations. Our approach to water
management is to minimize freshwater use where possible,
particularly in potential water-scarce areas within our
operating footprint, as described in our Climate Policy and
Environmental, Health & Safety Policy.
In our Sustainability Report, we assess our current exposure
to water stress, as defined by the World Resources
Institute’s Aqueduct Water Risk Atlas. Even though our
current exposure to water stress risk primarily qualifies as
Low Overall Water Risk, we continue to apply a responsible
approach to water use, aimed at limiting freshwater use,
managing our produced water, and recycling and reusing
produced water as and where applicable.
Heat stress is likely to have a moderate-to-high impact on
our portfolio, with the highest exposure in Oklahoma,
Kentucky, West Virginia and Virginia. We consider heat
stress from two perspectives: (1) personnel and (2)
infrastructure. While we recognize that heat stress is a
health and safety risk for personnel and could lead to a
decrease in work productivity, we have programs and
processes currently in place to address this concern daily,
given the number of field personnel working outdoors and
the nature and volume of work that must occur outside as a
result of our asset portfolio. We also hold adequate levels
of insurance coverage for heat stress-related incidents that
may require medical attention. As the risk of heat stress
increases, we are confident that our current health and
safety procedures can be successfully adapted, as
applicable, to mitigate the impact of this chronic risk on
our operations.
Our Smarter Asset Management operations program helps
mitigate the potential impacts of heat stress on our
infrastructure. The program consists of ongoing, consistent
asset inspection and maintenance and remote monitoring.
This information allows for a rapid response to any
infrastructure or equipment failures that may occur due to
excessive heat.
PORTFOLIO RESILIENCE
Following TCFD guidance and to ensure comprehensive
business planning, we evaluate the resilience of our
portfolio under multiple future climate scenarios. Each
scenario includes assumptions about how the energy
transition may evolve, with differing commodity price
and demand outcomes, providing a range of outlooks
against which our portfolio is tested to evaluate and
determine resilience.
SCENARIO ANALYSIS
The three scenarios we selected to test our portfolio
climate resilience are:
(a)IEA’s Stated Policies Scenario (“STEPS”)
(b)IEA’s Announced Pledges Scenario (“APS”)
(c)Wood Mackenzie’s Accelerated Energy Transition 1.5-
degree pathway (“AET-1.5”), a global net zero by
2050 scenario
It should be noted that there are some differences in the
categorization of specific fuels in the Wood Mackenzie
versus the IEA’s scenarios. For example, in the Wood
Mackenzie AET-1.5 scenario, liquid biofuels are included
within oil whereas they are included with bioenergy in the
IEA scenarios.
TOTAL PRIMARY ENERGY SUPPLY AND CO2 EMISSIONS FOR EACH SCENARIO
AET -1.5 |
IEA APS(a)(c)
|
IEA STEPS(b)(c)
|
|||||
Total Primary Energy
Supply (1018 J)
|
CO2 Emissions
(GT)
|
Total Primary Energy
Supply (1018 J)
|
CO2 Emissions
(GT)
|
Total Primary Energy
Supply (1018 J)
|
CO2 Emissions
(GT)
|
||
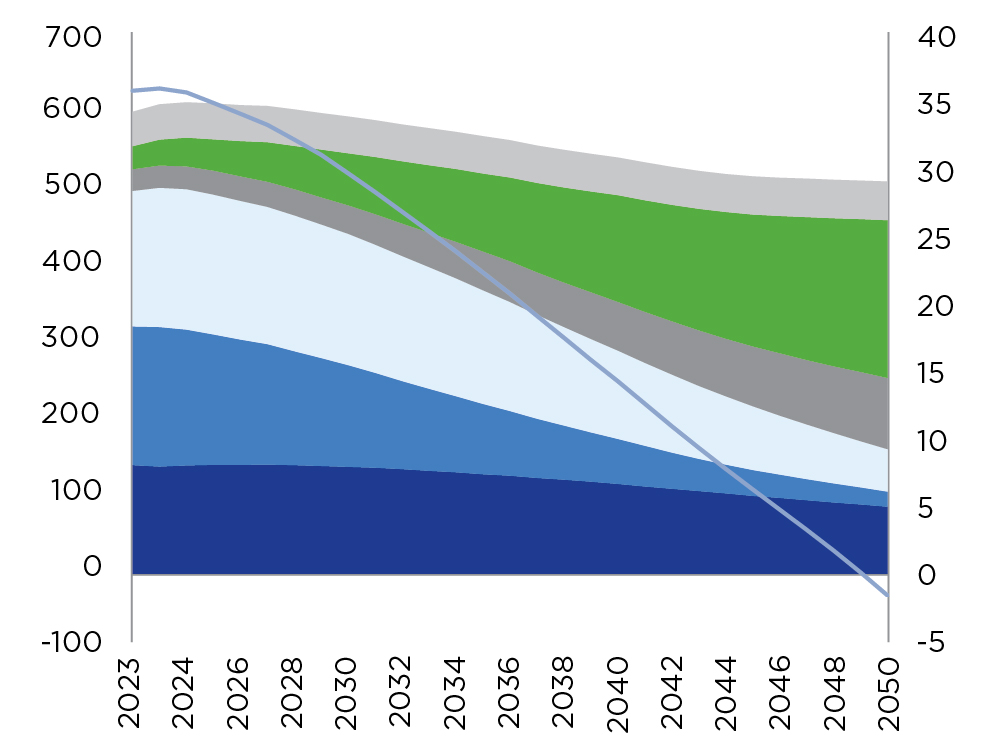 |
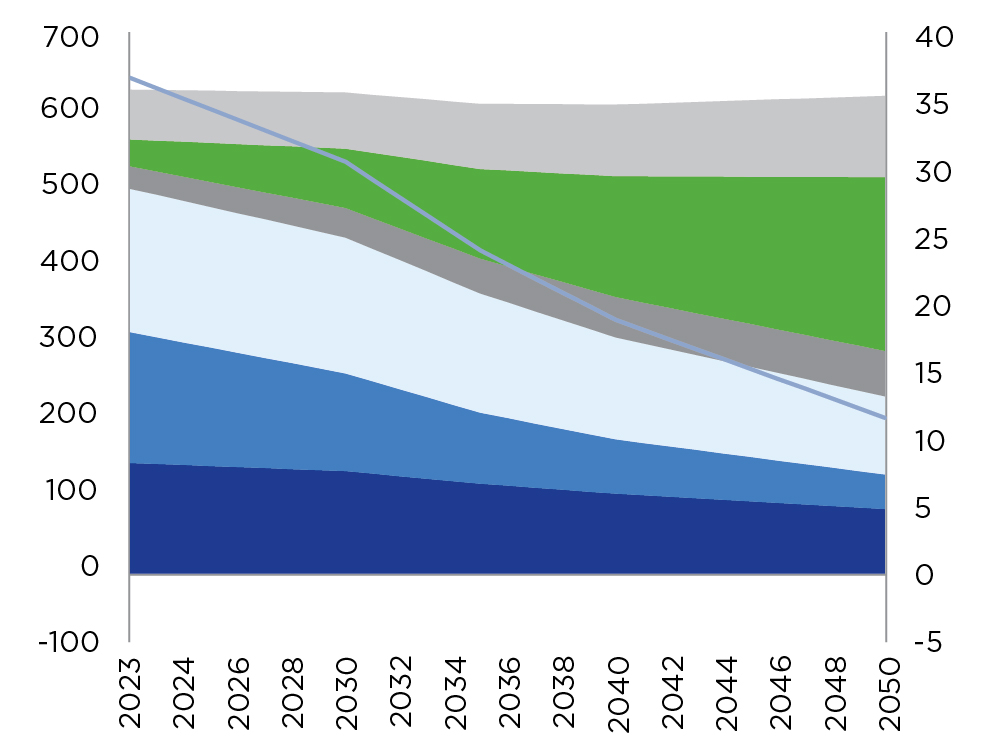 |
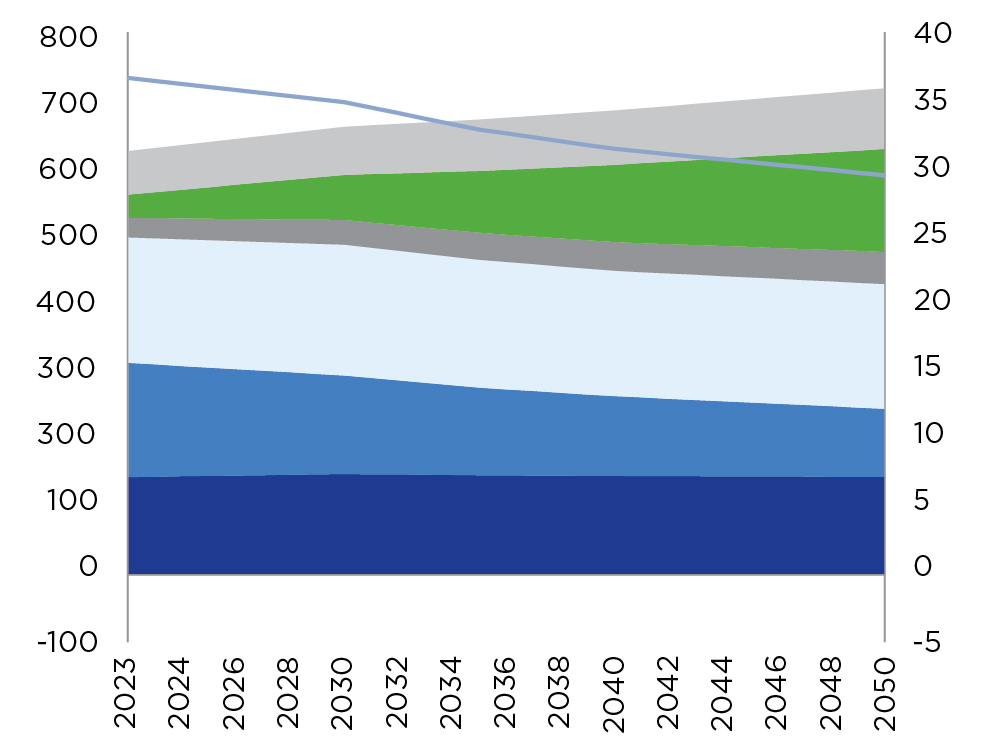 |
|||||

(a)Based on IEA data from the Announced Pledges Scenario of the IEA (2023) World Energy Outlook, www.iea.org/weo
(b)Based on IEA data from the Stated Policies Scenario of the IEA (2023) World Energy Outlook, www.iea.org/
(c)Further detail on the IEA’s pricing methodology for the APS and STEPS scenarios can be found in the 2023 World Energy Outlook.
|
AET -1.5
This scenario represents the most aggressive energy
transition scenario we considered, consistent with limiting
global warming to 1.5°C, in line with the most ambitious
goals of the Paris Agreement. In AET-1.5, global energy
supply peaks in 2024 due to more aggressive policy action
and accelerated global decarbonization efforts, which result
in an increase in electrification and adoption of new-energy
technologies in place of hydrocarbons. Under this scenario,
oil demand peaks in 2024 and then declines, from ~100
million barrels of oil per day (“MMBO/d”) to ~30 MMBO/d in
2050. As a result, near-term oil prices fall rapidly, from
current levels to ~$52 per barrel (“/bbl”) in 2030 and then
continue to decline more gradually reaching ~$30/bbl by
2050. Under this scenario the global economy achieves net
zero carbon emissions by 2050, aligned with the IEA’s own
net zero scenario.
The forecasts for natural gas demand and prices under this
scenario are more nuanced due to the assumed role of
natural gas as a global transition fuel and the relatively
rapid decline of oil prices in the future. This position is
particularly apparent in the U.S. market where the resilience
of gas demand is supported through the development of
carbon capture and storage, which supports low carbon
power generation and heating for industrial process as well
as blue hydrogen and ammonia.
AET-1.5 sees global natural gas demand peaking in 2027
and then falling below 2023 levels by 2030, with a
continued decline forecast thereafter. U.S. natural gas
demand remains particularly robust out to 2040 with near-
term policy (i.e. Inflation Reduction Act) support for the
development of carbon capture and storage along with
sustained LNG exports. While overall global natural gas
demand declines from 2027, the rapid decline in global oil
prices has a dramatic impact on the availability of relatively
low-cost associated U.S. gas. Significant levels of
production from the liquids-rich plays in the U.S. (such as
the Permian) become sub-commercial thus cutting off
some of the country’s lowest-cost supplies. In order to
balance the market, higher cost non-associated gas is
required thus driving up the marginal cost of supply.
While U.S. natural gas demand does decline, this decline is
more than offset by the decline in supply from the liquids-
rich basins and thus the U.S. Henry Hub natural gas price is,
perhaps counter intuitively, forecast to increase
significantly in the period to 2032, from $2.61/million Btu
(“MMBtu”) in 2023 to $4.05/MMBtu by 2032. Thereafter,
prices continue to increase through the 2030s and 2040s,
albeit at a slower pace, reaching $4.80/MMBtu by 2050.
IEA APS
This scenario assumes that governments will meet, in full
and on time, the climate commitments they have made,
including their Nationally Determined Contributions and
longer-term net zero emissions targets. This scenario is not
designed to achieve a particular outcome and does not
result in a net-zero world by 2050.
Under APS, there is a pronounced decline in oil demand
driven by the implementation of policies aimed at reducing
oil consumption. Demand gradually declines from ~102
MMBO/d
in 2023 to ~93 MMBO/d in 2030, before an accelerated
decline to 55 MMBO/d by 2050. In conjunction, oil prices
see a similar decline, stabilizing at around $74/bbl in 2030
before declining to $60/bbl by 2050. Global natural gas
demand declines steadily, dropping about 40% from its
2021 peak by 2050. U.S. natural gas prices increase from
$2.61/MMBtu in 2023, reaching their plateau around $3.00/
MMBtu over the 2030s before declining to below $2.70/
MMBtu from 2040 onwards.
IEA STEPS
This scenario is the least ambitious energy transition
scenario used for our portfolio analysis and is designed to
provide a sense of the prevailing direction of energy system
progression, based on a detailed review of the current
policy landscape.
In this scenario, oil demand will grow in the near-term to
2030 to reach 102 MMBO/d. Demand then declines out to
2050, reaching 97 MMBO/d. Global natural gas supply
mirrors the growth pattern of oil, rising steadily to a gentle
peak level in 2030 that plateaus through 2050. U.S. natural
gas prices decline from $4.96/MMBtu in 2023 to $4.00/
MMBtu in 2030. From 2030, price begins to gradually
increase over the next two decade reaching $4.30/MMBtu
by 2050.
DEC’s BASE CASE PRICE SCENARIO
Diversified’s base case price forecasts, which are used for the calculations of net asset value and free cash flow, are based on
the NYMEX forward curves from 2024-2032 for Henry Hub (“HH”) and 2024-2029 for West Texas Intermediate (“WTI”) as of
December 31, 2023. The prices are kept flat in real terms thereafter.
Oil Comparison 2023 - WTI
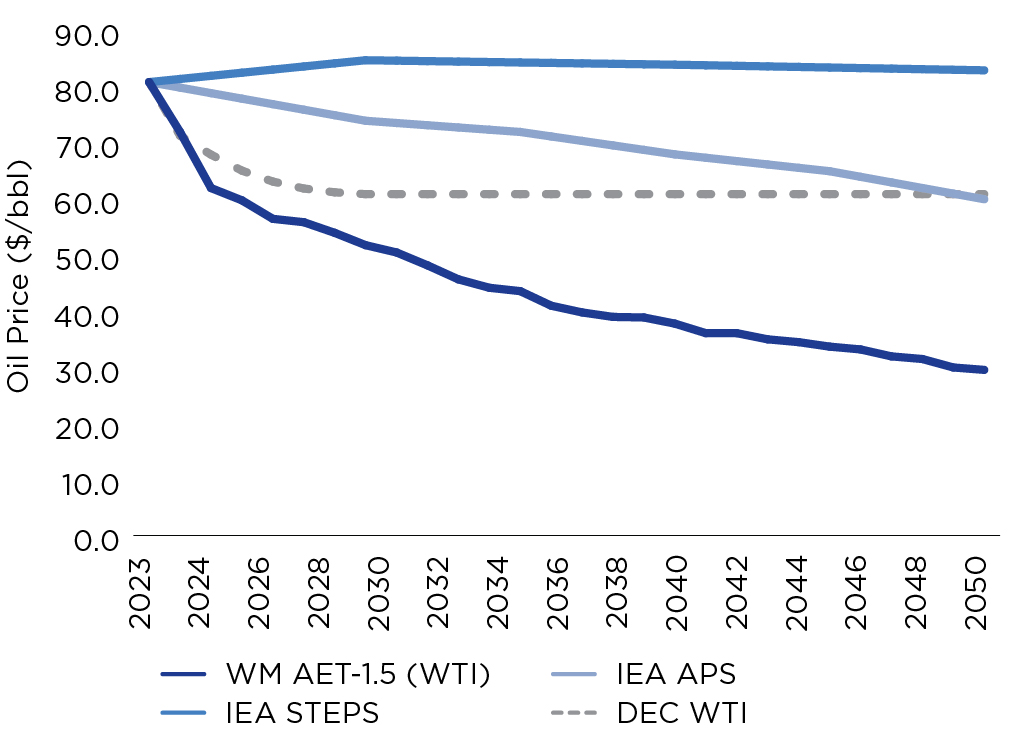
U.S. Gas Price Comparison 2023
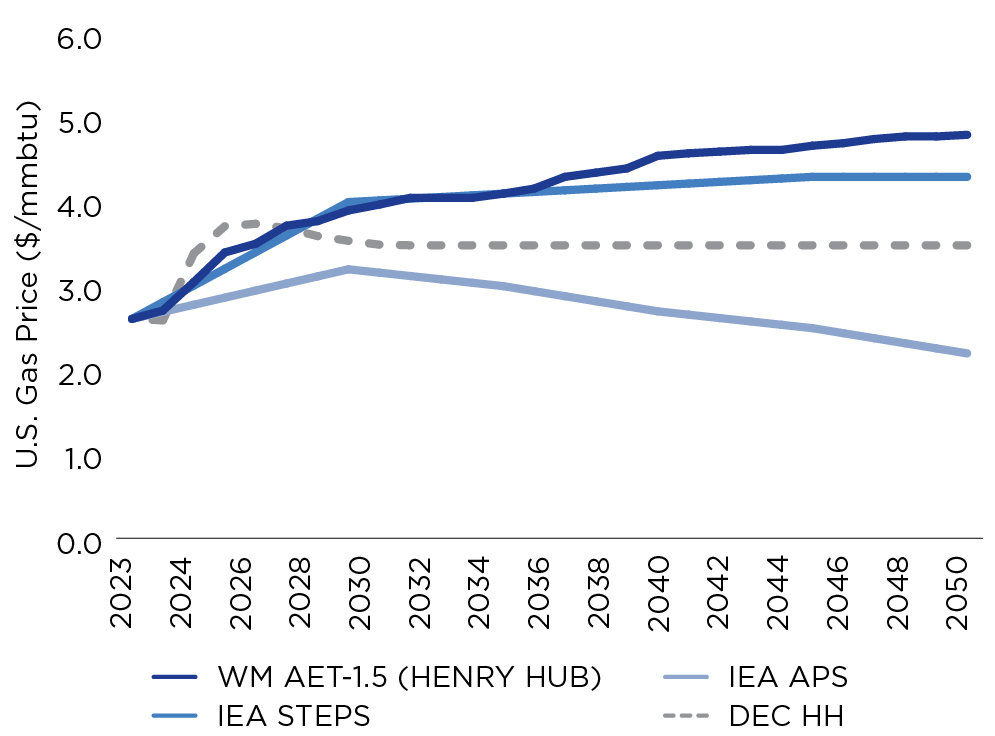
*Diversified Energy’s Henry Hub price is calculated based on 1030 BTU/standard cubic foot
PORTFOLIO IMPACT
We use the published price forecasts for oil and U.S. natural
gas from each scenario to assess the potential impact on
the value of our assets compared to our base case. It is
important to note, however, that this analysis considers
only our current assets. No account is taken of the impact
that future acquisitions or divestitures may have on our
future business value and cashflows.
The following table shows the impact of the three climate
scenarios relative to the base case for our current portfolio,
in terms of net asset value (“NAV”) change in percent
versus base case.
NAV CHANGE % vs. BASE CASE
Scenario |
Portfolio Value Impact (NPV10) |
STEPS |
18%  |
APS |
-24%  |
AET -1.5 |
7% |
Our NAV change is positive under the Wood Mackenzie
AET-1.5 and IEA STEPS scenarios, driven by two
main factors.
Firstly, both scenarios forecast robust U.S. gas prices out to
2050, at $4.30/MMBtu and $4.80/MMBtu for 2050 under
STEPS and AET-1.5, respectively. The results illustrate our
conservative approach to financial planning, with our Henry
Hub price forecast aligned with the AET 1.5 scenario out to
2030 and staying flat at around $3.50/MMBtu post-2030.
The higher positive NAV change under the STEPS scenario
can be attributed to much higher Henry Hub prices out to
2030 than in our Base Case, which when coupled with
Diversified's front-loaded production outlook, significantly
increases the value of assets. Production volumes between
2024 and 2035 account for over 60% of the total
production between from 2024 to 2048. During this
timeframe, natural gas prices are higher in the STEPS
scenario, averaging ~$4.30/MMBtu versus an average of
~$3.70/MMBtu under AET- 1.5.
Secondly, the strong price outlook is bolstered by our low
cost of production. As a result, we are able to maintain
profitable operations across our portfolio through to 2050.
Our analysis indicates that even in the most carbon
constrained scenario (Wood Mackenzie AET-1.5), our
production would remain resilient and profitable in the
short-, medium- and long-term. This conclusion is
supported by the analysis of related free cashflows,
depicted below, where even under the most aggressive
pricing outlook in AET-1.5, our free cashflow
remains positive.
Unless there are significant changes in the regulatory
environment in the near future, we do not expect to see a
significant financial impact of climate-related risks on our
near-term cash flows. Post-2030, our conservative
commodity price assumptions, used for Diversified’s
financial planning and acquisition and divestiture screening,
position us well to cope with the potential introduction of
carbon taxes in the U.S. or falling commodity prices.
CUMULATIVE UNLEVERED FREE CASH FLOWS UNDER
EACH SCENARIO vs BASE CASE
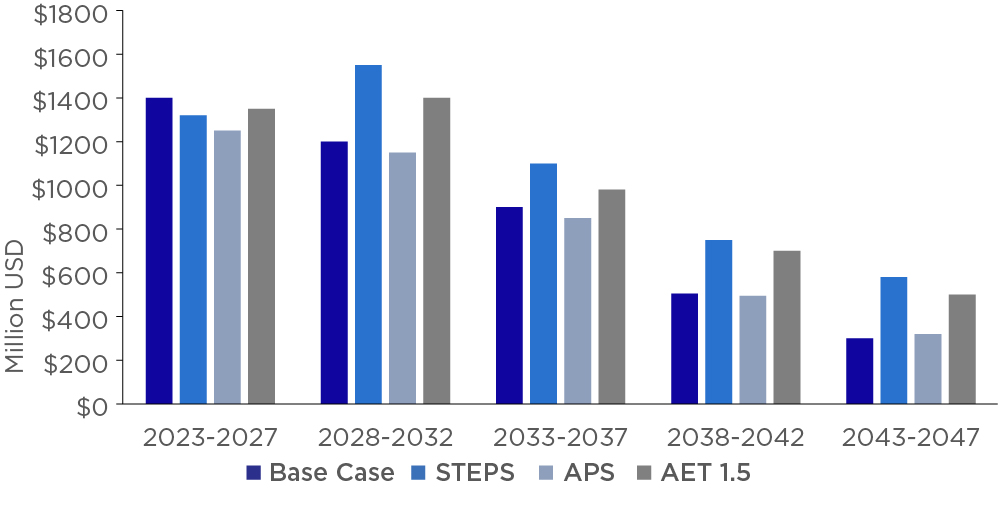
CARBON COSTS AND REDUCTIONS
In addition to the impacts of the three climate scenarios on
commodity prices, the scenarios also incorporate carbon
price outlooks required to achieve the highlighted primary
energy outcomes. While the IEA acknowledges that these
estimates should be interpreted with caution, the CO2
prices provide some context for the level of price that is
required to promote fuel switching and associated
investment decisions. To assess the impact that carbon
pricing may have on our business, we have utilized the
carbon price forecast for the U.S. for the IEA scenarios and
for developed economies in the Wood Mackenzie AET-1.5
scenario. We have evaluated the implications based of
these carbon prices on our net zero goal (Scope 1 and 2).
Under the APS scenario, carbon prices in the U.S. are
forecast to be $135/MT in 2030 and rise to $175/MT by
2040. STEPS does not incorporate a carbon cost in the U.S.
(at a country level) across the forecast period. The AET-1.5
scenario incorporates carbon prices of $96/MT as soon as
2026, thereafter increasing to $136/MT by 2030 and $173/
MT by 2040.
METHANE INTENSITY TARGETS
(MT CO2e/MMcfe)
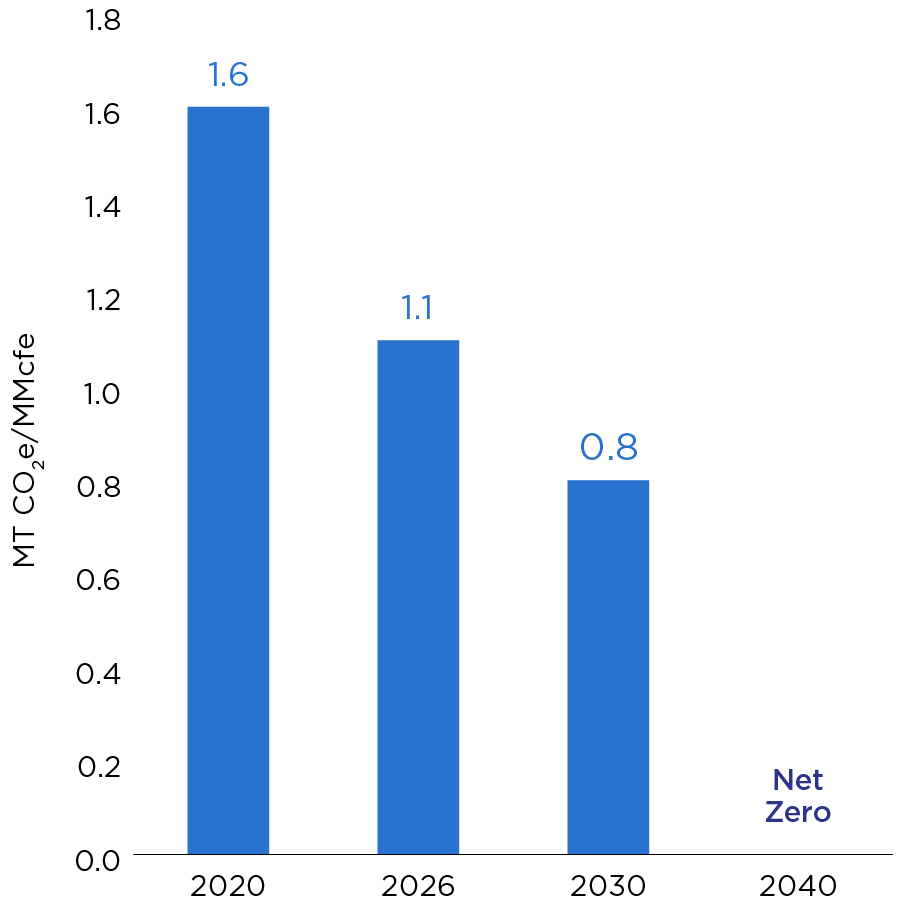
Carbon Prices ($/MT) |
|||
Scenario |
2026 |
2030 |
2040 |
IEA STEPS |
N/A |
N/A |
N/A |
IEA APS |
N/A |
135 |
175 |
WM AET 1.5 |
96 |
136 |
173 |
In 2021 we announced our ambitions for near- and long-
term emissions reductions relative to our revised 2020
baseline, with short- and medium-term targets to reduce
Scope 1 methane emissions intensity by 30% by 2026 and
50% by 2030. Based on our revised IPCC 2020 baseline
methane intensity of 1.6 MT CO2e/MMcfe, our targets are
therefore 1.1 MT CO2e/MMcfe by 2026 and 0.8 MT CO2e/
MMcfe by 2030. In addition, we have a long-term goal to
achieve net zero Scope 1 and 2 GHG emissions by 2040.
Our revised IPCC 2020 baseline for CO2 emissions intensity
across both Scopes for 2020 was 2.1 MT CO2/MMcfe.
Using the carbon price assumptions used in each of the
climate scenarios, the potential financial impact associated
with our methane emissions intensity targets in 2030 would
be $0.11/Mcfe under APS and $0.11/Mcfe under AET-1.5. The
carbon cost per Mcfe is calculated using the carbon price
from each scenario and multiplying this by the methane
intensity target for each of the target years, i.e. 2026, 2030
and 2040. As we have already surpassed our 2030
methane reduction target in 2023, the potential financial
impact of our methane emissions will likely be lower than
the calculated value above as we continue to focus our
efforts on de-methanization of our operations. There would
be no cost to our business under STEPS as this scenario
does not incorporate a U.S. carbon price. These figures do
not account for any additional costs from emissions of CO₂.
Although we have not yet set specific targets for reducing
the intensity of our CO₂ emissions, if for the purposes of
this analysis we assume that we can reduce these at the
same rate as the intensity of our methane emissions, we
would expect our total Scope 1 and 2 emissions intensity in
2030 to be 1.05 MT CO2e/MMcfe, implying a total potential
carbon cost in 2030 (covering CO₂ and methane) of just
over $0.14/Mcfe in both APS and AET-1.5 scenarios.
Alternatively, if we take a less optimistic view and assume
that our CO₂ emissions remain at 2020 levels until 2030,
then the total intensity of our emissions would be 1.3 MT
CO2e/MMcfe, implying a total carbon cost in 2030 of close
to $0.18/Mcfe.
We aim to reduce our absolute Scope 1 and 2 GHG
emissions in line to achieve net zero in line with our 2040
goal. We would expect this to reduce the overall carbon
cost to our business from these emissions even in the face
of rising carbon prices. However, we recognize that our
2040 net zero goal assumes that there will still be residual
emissions from our operations which will need to be offset
elsewhere and that we may therefore still incur a carbon
cost associated with those residual emissions. We plan to
build these considerations into our financial models as the
pathway for our emissions after 2030 and for carbon
pricing becomes clearer in the coming years.
 |
RISK MANAGEMENT
IDENTIFYING, ASSESSING AND MANAGING
CLIMATE-RELATED RISKS AND
OPPORTUNITIES
|
We recognize that the transition to a lower-carbon future,
inclusive of both physical and transition risks, could have
significant implications for our corporate strategy and
could negatively impact our financial results due to lower
demand and lower prices for natural gas and oil. The size
and scope of market-related climate risks are assessed and
quantified through scenario analysis as detailed in the
Strategy section of this TCFD Report. Equally, we recognize
that physical risks, such as extreme rainfall, water stress,
and heat stress, related to climate variability, could impact
our operations. The Strategy section also shows details of
our qualitative analysis of the impact of specific acute and
chronic physical risks on our portfolio, including mitigation
and adaptation actions.
We also actively monitor our performance against our
peers and engage with industry organizations such as the
Natural Gas Sustainability Initiative (“NGSI”) and OGMP to
ensure that our approach to climate risk, particularly the
decarbonization of our operations, follows best practice, as
described elsewhere in this TCFD Report.
This section of the TCFD Report focuses on our risk
management processes, including how we identify, assess,
and manage climate-related risks.
Effective risk management and control is a key component
to the successful execution of our business strategy and
objectives. Under the oversight of the Board’s Audit & Risk
Committee, our Senior Leadership Team developed risk
management review processes which include the oversight
and monitoring of our risk control and mitigation efforts.
These risk management processes were developed to
minimize risks across our operations, support the
achievement of our strategic objectives, and create
sustainable value for our stakeholders.
As part of our ERM program, we seek to assess all potential
risks, including climate-related, affecting stakeholders and
the natural environment and to counteract and mitigate
such risks as effectively and expeditiously as possible. Our
company-wide risk management processes ensure risks are
appropriately identified, assessed, and managed.
RISK IDENTIFICATION
Within the program’s risk identification phase, we capture
potential and emerging risks that could arise as a result of a
change in circumstances or new developments impacting
our company. To identify climate-related risks, we rely on
discussions with business unit leaders across the
organization, the experience and expertise of our Board
members, third-party experts, and our knowledge of
current and emerging industry- or company-specific risks.
Through consistent, robust stakeholder engagement and
our periodic corporate Materiality Assessment with
stakeholders, we also have the opportunity to identify
issues with the greatest impact, whether through risks or
opportunities, on our business. In 2023, climate and climate
management was identified by our stakeholders as a top 25
issue for the Group.
Climate-related risks are classified in alignment with the
TCFD’s description of physical and transition risks, as
described in the Strategy section above.
RISK ASSESSMENT
We assess climate-related risks to our business by utilizing
a scorecard approach, alongside other risk categories
considering their (i) likelihood, (ii) potential impact, and (iii)
speed of impact. For each Principal Risk, we also develop a
list of mitigating activities and other opportunities that may
offset or minimize the risk. In our most recent risk
assessment, we identified Climate as a Principal Risk, and
further, as a Strategic Risk within Diversified’s risk universe
when considering the potential it has to also influence
several other Principal Risks including Corporate Strategy
and Acquisition Risk, Regulatory and Political Risk, and
Commodity Price Volatility Risk.
RISK MANAGEMENT
While we consider risk management the responsibility of all
employees and have empowered them to enhance our
processes and procedures as appropriate to mitigate risks,
a designated Risk Owner is primarily responsible for
implementing the identified mitigating controls and action
plans in order to remove or minimize the likelihood and
impact of the risk before it occurs. As more fully described
below, the Risk Owner also provides updates to Executive
and senior management and the Board, as applicable, on
mitigation efforts of the risk.
Integration of Risk Management Processes into the
Organization’s Overall Risk Management
As described in part in the Governance section of this TCFD
Report, the ownership structure for Climate Risk is shown
below and begins with the Board’s responsibility to ensure
that Climate Risk is ultimately addressed and mitigated
through the Group’s corporate strategy and business
model. Assuming oversight responsibility of Climate Risk on
behalf of the Board, the Sustainability & Safety Committee
monitors company performance on operational climate
mitigation activities and energy transition adaptation plans
by actively engaging with senior management on these
topics.
At the risk level, each Principal Risk is assigned to a Risk
Owner, a member of senior management who identifies and
develops mitigating controls and future opportunities for
mitigation as part of the risk scorecard process. Throughout
the year, under the oversight of an Executive Risk Owner,
the Risk Owner is responsible for actively monitoring and
managing the risk and likewise periodically updating the
risk scorecard.
As part of our ERM program, the role of Risk Owner for
Climate Risk is assigned to the Senior Vice President-
Sustainability. This Risk Owner, other senior management
team members, the Executive Risk Owner, and the CEO
regularly engage in risk discussions across all areas of our
operations, ensuring climate-related risks are integrated
into the Group’s overall and ongoing risk management
considerations, processes and actions. This healthy dialogue
regarding risk creates a culture that highly regards risk
mitigation as a way to preserve and create value for our
stakeholders. As a standing invited guest to the
Sustainability & Safety Committee meetings of the Board,
the Climate Risk Owner also regularly shares the Group’s
actions and mitigating activities regarding Climate Risk.
As a company, we also monitor emerging energy transition
trends and shifting conditions in the energy industry –
ranging from new climate-related regulatory requirements
to global climate impacts – so we are prepared to respond
accordingly. Such a response may include policy or
procedural changes or additional resources or training to
mitigate the emerging risks.
CLIMATE RISK OWNERSHIP STRUCTURE
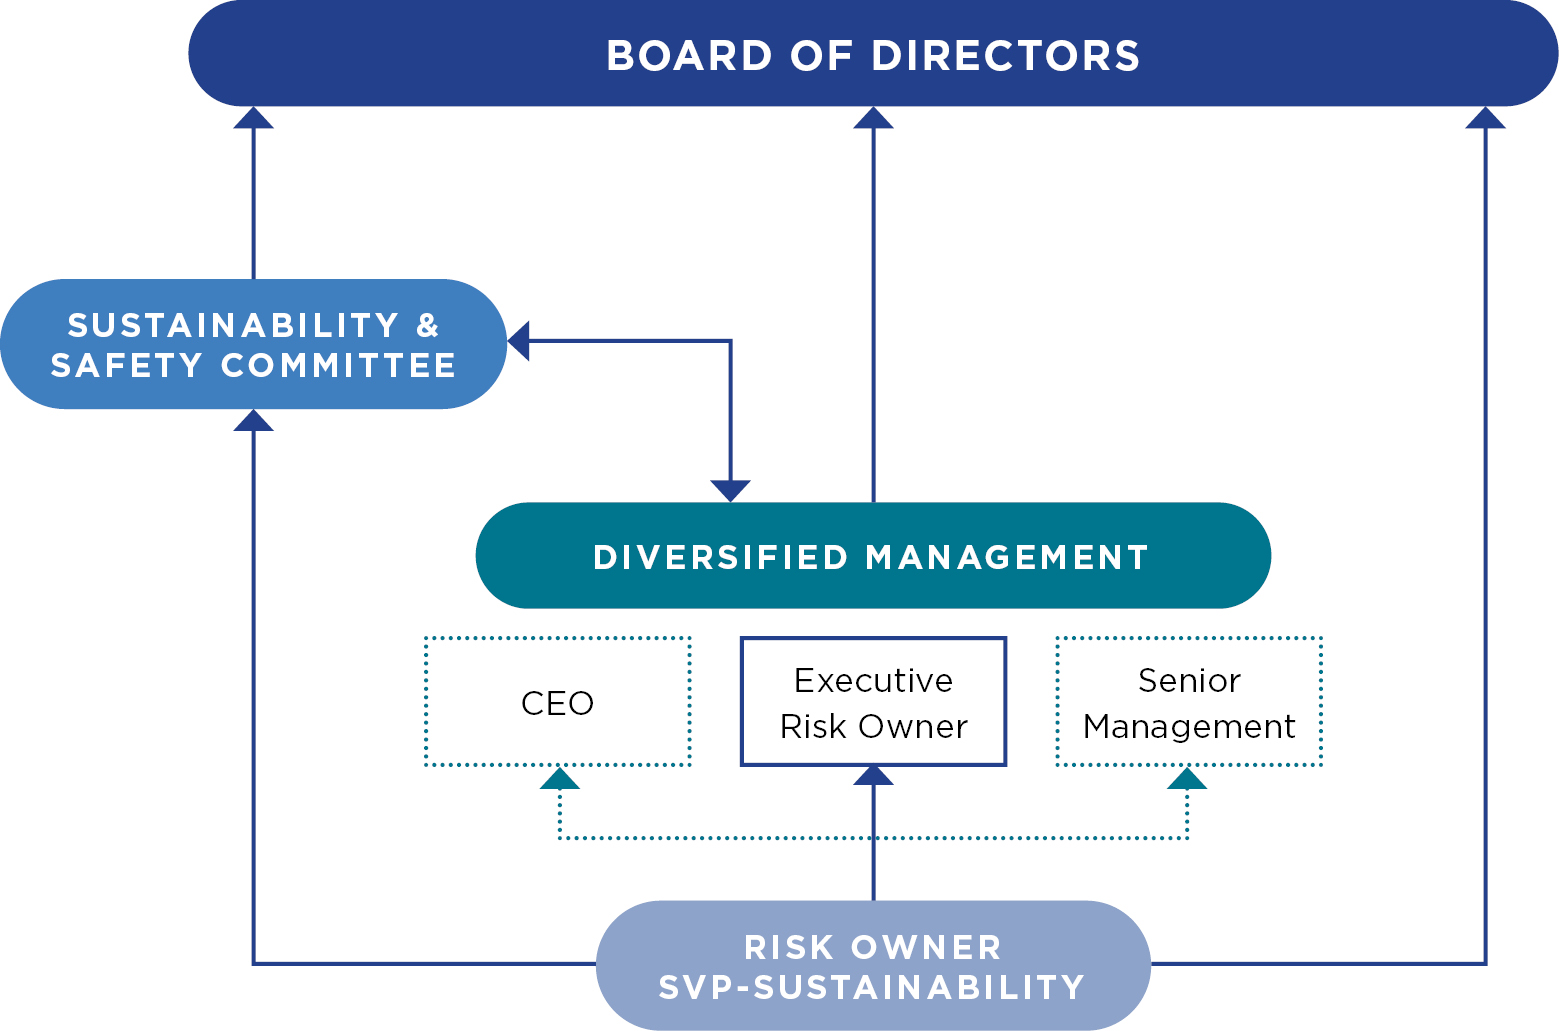
Additional details of our ERM framework and program are
set out within this Annual Report .
Looking ahead, in 2024, the broader ERM program that
includes Climate Risk will be facilitated by our Senior Vice
President of Accounting who, under the ongoing oversight
of the Audit & Risk Committee, will:
—Engage Executive Management for a full review and
consensus of the Tier I and Tier II risks within our
risk universe;
—Assess the impact of the risks to corporate strategy and
develop relevant KPIs;
—Ensure Risk Owners develop, monitor, manage, and
report risk mitigation activities and opportunities to
Executive Management; and
—Present a full summary of the risks, KPIs, mitigating
actions, and opportunities to the Board.
 |
METRICS & TARGETS
Beating Our Emissions Targets on Our
Path Towards Net Zero
|
FOCUS ON SCOPE 1 & 2 EMISSIONS
We have been resolute in our focus on reducing GHG
emissions from our operations throughout 2023 with a
particular focus on reducing methane intensity,
underpinned by our clearly defined targets, relative to the
2020 baseline:
—30% reduction in Scope 1 methane intensity by 2026;
—50% reduction in Scope 1 methane intensity by 2030; and
—Net Zero from Scope 1 and 2 GHG emissions by 2040.
Methane emissions have a magnified impact on climate
change due to their high global warming potential
compared to carbon dioxide, hence our focus on reducing
the methane intensity of our operations. The significant
progress we are making in achieving our targets is reflected
in the reported emissions table below, reflective of our
achievement in 2023 of a methane intensity of 0.8 MT
CO2e/MMcfe, a 50% reduction from our 2020 baseline and
the accomplishment of our 2030 target seven years ahead
of schedule. This is also reflected in year-over-year change
in the portion of Scope 1 methane emission as to total
Scope 1 emissions, or 27% at year-end 2023 versus 38% at
year-end 2022.
Nonetheless, our primary focus remains on continuing near-
term efforts to further reduce the methane intensity of our
operations. This desire is driven by our longer-term goal to
achieve net zero emissions though we move forward
cautiously, within a regulatory environment that is
continuing to evolve and has the potential to increase our
reported emissions with the addition of new requirements
and new source categories not previously reported. As
such, we intend to evaluate those regulations as we
consider new interim targets.
As previously shared, we plan to increase in the medium-
term our efforts to reduce the combustion-derived CO2 in
our operations through efficiency improvements, potential
electrification, and the potential broader use of
renewable energy.
After focusing on true reductions and/or eliminations of
GHG emissions, whether methane or CO2, we will then seek
to address residual operating emissions through the use of
credible offsets and the generation of voluntary and
regulated carbon credits. We believe that this approach
sets us on course for the achievement of our longer-term
goal of net zero Scope 1 and 2 GHG emissions by 2040.
ACTIVITY LEVELS FOR THE KEY STEPS TOWARDS NET ZERO
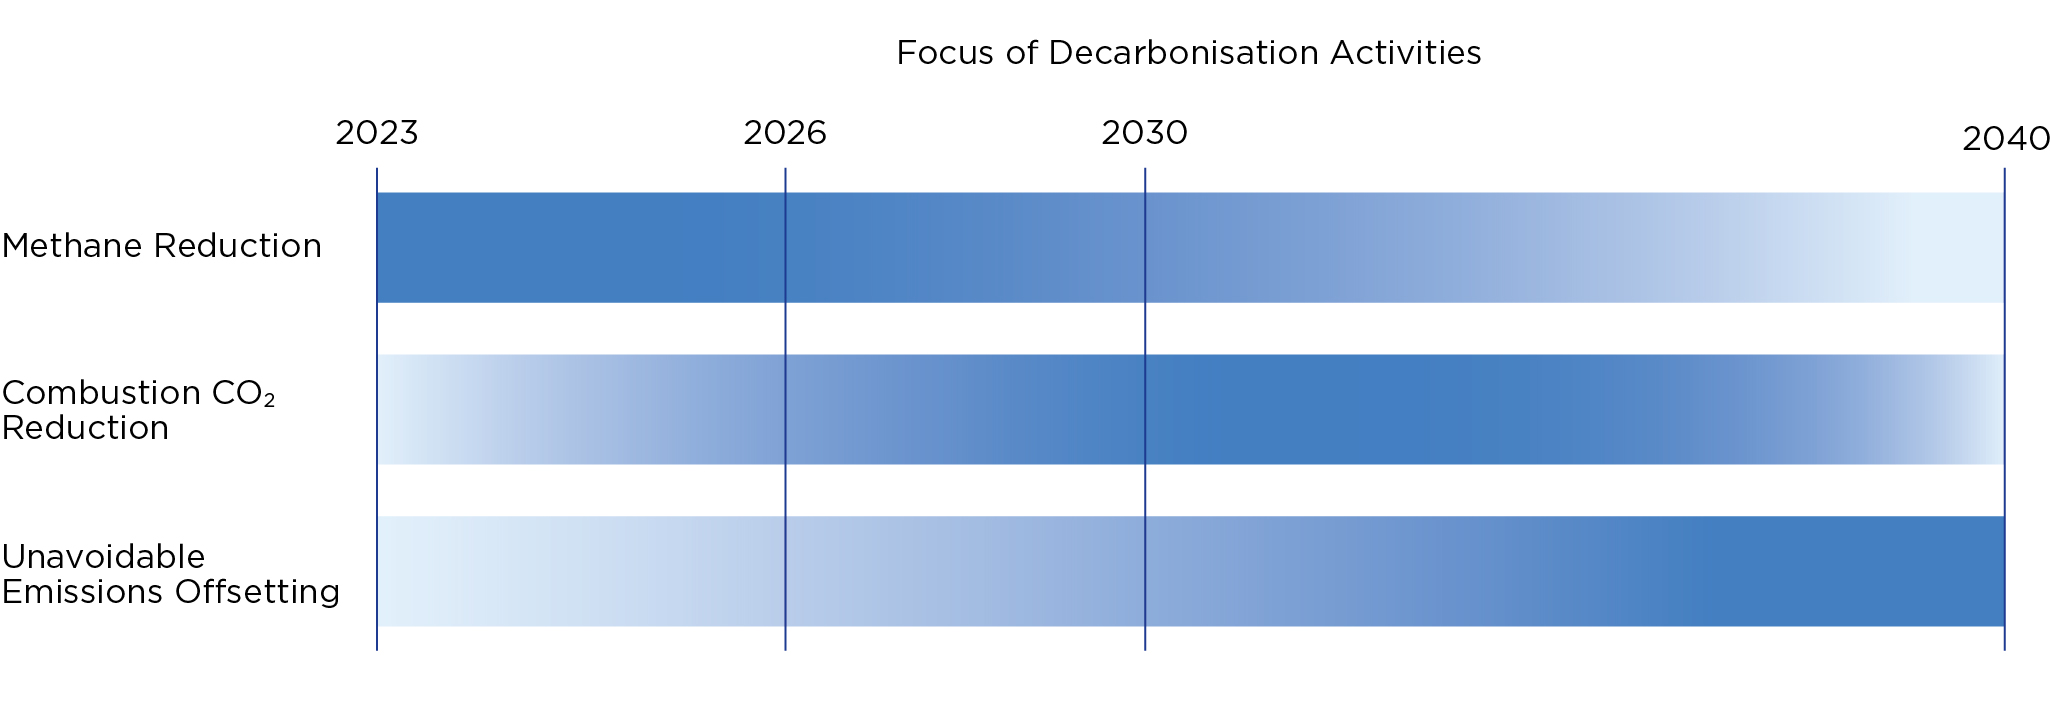
REPORTING GHG EMISSIONS
To monitor our progress towards achieving our GHG emissions reduction targets and ultimate net zero goal, we collect and
evaluate a comprehensive set of metrics that are material to our performance. These metrics, which include our absolute
Scope 1 and 2 GHG emissions broken down by type and source, are also included in the GHG Emissions table below. Scope 1
and 2 GHG emissions data were assured by ISOS Group Inc. (“ISOS”). ISOS provided a moderate Level II assurance in
accordance with the AccountAbility 1000 Assurance Standard.
GHG Emissions(a)
|
Unit |
2023 |
2022 |
2021 |
Scope 1 Emissions: |
thousand MT CO2e
|
1,561 |
1,820 |
1,631 |
Carbon Dioxide |
thousand MT CO2
|
1,140 |
1,130 |
841 |
Methane(b)
|
thousand MT CO2e
|
420 |
686 |
790 |
Nitrous Oxide |
thousand MT CO2e
|
1 |
4 |
1 |
% Methane |
% |
27 |
38 |
48 |
Scope 1 Methane Intensity |
MT CO2e/MMcfe
|
0.8 |
1.2 |
1.5 |
Scope 1 Methane Intensity - NGSI(c)
|
% |
0.11 |
0.21 |
0.28 |
Scope 1 Emissions Attributable to:(b)(d)
|
||||
Flared Hydrocarbons |
thousand MT CO2e
|
— |
0 |
0 |
Other Combustion |
thousand MT CO2e
|
1,178 |
1,173 |
870 |
Process Emissions |
thousand MT CO2e
|
92 |
67 |
65 |
Other Vented Emissions |
thousand MT CO2e
|
63 |
182 |
295 |
Fugitive Emissions |
thousand MT CO2e
|
228 |
399 |
402 |
Scope 2 Emissions - Total Company(b)
|
thousand MT CO2e
|
61 |
59 |
3 |
Energy consumption |
million kWh |
134 |
128 |
7 |
Total Scope 1 and Scope 2(b)
|
thousand MT CO2e
|
1,622 |
1,879 |
1,634 |
Scope 1 and Scope 2 GHG Emissions
Intensity(b)
|
MT CO2e/MMcfe
|
3.1 |
3.4 |
3.1 |
Air Quality(a)(e)
|
Unit |
2023 |
2022 |
2021 |
Nitrogen Oxide (NOx, excluding N2O)
|
metric tons |
21,520 |
21,546 |
16,126 |
Carbon Monoxide (CO) |
metric tons |
18,448 |
18,530 |
13,842 |
Sulfur Oxide (SOx) |
metric tons |
61 |
108 |
81 |
Volatile Organic Compounds (VOC) |
metric tons |
3,108 |
4,421 |
6,632 |
Particulate Matter (PM Total) |
metric tons |
137 |
140 |
105 |
Totals may not sum due to rounding.
(a)Emissions are reported under a modified Intergovernmental Panel on Climate Change (“IPCC”) report format for EU investors.
(b)Based on a 100-year global warming potential of 28 for methane, in line with IPCC’s Fifth Assessment Report.
(c)Using the Natural Gas Sustainability Initiative protocol, and to support direct comparability among the industry’s producers, represents
methane intensity using methane emissions from production assets only (therefore, excluding gathering & boosting facilities) divided by
gross natural gas production.
(d)Reflects Sustainability Accounting Standards Board categories for reporting Scope 1 GHG emissions (EM-EP-110a.2) in line with the Oil & Gas
– Exploration & Production Sustainability Accounting Standard (October 2018).
(e)2022 and 2021 were recast from previous disclosures to mirror like computations in 2023, inclusive of updated calculation assumptions and
new approved reporting protocols, thus improving year-over-year comparability.
Disclaimer: GHG emissions were calculated per IPCC reporting guidance, which permits best engineering estimates for certain emissions
categories, and which may vary from the prescriptive measures applied under U.S. EPA reporting standards. The source data used in these
calculations were accurate and complete, to the best of our knowledge, at the time they were gathered and compiled. If new data or corrections
to existing data are discovered, the Group may update emissions calculations as permitted and in accordance with industry standards and
expectations. Such updates will be included in future reporting and posted to our website at www.div.energy where such posts may take place
without notice.
We have continued to focus our efforts on the reduction of
methane emissions from our operations with significant
success reflected in achieving our 2030 target seven years
ahead of schedule. As the bulk of our methane emissions
are largely a function of fugitive emissions and natural gas-
driven pneumatics, we have continued to address these
areas. Throughout 2023, we built upon previous
achievements and continued to pursue aggressive leak
detection and repair initiatives, as discussed in our Strategy
review, combined with replacing natural gas-driven
pneumatic devices with compressed air. These activities
have resulted in a 39% year-over-year reduction in absolute
Scope 1 methane emissions to 420 thousand MT CO2e from
686 thousand MT CO2e in 2022. Our Scope 1 methane
intensity improved more than 30% year-over-year to 0.8 MT
CO2e/ MMcfe and contributes to a three-year cumulative
reduction in methane intensity of ~50%.
METHANE INTENSITY LEVELS (2020-2023) vs.
DEFINED TARGETS
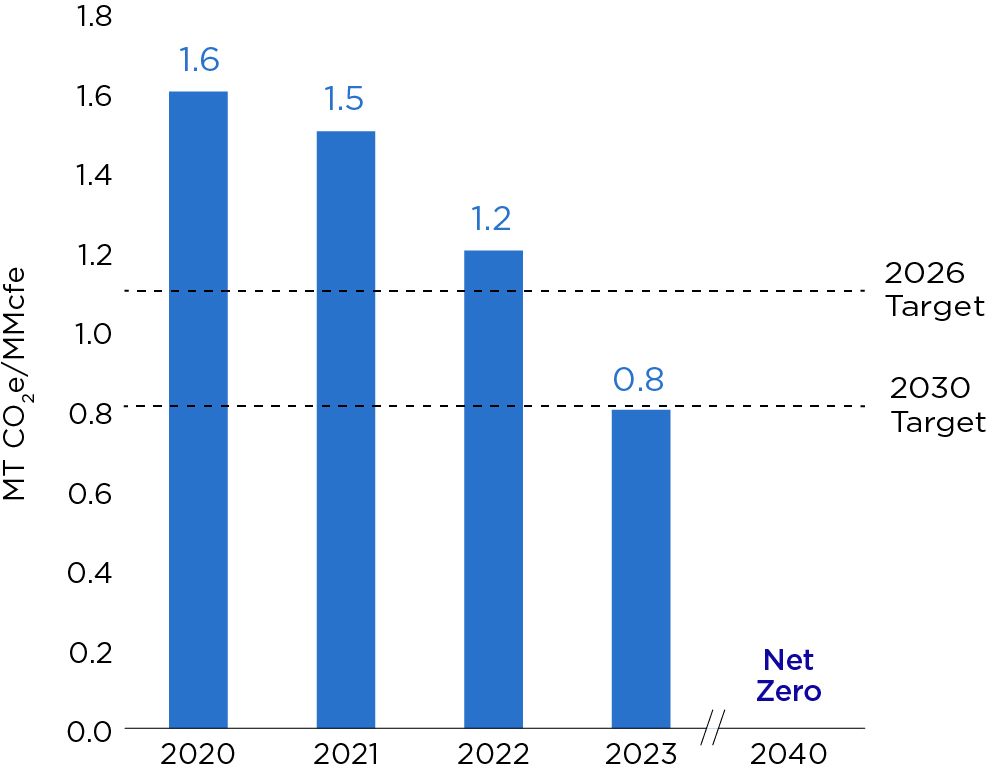
Carbon dioxide emissions now account for 73% of our year-
end 2023 total Scope 1 emissions portfolio, an increase from
the prior year’s 62% of Scope 1 emissions though not
surprising given our near-term focus and success on
reducing methane emissions. Year-over-year absolute
Scope 1 CO2 emissions increased by approximately 10
thousand MT CO2 to 1,140 thousand MT CO2. A majority of
Diversified's CO2 emissions are generally attributable to
compressors and vehicle fuel. For 2023, this slight increase
in CO2 emissions was largely attributable to an increase in
liquid fuel emissions as a function of increased produced
water hauling associated with a Central Region acquisition
during the year and refined calculation methodologies.
Nitrous oxide remains an immaterial component of our
overall GHG emissions, totaling just one thousand MT CO2e
in 2023. Further, our location-based Scope 2 GHG emissions
remained largely unchanged year-over-year at ~61 thousand
MT CO2e. As such, the primary drivers of the net reduction
in total absolute Scope 1 and Scope 2 GHG emissions were
the aforementioned significant methane emission
reductions in fugitives and pneumatics, as reflected in the
14% decline from 1,879 thousand MT CO2e in 2022 to 1,622
thousand MT CO2e in 2023. With this reduction, our overall
Scope 1 and Scope 2 GHG emissions intensity declined 9%
from 3.4 MT CO2e/MMcfe in 2022 to 3.1 MT CO2e/MMcfe at
year-end 2023.
YEAR-OVER-YEAR CHANGE IN SCOPE 1 AND 2 EMISSIONS
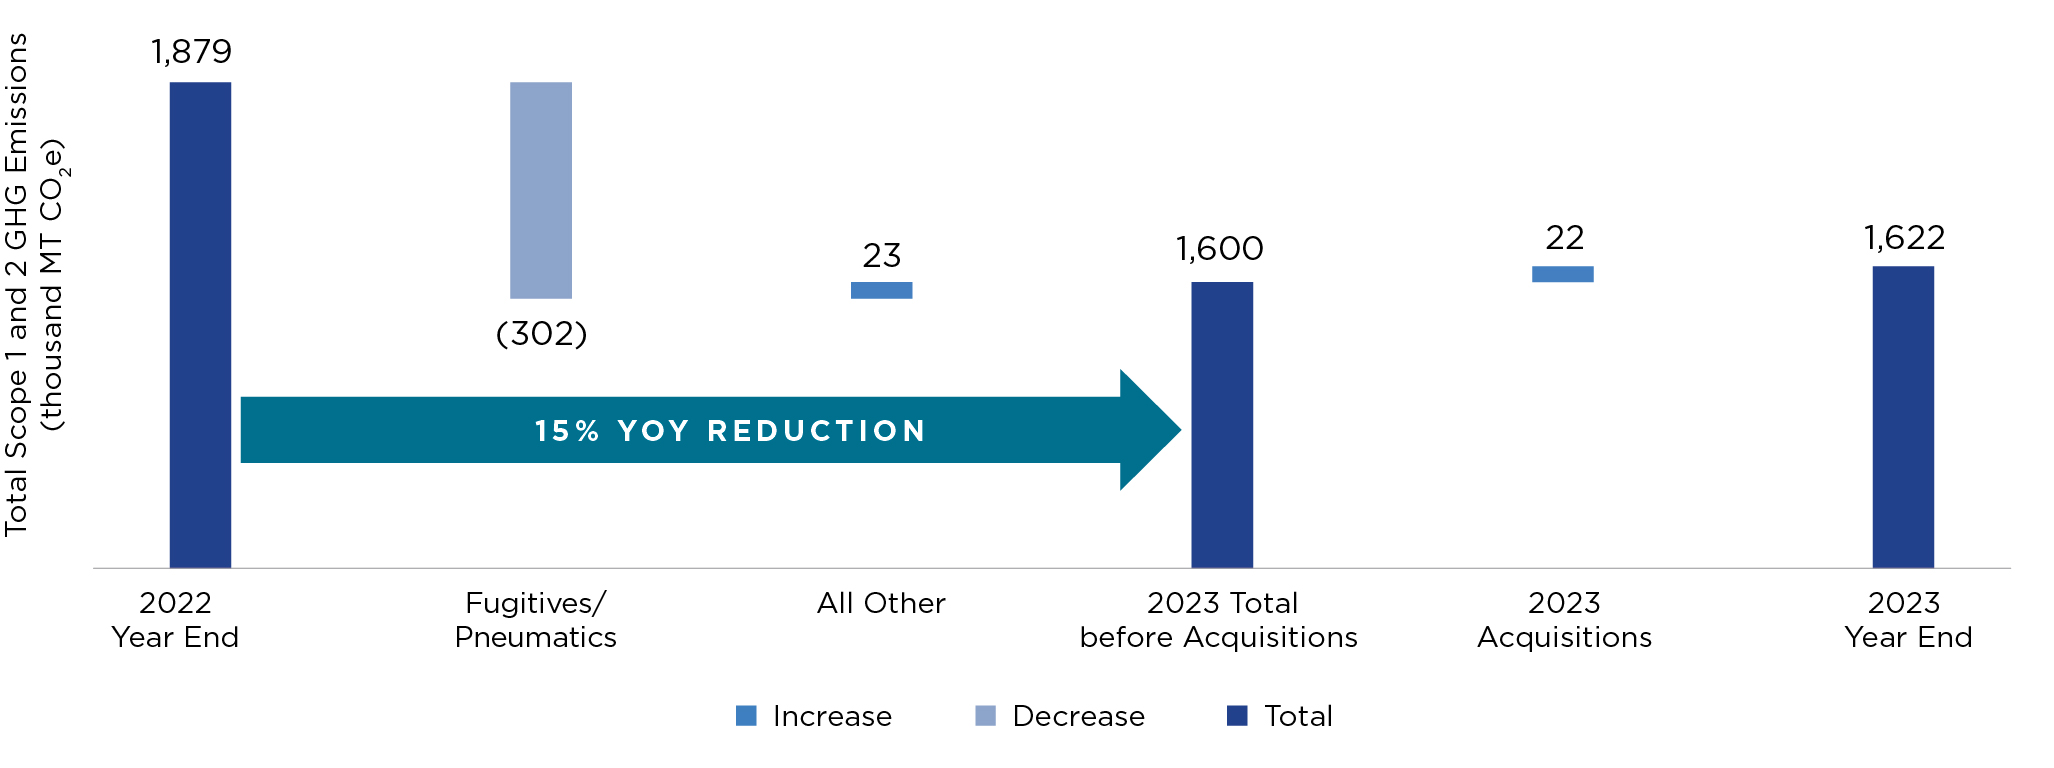
WATER USAGE
Due to the geographic locations of our assets and the
nature of our business model aimed at acquiring and
operating existing wells rather than drilling new wells, we
do not consider water availability to be a material climate-
related risk for our company. Further, according to the
World Resources Institute’s Aqueduct Water Risk Atlas,
99% of Diversified’s operations are located in states
classified as Low Overall Water Risk areas, using the oil and
gas industry-specific weighting scheme which is most
relevant for our business. At present we have therefore not
set ourselves specific targets regarding water usage.
INCENTIVIZING EMISSIONS
REDUCTION PERFORMANCE
Our commitment to reducing our GHG emissions is
reflected in our executive compensation plans which
include sustainability and climate-related targets.
An ESG-related performance component was first assigned
to a portion of the Executive Directors’ short-term incentive
plan (“STIP”) in 2020. Since then, our Remuneration
Committee and the Board have increased the ESG-related
percentage from 10% to 30%. ESG-related metrics were
also added to Executive Directors’ long-term incentive plan
(“LTIP”) first in 2022 and continue presently through 2024.
For both the STIP and LTIP, a portion of those ESG-related
metrics are specifically climate-related targets tied to
tactical methods to achieve further methane emission
reductions in our journey toward net zero in 2040, and thus
these short- and long-term incentive compensation metrics
are also applicable to members of senior leadership who
play an active role in executing these tactical methods.
2020 |
2021 |
2022 |
2023 |
2024 |
|
STIP |
10% |
25% |
30% |
30% |
30% |
LTIP |
N/A |
N/A |
20% |
20% |
20% |
CONCLUSION
We recognize that the energy transition is a challenging
and complex global issue. However, Diversified continues to
prioritize its ambitious goals of reducing the carbon
intensity of its operations. With sustainability deeply
embedded in every aspect of our organization, we remain
steadfast in integrating climate considerations into our
company culture and decision-making processes.
We have assessed the impact of transition and physical
climate risks on our portfolio. The size and scope of market-
related climate risks were assessed and quantified through
scenario analysis, showing the resilience of our portfolio
even in the Net Zero scenario. Our qualitative assessment
of physical risks, such as extreme rainfall, hurricanes, water
stress, and heat stress, showed we are well-positioned to
mitigate and adapt to these risks, even in a more extreme
‘hothouse world’ scenario, associated with a temperature
increase of 4.3°C by 2100.
Our pragmatic approach to emission reductions, with a
near- and mid-term focus on de-methanization of our
operations, has yielded outstanding results with our 2030
methane intensity reduction target being achieved seven
years ahead of schedule - though we will not slow in our
efforts to capture further emission reductions as we move
forward. Our mission to achieve our long-term target of net
zero in 2040 continues, emboldened by the achievements
we have already made in reducing the methane intensity of
our operations. As we work toward our net zero targets, we
are committed to keeping environmental stewardship at the
forefront of our strategic decision-making.
Managing Our Footprint
Diversified’s commitment to environmental stewardship
is focused on our responsible management of the natural
resources located within the communities we serve, the
safe and permanent retirement of end-of-life assets, our
efficient use of water, and the protection of biodiversity.
Our efforts to manage our environmental footprint start
with Diversified employees, who leverage their expertise
alongside innovative and proven solutions to help
reduce any potential negative impacts resulting from
our operations.
In addition to the previous GHG emissions and air quality
data and accompanying discussion within our
aforementioned TCFD disclosures, below are a number of
environmentally-focused areas within our footprint that are
relevant to our 2023 actions.
WELL RETIREMENT
Through our wholly-owned subsidiary, Next LVL Energy,
Diversified is a leader in well retirement in Appalachia. Next
LVL retires not only end-of-life wells owned by Diversified,
but also wells owned by other oil and gas operators in
Appalachia and abandoned wells with no current owner
that are the responsibility of the state. Further, Next LVL
serves as manager of the federal orphan well retirement
programs in southern Ohio.
ACTUAL WELLS RETIRED
 |
DEC wells(a)
|
 |
Total wells, including
3rd party(a)
|
(a)Inclusive of 14 and 21 Central Region wells retired during 2022
and 2023, respectively
We retired 201 Diversified wells in Appalachia in 2023,
exceeding our stated objective for the year and significantly
exceeding annual requirements as per our existing state
agreements. We also retired 21 Diversified owned wells in
our Central Region states, bringing total retired company
wells to 222 in 2023.
During the year, the Next LVL team directly retired or
managed the retirement of 182 third-party wells, including
148 state and federal orphan wells and 34 wells for other
third-party operators. When considering both Diversified
and third-party retirements, we plugged a total of 404
wells during the year.
In its first full year of operation under Diversified’s
ownership, Next LVL’s expanded retirement capabilities
now include 14 teams and 17 rigs, well positioning the Group
to remain one of Appalachia’s largest and most active asset
retirement companies. Responsibly retiring end-of-life
assets is an integral part of our environmental stewardship
strategy. Included in this strategy are a rig utilization
optimization program, or a streamlined workflow that
affords more efficient movement of vehicles and equipment
- thus reducing the plausibility of safety incidents while
simultaneously reducing vehicles emissions - and bespoke
well pad restoration and biodiversity protections while
retiring the wells and restoring the site.
WATER MANAGEMENT
Water is a finite and essential resource and thus,
responsible water withdrawal, use, and disposal is
important for our environmental performance. Our
operations are primarily located within areas that qualify as
Low Overall Water Risk, with only 1% located in areas that
have Low to Medium Overall Water Risk and none in areas
beyond Medium Risk, as assigned by the World Resources
Institute’s Aqueduct Water Risk Atlas. Even so, we apply
the same principles of operational efficiency and best
practice to our water use that we apply across our business,
with the goal to: (i) limit freshwater use, (ii) manage our
produced water, and (iii) expand recycling and reuse of
produced water.
Our differentiated business model significantly decreases
our reliance on water and therefore on freshwater
withdrawal, thus alleviating an environmental concern
material to many of our peers engaged in new
development. Given the location of our operations in low
water risk areas, no freshwater was withdrawn in high or
extremely high water stressed areas in 2023.
In 2023, we decreased our annual total water use to less
than one million barrels, or nearly 70% less than the prior
year, primarily as a result of decreased water consumption
for contracted drilling and hydraulic stimulation activities
for third parties during the year. Our own water
consumption is largely related to domestic use and various
well operations, including certain well treatments and asset
retirement activities. This decline in water consumption as
compared to our total gross production resulted in a
significant improvement in our year-over-year water
consumption intensity, as reflected below.
WATER CONSUMPTION INTENSITY(b)
(Bbl of Water per Boe Gross Production)
(b)To improve year-over-year comparability, 2021 and 2022
metrics were revised to reflect updated reporting assumptions
for domestic water use
The main waste associated with our operations is produced
water, a naturally occurring by-product from the
production of natural gas and oil. Therefore, most of our
efforts in water management focus on the handling and
disposal of produced water given the potential
environmental implications of the same. During 2023, our
produced water increased 34% year-over-year to 83
thousand barrels per day, due primarily to our increasing
presence in the Central Region through acquisition.
Our framework for managing produced water effluents
aims to first limit any environmental impacts and to
increase the safety of employees, contractors and
surrounding communities. Then, we focus on operational
efficiencies to reduce waste water, which may include
recycling and reuse efforts as well as seeking innovative
approaches or technologies which can evaporate water
from the production stream to reduce total produced
water or extract heavy elements from the produced water
to allow the now distilled water to be released into
water streams.
SPILL PREVENTION & MANAGEMENT
As an integral aspect of our environmental management
program, Diversified is committed to effectively preventing
spills across our operations. Our strategic approach to spill
prevention includes (i) maximizing the use of well-
maintained pipelines to transport produced liquids, (ii)
utilizing continuous monitoring and automated data
collection where applicable to inform our liquids decision-
making, and (iii) removing out of service or degraded
equipment which could inadvertently contribute to spills.
Our spill intensity rate improved 64% year-over-year largely
as a result of the creation and empowerment of a Spill
Prevention Focus Group in 2023 who developed and
effectuated a plan to better mitigate and manage spill
incidents, starting with a root cause analysis and action
process that included informed data collection and
increased training. Additional contributory actions included
prevention and mitigation awareness from our integrated
operations centers, the increased frequency of equipment
inspections and the use of sacrificial anodes to lower the
rate of naturally occurring corrosion in tanks.
SPILL INTENSITY
(Bbl of Spills per MBbl Gross Liquids Production)
BIODIVERSITY
At Diversified, we are committed to safeguarding nature
and conserving biodiversity and ecosystems. We prioritize
responsible stewardship of our leaseholds and assets, and
focus on (i) minimizing environmental disruption though
our “Avoid, Mitigate, Restore and Offset” approach, (ii)
protecting sensitive species, habitats, and waterways, and
(iii) enhancing biodiversity and ecosystems within our
operational footprint. We achieve this through strong
oversight, risk management and standardized procedures,
recognizing that biodiversity protection is central to our
sustainable operations.
As part of our zero net deforestation goal and biodiversity
commitment, our 2023 efforts included a wide spectrum of
ecosystem enhancement activities, starting with bespoke
well pad restoration following well retirements for both
Diversified and third parties. For our largest project in 2023,
we partnered with West Virginia State University and its
Extension Service, along with over 500 individual
volunteers, to enable the planting during the year of nearly
11,000 bare-root seedlings and containerized trees in
municipal parks, underserved neighborhoods, degraded
forests, university campuses, and more.
Separately, we maximized the use of existing rights of way to
avoid potential stream and wetlands impacts during pipeline
extension work and effectuated projects independently
identified and developed by our summer intern which
included building and installing woodpecker houses in
various locations within our West Virginia footprint.
Safety in Focus
‘Safety-No Compromises’ has been and will continue to be
our utmost daily operational priority. While safety is
inherently the primary functional responsibility of the EHS
team, we recognize that safety is every employee’s
responsibility and priority - no matter the employee’s
location, position or job function. We recognize that
comprehensive and effective management practices
underpin the safety of our employees.
We take a data-driven approach to safety that includes an
electronic dashboard which contains key EHS metrics and is
readily accessible by all employees at any time. Thus, our
approach to safety training for our employees is both
preventative and responsive, utilizing the current and
historical results and trends from this dashboard -
partnered with amnesty-based Good Catch/Near Miss
reporting, computer-based and fit-for-purpose training, and
root cause analysis - to drive our safety training practices
and protocol as we work diligently to uphold a zero-harm
working environment.
PERSONAL SAFETY
While we take this approach to keep safety top of mind for
employees while on the job and despite an 84% increase in
Good Catch/Near Miss reporting, 2023 was a challenging year
for personal safety performance. We recorded a Total
Recordable Incident Rate (“TRIR”) of 1.28, up 75% from the
0.73 recorded in 2022 and higher than our 2023 target of 1.03.
This year’s incident rate was driven primarily by an increase
in the total number of incidents, which were attributable in
part to short service employees with less than one year of
service under Diversified’s safety culture, which we are
seeking to address through our safety programs.
As with any incident and no matter the severity, our desire
for a zero harm working environment and our data-driven
approach to change management encourage us to (i) take
appropriate time to review the circumstances, causes and
corrective actions of these incidents and (ii) use these
results as a catalyst for improving forward
safety performance.
Our lessons learned to date in the review of our 2023
incidents reinforce what we already know - the task of
promoting safety is never finished - and highlight where our
safety program needs improvement, specifically in our
accountability and corrective action following an incident.
We have created a more robust work-flow for
accountability for safety incidents and formed a task force
to evaluate causal factors. So far, we have identified
opportunities for increased instruction for front line and
mid-level managers. and we will utilize the efforts of our
task force to drive additional, appropriate
program improvements.
Moving forward in 2024, while we will continue to promote
our Good Catch/Near Miss amnesty reporting program, we
are also updating our personal safety metrics to include
both TRIR and a severity rate, as measured by Lost Time
Incident rate, to provide enhanced clarity to our
safety performance.
TRIR
Per 200,000 work hours
DRIVER SAFETY
Our field operations span across nine states, and this
geographic dispersion means employees may spend
significant time traveling on the roads, as evidenced by the
more than 24 million miles driven during the year. For this
reason, improving driver safety means reducing both miles
driven, which we accomplish in part through our remote
monitoring programs and efficient well tender routing, and
the accidents that occur during those miles. We seek zero
preventable motor vehicle accidents (“MVA”) during the
calendar year, and aim to incentivize accident-free driving
by offering our field teams annual safe driving awards and
leveraging our MVA metric in a portion of executive and
senior leadership short-term compensation.
Our 2023 MVA is 0.55 incidents per million miles driven, a
20% improvement from the 0.69 recorded in 2022.
VEHICLE SAFETY
Vehicle Incidents (“MVA”)
|
|
MVA |
— |
Miles Driven |
PIPELINE AND PROCESS SAFETY
We operate a full complement of natural gas production,
gathering, transmission, and storage assets, including
thousands of miles of pipeline. To keep employees, our
communities, and the environment safe and protected, we
deploy rigorous monitoring and safety measures, engage in
regular maintenance, focus on operator training, maintain
well-documented operational and safety records, and utilize
state of the art technologies to aerially survey our systems.
Reflective of our commitment to asset integrity
management, during 2023 we were audited by 16 various
state and federal regulatory agencies and received zero
non-compliance citations with civil penalties for our
operational assets and compliance programs.
Our Employees
We are committed to building a workplace that seeks to
attract and retain a talented and diverse staff by providing
attractive jobs with competitive salaries and meaningful
benefits, fostering a unified company culture, offering
equitable growth and development opportunities, and
creating a collaborative and enjoyable work environment
where all employees feel valued and supported in the work
they do.
Though our various operations encompass distinct
activities, we view our corporate and individual employee
actions through the lens of a single, unified OneDEC
approach that drives a culture of operational excellence
fostered through the integration of people and the
standardization of processes and systems. This OneDEC
approach supports and encourages company-wide
initiatives by ensuring alignment of our corporate and
sustainability goals with individual or collaborative action
supported by financial investment and well understood
principles and policies.
Regarding these principles and polices, during the year we
refreshed our Employee Relations Policy which defines
Diversified’s role in prioritizing employee well-being while
promoting an equal opportunity work environment. We also
updated our Employee Handbook to include new policies
and programs that offer additional opportunities and
benefits for employees. Finally, we developed a new
employee-specific Code of Business Conduct & Ethics
which serves as a framework for ethical decision-making,
helps ensure that all employees understand the
expectations and consequences of their actions, and
creates a safe, respectful and professional work
environment for all employees.
EMPLOYEE ENGAGEMENT
During the year, we capitalized on various opportunities to
promote employee engagement with members of
management and the Board. For example, executive
management held town hall meetings and in-the-field
interactions with employee groups, providing a platform for
the employees to receive direct updates on corporate
initiatives and developments and to ask questions directly
of executive and senior management. The Board’s Non-
Executive Director Employee Representative, Ms. Sandra
(Sandy) Stash, accompanied our Board Chairman in the fall
of 2023 on an asset and employee field visit in Texas,
meeting with employees to ensure the views of the
workforce are considered by the Directors. The Employee
Representative role was established in compliance with the
UK Corporate Governance Code, and 2023 was the third
full year of Ms. Stash’s tenure in this regard.
The valuable feedback from these meetings, along with that
resulting from our corporate-wide Employee Experience
Survey, is used to strengthen future employee engagement
and initiatives. We also regularly conduct new hire surveys
regarding the onboarding process as well as exit
interviews, both important tools to further improve
employee experiences.
In line with industry standards in the country of employment,
our employees maintain a range of relationships with union
groups. We have not previously experienced labor-related
work stoppages or strikes and believe that our relations with
our employees are satisfactory.
WORKFORCE DIVERSITY
The vast majority of our employee base at December 31,
2023 consists of production employees which includes
our upstream, midstream, and asset retirement field
personnel. All other employee positions, including back
office, administrative and executive positions, comprise
production support roles. Since inception of the Group, and
in alignment with our U.S.-based assets, all employees are
located in the U.S.
At Diversified, 11% of our total workforce at year-end was
made up of females (as self-reported), slightly higher than
the prior year-end and, in part, a function of our hiring
practices in 2023 where we hired female candidates at a
higher rate than female applications received (17% versus
14%, respectively, as self-reported). Ethnically diverse hiring
continues to be a focus. Our applicant data reflects that we
often have the least minority applicants per available job
opening in areas where we have some of the most available
openings. Likewise, we see a large number of minority
applications in a few areas where we have the least number
of annual openings. As always, we seek to enhance the
diversity of our employee base, ensuring our local
workforce mirrors the local population diversity, while also
striving to hire the best candidate for the position,
regardless of diversity characteristic.
At December 31, 2023, Senior Management, including the
executive committee and direct reports and excluding the
Executive Director, consisted of 103 employees, including
35 females (34%) and 68 males (66%).
At Diversified, we are dedicated to actively fostering an
environment of welcoming and belonging throughout all
facets of our business while demonstrating our company
principle to “value the dignity and worth of all individuals.”
Therefore, we utilize our talent acquisition team to seek and
develop programs and opportunities that allow us to
increase our diversity when hiring.

2023 PRODUCTION EMPLOYEES
|
2023 PRODUCTION SUPPORT EMPLOYEES
|
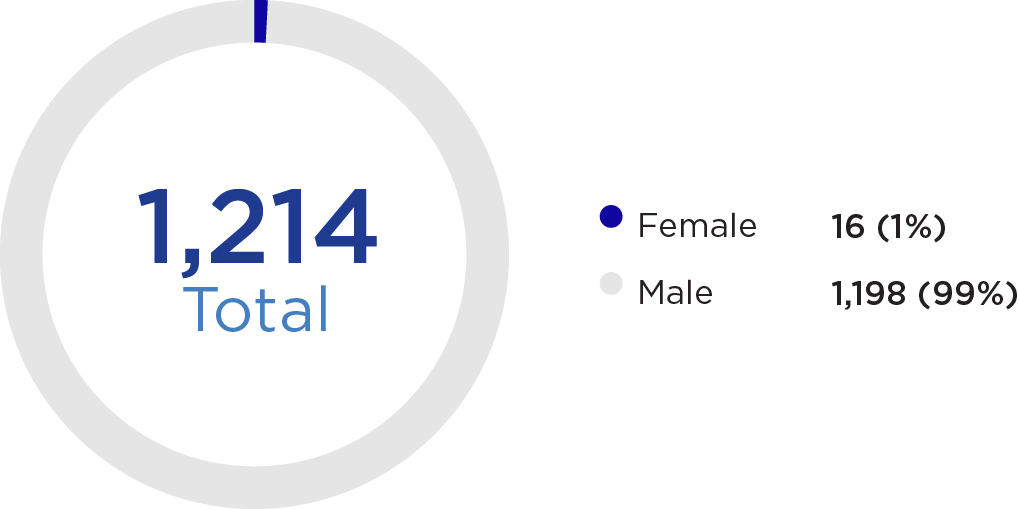 |
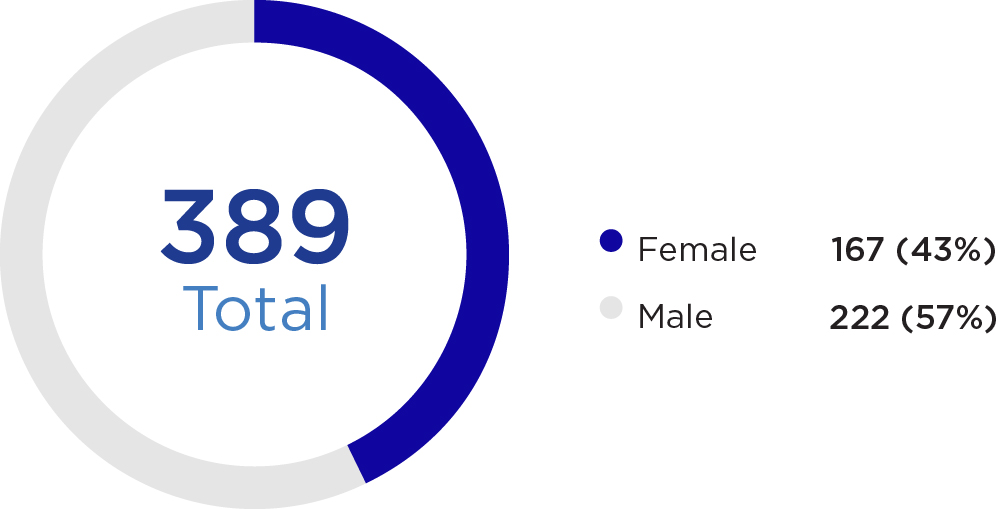 |
2022 PRODUCTION EMPLOYEES
|
2022 PRODUCTION SUPPORT EMPLOYEES
|
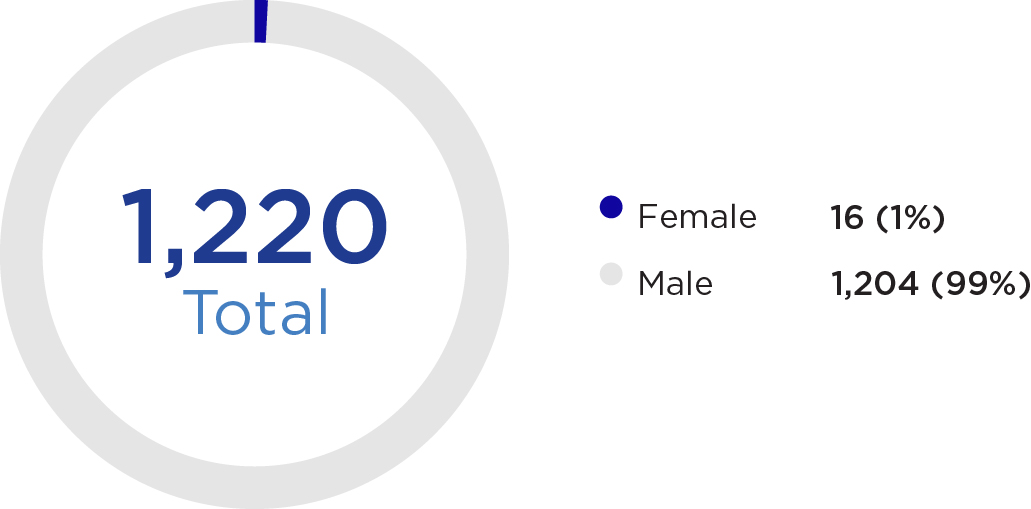 |
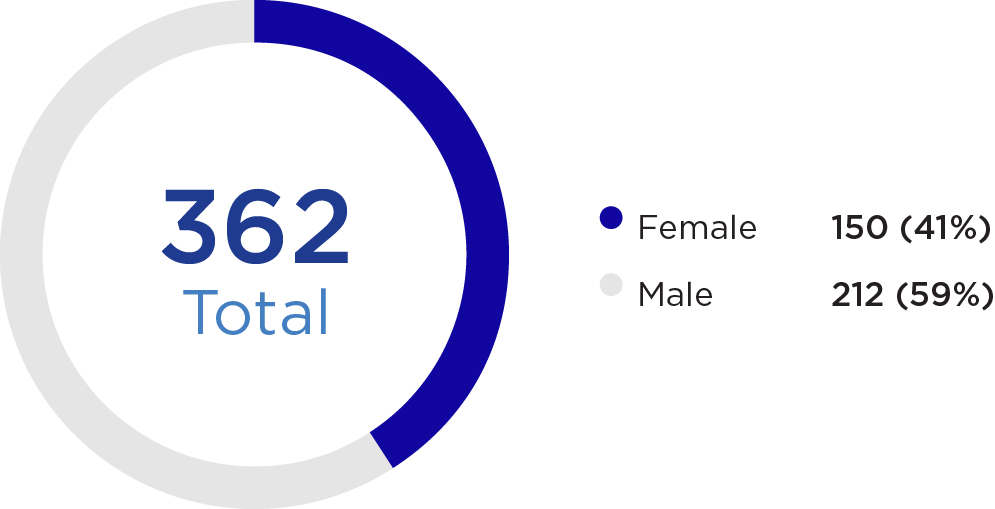 |
TRAINING & DEVELOPMENT
We are committed to building a workplace that fosters
equitable growth opportunities and encourages human
capital and career development for all employees. We offer
several development programs and trainings to promote
the professional growth of employees, including our
existing Educational Assistance Program that offers tuition
reimbursement for advanced training in an employee’s field
of focus or a field that facilitates promotion opportunities.
In 2023, the Group also piloted a new Leadership Impact
Training (“LIT”) program for 40 managers across the
organization. The LIT is a Franklin Covey facilitated program
which includes a 360° feedback assessment that will drive a
personalized leadership development program for each
participant to better prepare participants for expanded
future leadership roles at Diversified. Based on overwhelming
positive feedback on the program, the Group intends to
continue this leadership program in 2024 and to introduce a
new LinkedIn Learning development program for
approximately 500 employees which also includes
personalized professional development curriculums.
TALENT ACQUISITION & RETENTION
Attracting and retaining talented and diverse staff is key to
our success as a business, and we remain focused on
providing attractive jobs with competitive salaries.
including hiring locally to build our long-term pipeline of
talent. In 2023, most of our new hires were from the local
communities in which we operate. Our commitment to local
hiring is indicative of our larger dedication to supporting
economic development in the areas in which we work.
Further, our commitment to hiring a diverse workforce was
bolstered this year with three unconscious bias training
programs undertaken by 350+ managers and leaders to
help them recognize potential bias present during the
interview, recruiting and promotion processes.
In addition to providing development programs and
trainings to promote career development for existing
employees, our hiring efforts also include utilizing our
summer internship and scholarship programs as a potential
employment pipeline for diverse candidates. We were
pleased to expand our internship program this year to
include 18 interns, surpassing our 2023 goal of hiring 15
interns. These interns included 15 traditional summer interns
who worked in various departments within the Group while
the other three interns were part of a local community
college’s workforce development initiative that allows
students to take technical courses toward a degree while
gaining paid work experience in their field of study.
Our total corporate turnover rate in 2023 was 17.1%, a slight
decrease over the prior year’s turnover of 17.6%.
Our Communities
SOCIO-ECONOMIC IMPACT
Diversified assumes a vital role in supporting communities
across our 10-state operational footprint. By providing our
communities with employment opportunities underpinned
by competitive salaries and excellent benefits, state and
local tax revenues, royalty payments, and other direct and
indirect investments, we contribute significantly to the
economies of these states and, in doing so, positively
impact the communities where we operate.
Since 2021, we have commissioned an independent third-
party to conduct an analysis on the collective direct and
indirect economic impact we have across our 10-state
footprint. The analysis leverages financial and other data
from across our operations to assess the net impact we
have at the local, state and national level, and allows us to
illustrate the value of our contributions to stakeholders and
other interested parties. In the last year alone, for example,
we have contributed more than one billion dollars to the
U.S. GDP when considering both the direct and ancillary
impacts of our operations.
For example, in calendar year 2023, we provided more than
$500 million in ancillary labor income and generated more
than 6,300 ancillary jobs. These ancillary jobs, when
coupled with the ~1,600 employees we had at year-end
2023, highlight Diversified’s total employment impact of
nearly 8,000 jobs during the year. Year-over-year
operational expenditures across our footprint also
increased, but more substantially in states like Texas where
we grew through acquisition in 2023, therefore leading to
significant increases in economic benefit through job
creation within that state.
Beyond these economic benefits, employees across our
states continue to contribute to their communities through
volunteerism and donations, and Diversified is committed
to supporting these efforts.
COMMUNITY OUTREACH AND ENGAGEMENT
We are privileged to live and work in the 10 states across
our operational footprint. We believe with that privilege
and social license to operate comes a responsibility to
support those very communities in which we live and work,
and we recognize the long-lasting positive impact we can
have on both our communities and our business by
giving back.
Through our Community Giving and Engagement program,
we support organizations that have a positive, direct
impact on our communities. During 2023, through our grant
program and other corporate initiatives, we contributed
$2.1 million to more than 120 different charitable, education
related, and community and stakeholder engagement and
outreach organizations, including significant contributions
in geographic regions with large percentages of diverse
and/or socio-economically disadvantaged populations. Our
program is established around three main focus areas and
with the ultimate goal to support community initiatives that
fall under one or more of these areas: (1) community
enrichment, (2) education and workforce development and
(3) the environment. During 2023, our financial and human
capital supported organizations that included childhood
education, with emphasis on STEM (science, technology,
engineering and math), secondary and higher education,
children and adult physical and mental health and wellness,
environmental stewardship and biodiversity, fine arts for
children, food banks and meal programs, military and
veteran support groups, community and volunteer first
responders, and local infrastructure.
In addition to supporting employee volunteerism with these
and other deserving organizations, in 2023 we officially
launched the dollar-to-dollar matching gift program,
providing a company match on employee contributions up
to $1,500 per employee per year, where we matched
nearly $100 thousand in donations from employees during
the year.

Section 172 Companies Act Statement
In compliance with sections 172
(‘Section 172”) and 414CZA of the UK
Companies Act, the Board makes the
following statement in relation to the year
ended December 31, 2023:
Our stakeholders are the many individuals and
organizations that are affected by our operations and with
whom we seek to proactively and positively engage on a
regular basis. We strive to maintain productive, mutually
beneficial relationships with each stakeholder group by
treating all stakeholders with fairness and respect and by
providing timely and effective responses and information.
We maintain several communication methods that afford
two-way engagement with our stakeholder groups,
including personal contact via face-to-face or telephone
conversation, email exchange, company reports, press
releases, investor presentations or conference participation
and other company engagement.
As the owner and operator of long-life assets, we naturally
make decisions that consider the long-term success of
Diversified and value creation for our stakeholders.
Engaging with our stakeholders informs our decision-
making, including consideration of our long-term strategic
objectives and the activities that support these aims, such
as merger and acquisition diligence and the management of
climate risk.
The following table provides a summary of stakeholder
engagements from 2023.
OUR STAKEHOLDERS
 |
Employees |
Action and Engagement
Our CEO and other executive management periodically
conduct town hall meetings and field visits to personally
and directly engage employees and to provide
opportunities for employees to have direct management
engagement. Our Board’s Non-Executive Director
Employee Representative, Sandra M. Stash, also
periodically engages with the workforce to receive
employee feedback on our business strategy, corporate
culture and remuneration policies, and shares this
feedback with the Board. The valuable feedback from
these meetings, along with that resulting from our
updated corporate-wide Employee Experience Survey, is
used to strengthen future employee engagement
and initiatives. We also regularly conduct new hire
surveys regarding the onboarding process and exit
interviews, both important tools to further improve
employee experiences.
|
We know our employees are our greatest asset and
therefore essential to our success and growth. We
recognize the need for a skilled and committed workforce,
with a diverse range of experience and perspectives, and
we value that diversity and the contribution it affords.
Key Areas of Focus
—Incident management
—Employee, driver and process safety
—Diversity and equal opportunity
—Employee development
—Workplace culture
| ||
 |
Communities |
Action and Engagement
Through our formalized Community Giving and
Engagement Program and other corporate initiatives,
we provided approximately $2.1 million in financial
support to numerous organizations, including adult
and children’s health and well-being programs, local
food banks, secondary and higher educational
programs and initiatives, and municipal services
throughout our 10-state footprint. We were especially
pleased to support children’s initiatives which included
purchasing and distributing, for the third consecutive
year, more than 1,200 winter coats in the Central
Region through Operation Warm, and participating in
the U.S. Marine Corp Reserve Toys-for-Tots Christmas
gift program. We also supported the purchase of
back-to-school supplies for elementary classrooms
across our footprint and separately collected and
donated more than 4,200 books to local schools and
libraries. Further, we supported U.S. veteran-focused
programs that seek to promote mental health healing
and wellness among combat-wounded veterans or
those suffering with post-traumatic stress disorder.
|
We actively seek to support sustainable socio-economic
development in the communities in which we live and work
and aim to minimize any potential negative impacts from
our operations.
From personal and socio-economic investment to strategic
academic and educational support, our employees engage
and serve their local communities through effective
partnerships that make a real difference.
Key Areas of Focus
—Incident management
—Effective grievance mechanisms
—Environmental protection
—Socio-economic investment and outreach
—Local hiring
| ||
 |
Land and Mineral Owners |
Action and Engagement
During the year, our employees responded to nearly 34
thousand inquiries from our land and mineral owners
through our in-house call center and recorded ~800
personal visits with landowners. We also distributed
approximately $237 million in royalty payments
during 2023.
|
We seek to develop and maintain trusted relationships with
our land and mineral owners with the recognition that these
relationships are key to our business philosophy and ability
to achieve our operational goals.
Key Areas of Focus
—Royalty payments
—Incident management
—Effective grievance mechanisms
—Environmental protection
| ||
 |
Equity and Debt Investors |
Action and Engagement
We regularly provide financial, operational and other
sustainability performance updates to our equity and debt
investors. These updates may be in the form of investor
relations presentations, press releases, website updates,
or direct calls and meetings, inclusive of the CEO, CFO,
COO, SVP-Investor Relations, SVP-Sustainability, SVP-
EHS and/or Board Chairman, as applicable. The Annual
General Meeting (“AGM”) also provides an opportunity for
all shareholders to engage with the Board and
Executive Management.
Our increasing participation in energy conferences,
industry events and non-deal roadshows has provided
added opportunities for discussions with current and
potential Credit Facility lenders and ABS investors
particularly interested in our sustainability and emissions
reductions strategies, activities and results. Reflective of
that interest by ABS investors and our commitment to
climate and operating targets, our recent ABS
transactions, inclusive of our sustainability-linked Credit
Facility, have included interest rate impacts tied to certain
of these sustainability targets.
|
We actively engage with our capital market partners,
financial institutions and rating agencies to support a full
understanding of our business and progress against our
strategic priorities.
Key Areas of Focus
—Emissions reductions
—Climate risk and energy transition
—Incident management
—Risk management
—Corporate Governance
—Financial stability
—Access to funding
| ||
 |
Governments and Regulators |
Action and Engagement
Executive and operational management engage with
federal, state and local regulators to address legislative,
regulatory and operational matters important to our
business and our industry. With risk identification and
protection of the local environment and biodiversity in
mind, we proactively and fully engage all applicable
regulatory agencies before commencing a project to
ensure transparent dialogue during the completion and
approval of applicable environmental assessments and
related actions.
We also proactively and transparently engage with
regulatory agencies throughout the year to keep them
appraised of our operational and well retirement activities
and to provide objective and measurable progress
indicators. Our Next LVL well retirement subsidiary
supports company efforts to exceed annual state
plugging requirements while also supporting the well
retirement needs of other oil and gas operators in the
Appalachia Basin as well as the states in their respective
federal orphan well retirement programs.
|
We seek to develop and maintain positive relationships and
regular dialogue with various stakeholder groups within our
federal, state and local governments.
Key Areas of Focus
—Legal compliance
—Tax payments to governments
—Safe and efficient asset retirement
—Emissions reductions
—Risk management
—Environmental protection
| ||
 |
Suppliers and Customers |
Action and Engagement
We use local suppliers and vendors in each of the states
in which we conduct our operations. We engage the
expertise and capability of a leading supply chain risk
management firm to continuously screen and monitor
contractor safety performance and compliance through
stringent operating guidelines.
With a network of approximately 700 suppliers, this
real-time monitoring helps to ensure our suppliers are
providing us with the necessary product and service
quality to meet the expectations of our stakeholders and
support ongoing agreements with those suppliers who
satisfy our safety thresholds.
We delivered 821 MMcfepd in 2023 with no cited process
and pipeline safety events or associated civil penalties.
We continue to use our pipeline awareness programs to
provide relevant information and education to those who
interact with our assets or employees.
|
Our production is essential to supporting modern life. We
work hard to deliver environmentally-focused, responsibly
produced natural gas, NGLs and oil that satisfy regulatory
requirements and meet the energy demands of our local
communities and customers while supporting our
climate goals.
We strive to develop strong relationships with our suppliers
that are built on trust, transparency and quality products
and services.
Key Areas of Focus
—Incident management
—Process safety
—Procurement management
—Access to funding
| ||
 |
Joint Operating Partners |
Action and Engagement
We fulfill our responsibility as operator by responsibly
managing the wells, ensuring payment of related
expenses, and distributing applicable revenues and
royalties from the wells’ commodity sales.
|
As operator, we work on behalf of our joint operating
partners to safely and efficiently manage the assets and
deliver our products.
Key Areas of Focus
—Access to funding
—Risk management
—Employee and process safety
—Accident prevention
| ||
 |
Industry Associations |
Action and Engagement
Through our active participation and the sharing of
operating best practices, technical knowledge and
legislation updates, we believe that these associations
add value to our business, support our industry at large
and protect the interests of our stakeholders.
Collaborative engagements in these associations provide
us with a platform to help collectively advance the sector
and industry as a whole. Our leadership’s participation in
industry associations includes participation in national,
regional and state associations in West Virginia, Virginia,
Kentucky, Pennsylvania, Ohio, Oklahoma, Texas,
and Louisiana.
We are especially proud of employees’ involvement and
leadership roles in organizations like the Women’s Energy
Network of West Virginia which seeks to empower
women across the energy value chain and the recognition
of our efforts in receiving both the Industry Innovation
award (for use of innovative technologies in emissions
detection) and Individual Excellence award (for long-
standing, proven leadership in the industry) as conveyed
by the Virginia Department of Energy.
|
Recognizing the benefit of collective and collaborative
efforts among industry peers, we are actively involved in
leadership and other roles in industry associations within
the states in which we operate.
Key Areas of Focus
—Incident management
—Environmental protection
—Risk management
—Industry advocacy and leadership
—Accident prevention
—Employee and driver safety
—Landowner engagement
| ||
Non-Financial & Sustainability Information Statement
This section of the Strategic Report constitutes our Non-Financial & Sustainability Information Statement, produced to comply
with the Non-Financial & Sustainability Reporting Directive requirements from sections 414CA and 414CB of the UK Companies
Act 2006.
The table below sets out where relevant information can be found within this Annual Report & Form 20-F. Additional
information will be available in our Sustainability Report or on our website at www.div.energy. Our Policies can be found on
our website at www.div.energy.
Reporting Requirement |
Policies |
Reference within this
Annual Report & Form 20-F
|
Page |
Environmental Matters |
Code of Business Conduct & Ethics |
||
EHS |
|||
Climate |
|||
Business Partners |
|||
Biodiversity |
|||
Employees |
Employee Relations |
||
Anti-Bribery & Corruption |
|||
Compliance Hotline &
Whistleblowing
|
|||
Code of Business Conduct & Ethics |
|||
Human Rights |
|||
Securities Dealing |
|||
Human Rights |
Code of Business Conduct & Ethics |
||
Human Rights |
|||
Modern Slavery |
|||
Business Partners |
|||
Social Matters |
Code of Business Conduct & Ethics |
||
EHS |
|||
Human Rights |
|||
Tax |
|||
Anti-Corruption & Anti-Bribery |
Anti-Bribery & Corruption |
||
Compliance Hotline &
Whistleblowing
|
|||
Business Model |
Code of Business Conduct & Ethics |
||
Principal Risks and Uncertainties |
Compliance Hotline &
Whistleblowing
|
||
Non-Financial KPIs |
Code of Business Conduct & Ethics |
||
EHS |
|||
Climate |
|||
Reporting Requirement |
Reference within this Annual Report & Form 20-F
|
Page |
Board oversight of climate-related risks and
opportunities.
|
||
Identifying, assessing and managing climate-related risks
and opportunities.
|
||
How processes for identifying, assessing and managing
climate-related risks are integrated into the overall risk
management process.
|
||
Principal climate-related risk and opportunities arising in
connection with operations.
|
||
Time periods by reference to which risks and
opportunities are assessed.
|
||
Actual and potential impacts of the principal climate-
related risks and opportunities on the business model and
strategy.
|
||
Analysis of the resilience of the business model and
strategy, taking into consideration different climate-
related scenarios.
|
||
Targets used by the organization to manage climate-
related risks and to realize climate-related opportunities
and of performance against those targets.
|
||
KPIs used to assess progress against targets used to
manage climate-related risks and realize climate-related
opportunities and of the calculations on which those KPIs
are based.
|

A Message from Our
Chief Financial Officer
“ |
|||
I am very pleased to report that 2023
was an outstanding year for Diversified,
with record financial results and solid
operational performance from our
assets.
|
Financial Review
Before penning my first CFO letter after many years, I took
a few moments to go back through all of Diversified’s
annual reports since going public in 2017. It was satisfying,
though not surprising, to see the common threads of our
firm's strategy and values woven through those pages-
reliable production, stable cash flows, durable margins and
consistent shareholder distributions. As I look ahead, I
intend to reinforce a disciplined financial approach to our
business that will provide flexibility and resiliency
throughout commodity price cycles. Additionally, we will be
diligent in expense management while looking to drive
further capital efficiency improvements through
the business.
I am very pleased to report that 2023 was an outstanding
year for Diversified, with record financial results and solid
operational performance from our assets. Adjusted EBITDA
was above expectations and reached a record level for the
Group. An improvement of approximately 3% in our total
per unit operating expense helped to deliver margins that
were approximately 50% or better for the sixth straight
year, with 2023 coming in at approximately 52%.
2023 began with an accretive acquisition in the Central
Region, allowing the opportunity to capture operational
synergies while increasing exposure to the premium Gulf
Coast markets pricing and the long-term demand pull from
the growth in LNG markets.
Additionally, we commenced trading on the New York
Stock Exchange (NYSE), an important strategic milestone
for the Company. The U.S. listing will enhance trading
liquidity and facilitate increased ownership from U.S.
domestic equity funds.
We ended the year with a highly successful transaction that
was both value-enhancing and deleveraging. This
approximately $192 million asset sale resulted in an
approximate 10% reduction in net debt.
Moreover, we have once again demonstrated that our
disciplined acquisition strategy allows us to be selective
and thoughtful in our approach but unwavering in our quest
to extract value when the opportunity affords itself.
You will find the full financial results of our operations on
the following pages, which I hope will be helpful as you
review our performance.
We expect 2024 to be a year of transition for both the
world and Diversified. Macroeconomic and geopolitical
developments remain a concern in the short term, with
limited visibility on how inflation, as well as other
disruptions, might impact energy prices, particularly natural
gas prices. We move into 2024 in a sound financial position,
with a focus on further reducing our debt, investing in
accretive acquisitions, and providing returns to our
shareholders. It is shaping up to be another exceptional
year for Diversified, one in which we will focus on playing
offense and being opportunistic, as we have historically
found this commodity price backdrop to provide a
tremendous opportunity to creatively grow our business
and ultimately create value for shareholders.
I want to thank our shareholders, debt holders, banks,
analysts, rating agencies, insurers, business partners, and
key advisors for their continued trust in Diversified and their
ongoing support to execute the proper measures to
strengthen our company and be in the best position to take
advantage of the opportunities we see ahead. I also want to
thank all of our dedicated, caring employees that are
focused on the safe production of American energy and are
also focused on continuing to deliver superb results for
their team members and our shareholders.

Bradley G. Gray
President & Chief Financial Officer
March 19, 2024
OPERATING RESULTS
Key Factors Affecting Our Performance
Our financial condition and results of operations have been,
and will continue to be, affected by a number of important
factors, including the following:
Strategic Acquisitions
We have made, and intend to continue to make, strategic
acquisitions to solidify our current market presence and
expand into new markets. We have made the following
business combinations or asset acquisitions for a total
aggregate consideration of $1.1 billion during the years
ended December 31, 2023, 2022 and 2021, comprised of:
—March 2023: The Tanos II Assets Acquisition, in which we
acquired certain upstream assets and related
infrastructure in the Central Region;
—September 2022: The ConocoPhillips Assets Acquisition,
in which we acquired certain upstream assets and related
gathering infrastructure in the Central Region;
—July 2022: Certain plugging infrastructure in the
Appalachian Region;
—May 2022: Certain plugging infrastructure in the
Appalachian Region;
—April 2022:
—The East Texas Assets Acquisition, in which we
acquired working interests in certain upstream assets
and related facilities within the Central Region from a
private seller, in conjunction with Oaktree;
—Certain midstream assets, inclusive of a processing
facility, in the Central Region that was contiguous to
our East Texas assets;
—February 2022: Certain plugging infrastructure in the
Appalachian Region;
—December 2021: The Tapstone Acquisition, where we
acquired working interests in certain upstream assets,
field infrastructure, equipment and facilities within the
Central Region in conjunction with Oaktree;
—August 2021: The Tanos Acquisition, in which we
acquired working interests in certain upstream assets
field infrastructure, equipment and facilities in the
Central Region in conjunction with Oaktree;
—July 2021: The Blackbeard Acquisition, in which we
acquired certain upstream assets and related gathering
infrastructure in the Central Region;
—May 2021: The Indigo Acquisition, in which we acquired
certain upstream assets and related gathering
infrastructure in the Central Region;
Our strategic acquisitions may affect the comparability of
our financial results with prior and subsequent periods. We
intend to continue to selectively pursue strategic
acquisitions to further strengthen our competitiveness. We
will evaluate and execute opportunities that complement
and scale our business, optimize our profitability, help us
expand into adjacent markets and add new capabilities to
our business. The integration of acquisitions also requires
dedication of substantial time and resources of
management, and we may never fully realize synergies and
other benefits that we expect.
Recent Developments
On March 19, 2024 we announced we entered into a
conditional agreement to acquire Oaktree’s proportionate
interest in the previously announced Indigo, Tanos III, East
Texas and Tapstone acquisitions for an estimated gross
purchase price of $410 million before customary purchase
price adjustments. The transaction is expected to be funded
through a combination of existing and expanded liquidity,
the assumption of Oaktree’s proportionate debt of
approximately $120 million associated with the ABS VI
amortizing note and approximately $90 million in deferred
cash payments to Oaktree. Additional liquidity for the
transaction may be generated from non-core asset sales
and the potential issuance of a private placement preferred
instrument.
Segment Reporting
We are an independent owner and operator of producing
natural gas and oil wells with properties located in the
states of Tennessee, Kentucky, Virginia, West Virginia, Ohio,
Pennsylvania, Oklahoma, Texas and Louisiana. Our strategy
is to acquire long-life producing assets, efficiently operate
those assets to maximize cash flow, and then to retire
assets safely and responsibly at the end of their useful life.
Our assets consist of natural gas and oil wells, pipelines and
a network of gathering lines and compression facilities that
are complementary to our core assets. We acquire and
manage these assets in a complementary fashion to
vertically integrate and improve margins rather than
managing them as separate operations. Accordingly, when
determining operating segments under IFRS 8, we
identified one operating segment that produces and
transports natural gas, NGLs and oil in the United States.
Refer to Note 2 in the Notes to the Group Financial
Statements for a description of our segment reporting.
RESULTS OF OPERATIONS
Please refer to the APMs section within this Annual Report & Form 20-F for information on how these metrics are calculated
and reconciled to IFRS measures. Discussion related to prior period results can be found in the Results of Operations section of
our 2022 Annual Report on our website at https://ir.div.energy/reports-announcements.
Year Ended |
||||
December 31, 2023 |
December 31, 2022 |
Change |
% Change |
|
Net production |
||||
Natural gas (MMcf) |
256,378 |
255,597 |
781 |
—% |
NGLs (MBbls) |
5,832 |
5,200 |
632 |
12% |
Oil (MBbls) |
1,377 |
1,554 |
(177) |
(11%) |
Total production (MMcfe) |
299,632 |
296,121 |
3,511 |
1% |
Average daily production (MMcfepd) |
821 |
811 |
10 |
1% |
% Natural gas (Mcfe basis) |
86% |
86% |
||
Average realized sales price
(excluding impact of derivatives settled in cash)
|
||||
Natural gas (Mcf) |
$2.17 |
$6.04 |
$(3.87) |
(64%) |
NGLs (Bbls) |
24.23 |
36.29 |
(12.06) |
(33%) |
Oil (Bbls) |
75.46 |
89.85 |
(14.39) |
(16%) |
Total (Mcfe) |
$2.68 |
$6.33 |
$(3.65) |
(58%) |
Average realized sales price
(including impact of derivatives settled in cash)
|
||||
Natural gas (Mcf) |
$2.86 |
$2.98 |
$(0.12) |
(4%) |
NGLs (Bbls) |
26.05 |
19.84 |
6.21 |
31% |
Oil (Bbls) |
68.44 |
72.00 |
(3.56) |
(5%) |
Total (Mcfe) |
$3.27 |
$3.30 |
$(0.03) |
(1%) |
Revenue (in thousands) |
||||
Natural gas |
$557,167 |
$1,544,658 |
$(987,491) |
(64%) |
NGLs |
141,321 |
188,733 |
(47,412) |
(25%) |
Oil |
103,911 |
139,620 |
(35,709) |
(26%) |
Total commodity revenue |
$802,399 |
$1,873,011 |
$(1,070,612) |
(57%) |
Midstream revenue |
30,565 |
32,798 |
(2,233) |
(7%) |
Other revenue |
35,299 |
13,540 |
21,759 |
161% |
Total revenue |
$868,263 |
$1,919,349 |
$(1,051,086) |
(55%) |
Gain (loss) on derivative settlements
(in thousands)
|
||||
Natural gas |
$177,139 |
$(782,525) |
$959,664 |
(123%) |
NGLs |
10,594 |
(85,549) |
96,143 |
(112%) |
Oil |
(9,669) |
(27,728) |
18,059 |
(65%) |
Net gain (loss) on commodity derivative
settlements(a)
|
$178,064 |
$(895,802) |
$1,073,866 |
(120%) |
Total revenue, inclusive of settled hedges |
$1,046,327 |
$1,023,547 |
$22,780 |
2% |
Year Ended |
||||
December 31, 2023 |
December 31, 2022 |
Change |
% Change |
|
Per Mcfe Metrics |
||||
Average realized sales price |
||||
(including impact of derivatives settled in cash) |
$3.27 |
$3.30 |
$(0.03) |
(1%) |
Midstream and other revenue |
0.22 |
0.16 |
0.06 |
38% |
LOE |
(0.71) |
(0.62) |
(0.09) |
15% |
Midstream operating expense |
(0.23) |
(0.24) |
0.01 |
(4%) |
Employees, administrative costs and professional
services
|
(0.26) |
(0.26) |
— |
—% |
Recurring allowance for credit losses |
(0.03) |
— |
(0.03) |
(100%) |
Production taxes |
(0.21) |
(0.25) |
0.04 |
(16%) |
Transportation expense |
(0.32) |
(0.40) |
0.08 |
(20%) |
Proceeds received from leasehold sales |
0.08 |
0.01 |
0.07 |
700% |
Adjusted EBITDA per Mcfe |
$1.81 |
$1.70 |
$0.11 |
6% |
Adjusted EBITDA Margin |
52% |
49% |
||
Other financial metrics (in thousands)
|
||||
Adjusted EBITDA |
$542,794 |
$502,954 |
$39,840 |
8% |
Operating profit (loss) |
$1,161,051 |
$(671,403) |
$1,832,454 |
(273%) |
Net income (loss) |
$759,701 |
$(620,598) |
$1,380,299 |
(222%) |
Year Ended |
||||
December 31, 2022 |
December 31, 2021 |
Change |
% Change |
|
Net production |
||||
Natural gas (MMcf) |
255,597 |
234,643 |
20,954 |
9% |
NGLs (MBbls) |
5,200 |
3,558 |
1,642 |
46% |
Oil (MBbls) |
1,554 |
592 |
962 |
163% |
Total production (MMcfe) |
296,121 |
259,543 |
36,578 |
14% |
Average daily production (MMcfepd) |
811 |
711 |
100 |
14% |
% Natural gas (Mcfe basis) |
86% |
90% |
||
Average realized sales price
(excluding impact of derivatives settled in cash)
|
||||
Natural gas (Mcf) |
$6.04 |
$3.49 |
$2.55 |
73% |
NGLs (Bbls) |
36.29 |
32.53 |
3.76 |
12% |
Oil (Bbls) |
89.85 |
65.26 |
24.59 |
38% |
Total (Mcfe) |
$6.33 |
$3.75 |
$2.58 |
69% |
Average realized sales price
(including impact of derivatives settled in cash)
|
||||
Natural gas (Mcf) |
$2.98 |
$2.36 |
$0.62 |
26% |
NGLs (Bbls) |
19.84 |
15.52 |
4.32 |
28% |
Oil (Bbls) |
72.00 |
71.68 |
0.32 |
—% |
Total (Mcfe) |
$3.30 |
$2.51 |
$0.79 |
31% |
Revenue (in thousands) |
||||
Natural gas |
$1,544,658 |
$818,726 |
$725,932 |
89% |
NGLs |
188,733 |
115,747 |
72,986 |
63% |
Oil |
139,620 |
38,634 |
100,986 |
261% |
Total commodity revenue |
$1,873,011 |
$973,107 |
$899,904 |
92% |
Midstream revenue |
32,798 |
31,988 |
810 |
3% |
Other revenue |
13,540 |
2,466 |
11,074 |
449% |
Total revenue |
$1,919,349 |
$1,007,561 |
$911,788 |
90% |
Year Ended |
||||
December 31, 2022 |
December 31, 2021 |
Change |
% Change |
|
Gain (loss) on derivative settlements
(in thousands)
|
||||
Natural gas |
$(782,525) |
$(263,929) |
$(518,596) |
196% |
NGLs |
(85,549) |
(60,530) |
(25,019) |
41% |
Oil |
(27,728) |
3,803 |
(31,531) |
(829%) |
Net gain (loss) on commodity derivative
settlements(a)
|
$(895,802) |
$(320,656) |
$(575,146) |
179% |
Total revenue, inclusive of settled hedges |
$1,023,547 |
$686,905 |
$336,642 |
49% |
Per Mcfe Metrics |
||||
Average realized sales price |
||||
(including impact of derivatives settled in cash) |
$3.30 |
$2.51 |
$0.79 |
31% |
Midstream and other revenue |
0.16 |
0.13 |
0.03 |
23% |
LOE |
(0.62) |
(0.46) |
(0.16) |
35% |
Midstream operating expense |
(0.24) |
(0.23) |
(0.01) |
4% |
Employees, administrative costs and professional
services
|
(0.26) |
(0.22) |
(0.04) |
18% |
Recurring allowance for credit losses |
— |
0.02 |
(0.02) |
(100%) |
Production taxes |
(0.25) |
(0.12) |
(0.13) |
108% |
Transportation expense |
(0.40) |
(0.31) |
(0.09) |
29% |
Proceeds received from leasehold sales |
0.01 |
— |
0.01 |
100% |
Adjusted EBITDA per Mcfe |
$1.70 |
$1.32 |
$0.38 |
29% |
Adjusted EBITDA Margin |
49% |
50% |
||
Other financial metrics (in thousands) |
||||
Adjusted EBITDA |
$502,954 |
$343,145 |
$159,809 |
47% |
Operating profit (loss) |
$(671,403) |
$(467,064) |
$(204,339) |
44% |
Net income (loss) |
$(620,598) |
$(325,206) |
$(295,392) |
91% |
(a)Net gain (loss) on commodity derivative settlements represents cash (paid) or received on commodity derivative contracts. This excludes
settlements on foreign currency and interest rate derivatives as well as the gain (loss) on fair value adjustments for unsettled financial
instruments for each of the periods presented.
FORWARD-LOOKING STATEMENT
This Annual Report & Form 20-F contains forward-looking statements that can be identified by the following terminology,
including the terms “may,” “might,” “will,” “could,” “would,” “should,” “expect,” “plan,” “anticipate,” “intend,” “seek,” “believe,”
“estimate,” “predict,” “potential,” “continue,” “contemplate,” “possible,” or the negative of these terms or other variations or
comparable terminology, or by discussions of strategy, plans, objectives, goals, future events or intentions. These forward-
looking statements include all matters that are not historical facts. They appear in a number of places throughout this Annual
Report & Form 20-F and include, but are not limited to, statements regarding our intentions, beliefs or current expectations
concerning, among other things, our results of operations, financial positions, liquidity, prospects, growth, strategies and the
natural gas and oil industry. By their nature, forward-looking statements involve risk and uncertainty because they relate to
future events and circumstances.
Forward-looking statements are not guarantees of future performance and the actual results of our operations, financial
position and liquidity, and the development of the markets and the industry in which we operate, may differ materially from
those described in, or suggested by, the forward-looking statements contained in this Annual Report & Form 20-F. In addition,
even if the results of operations, financial position and liquidity, and the development of the markets and the industry in which
we operate are consistent with the forward-looking statements contained in this Annual Report & Form 20-F, those results or
developments may not be indicative of results or developments in subsequent periods. A number of factors could cause
results and developments to differ materially from those expressed or implied by the forward-looking statements including,
without limitation, general economic and business conditions, industry trends, competition, commodity prices, changes in
regulation, currency fluctuations, our ability to recover our reserves, changes in our business strategy, political and economic
uncertainty.
Forward-looking statements may, and often do, differ materially from actual results. Any forward-looking statements in this
Annual Report & Form 20-F speak only as of the date of this Annual Report & Form 20-F, reflect our current view with respect
to future events and are subject to risks relating to future events and other risks, uncertainties and assumptions relating to our
operations, results of operations, growth strategy and liquidity. Investors should specifically consider the factors identified in
this Annual Report & Form 20-F which could cause actual results to differ before making an investment decision. Subject to
the requirements of the Prospectus Rules, the Disclosure and Transparency Rules and the Listing Rules or applicable law, we
explicitly disclaim any obligation or undertaking publicly to release the result of any revisions to any forward-looking
statements in this Annual Report & Form 20-F that may occur due to any change in our expectations or to reflect events or
circumstances after the date of this Annual Report & Form 20-F.
PRODUCTION, REVENUE AND HEDGING
Total revenue in the year ended December 31, 2023 of $868 million decreased 55% from $1,919 million reported for the year
ended December 31, 2022, primarily due to a 58% decrease in the average realized sales price slightly offset by 1% higher
production. Including commodity hedge settlement gains of $178 million and losses of $896 million in 2023 and 2022,
respectively, total revenue, inclusive of settled hedges, increased by 2% to $1,046 million in 2023 from $1,024 million in 2022.
During the current year’s low commodity price environment, we have benefited from our ability to opportunistically elevate
our hedge floor during the elevated commodity market cycle in 2022. This enhancement in our weighted average hedge floor
helped us minimize the impact of the suppressed commodity pricing environment in 2023, during which we realized a
decrease in total commodity revenue of just $8 million, inclusive of settled hedges. Offsetting this slight decrease was an
increase of $12 million in total commodity revenue, inclusive of settled hedges, generated through increases in production. We
sold 299,632 MMcfe in 2023 versus 296,121 MMcfe in 2022. This increase in volumes sold was due to the March 2023 Tanos II
acquisition as well as the integration of a full year of production from the East Texas and ConocoPhillips acquisitions which
occurred in April and September of 2022, respectively.
The following table summarizes average commodity prices for the periods presented with Henry Hub on a per Mcf basis and
Mont Belvieu and WTI on a per Bbl basis:
Year Ended |
||||
December 31, 2023 |
December 31, 2022 |
$ Change |
% Change |
|
Henry Hub |
$2.74 |
$6.62 |
$(3.88) |
(59%) |
Mont Belvieu |
34.11 |
51.04 |
(16.93) |
(33%) |
WTI |
77.62 |
93.53 |
(15.91) |
(17%) |
Year Ended |
||||
December 31, 2022 |
December 31, 2021 |
$ Change |
% Change |
|
Henry Hub |
$6.62 |
$3.84 |
$2.78 |
72% |
Mont Belvieu |
51.04 |
47.49 |
3.55 |
7% |
WTI |
93.53 |
68.26 |
25.27 |
37% |
Refer to Note 5 in the Notes to the Group Financial Statements for additional information regarding acquisitions.
COMMODITY REVENUE
The following table reconciles the change in commodity revenue (excluding the impact of hedges settled in cash) for the year
ended December 31, 2023 by reflecting the effect of changes in volume and in the underlying prices:
(In thousands) |
Natural Gas |
NGLs |
Oil |
Total |
Commodity revenue for the year ended December 31, 2021 |
$818,726 |
$115,747 |
$38,634 |
$973,107 |
Volume increase (decrease) |
73,129 |
53,414 |
62,780 |
189,323 |
Price increase (decrease) |
652,803 |
19,572 |
38,206 |
710,581 |
Net increase (decrease) |
725,932 |
72,986 |
100,986 |
899,904 |
Commodity revenue for the year ended December 31, 2022 |
$1,544,658 |
$188,733 |
$139,620 |
$1,873,011 |
Volume increase (decrease) |
4,717 |
22,935 |
(15,903) |
11,749 |
Price increase (decrease) |
(992,208) |
(70,347) |
(19,806) |
(1,082,361) |
Net increase (decrease) |
(987,491) |
(47,412) |
(35,709) |
(1,070,612) |
Commodity revenue for the year ended December 31, 2023 |
$557,167 |
$141,321 |
$103,911 |
$802,399 |
To manage our cash flows in a volatile commodity price environment and as required by our SPV-level asset-backed securities,
we utilize derivative contracts which allow us to fix the sales prices at a per unit level for approximately 83% of our production
to mitigate commodity risk. The tables below set forth the commodity hedge impact on commodity revenue, excluding and
including cash received for commodity hedge settlements:
(In thousands, except per
unit data)
|
Year Ended December 31, 2023 |
|||||||
Natural Gas |
NGLs |
Oil |
Total Commodity |
|||||
Revenue |
Realized $ |
Revenue |
Realized $ |
Revenue |
Realized $ |
Revenue |
Realized $ |
|
per Mcf |
per Bbl |
per Bbl |
per Mcfe |
|||||
Excluding hedge impact |
$557,167 |
$2.17 |
$141,321 |
$24.23 |
$103,911 |
$75.46 |
$802,399 |
$2.68 |
Commodity hedge impact |
177,139 |
0.69 |
10,594 |
1.82 |
(9,669) |
(7.02) |
178,064 |
0.59 |
Including hedge impact |
$734,306 |
$2.86 |
$151,915 |
$26.05 |
$94,242 |
$68.44 |
$980,463 |
$3.27 |
(In thousands, except per
unit data)
|
Year Ended December 31, 2022 |
|||||||
Natural Gas |
NGLs |
Oil |
Total Commodity |
|||||
Revenue |
Realized $ |
Revenue |
Realized $ |
Revenue |
Realized $ |
Revenue |
Realized $ |
|
per Mcf |
per Bbl |
per Bbl |
per Mcfe |
|||||
Excluding hedge impact |
$1,544,658 |
$6.04 |
$188,733 |
$36.29 |
$139,620 |
$89.85 |
$1,873,011 |
$6.33 |
Commodity hedge impact |
(782,525) |
(3.06) |
(85,549) |
(16.45) |
(27,728) |
(17.85) |
(895,802) |
(3.03) |
Including hedge impact |
$762,133 |
$2.98 |
$103,184 |
$19.84 |
$111,892 |
$72.00 |
$977,209 |
$3.30 |
(In thousands, except per
unit data)
|
Year Ended December 31, 2021 |
|||||||
Natural Gas |
NGLs |
Oil |
Total Commodity |
|||||
Revenue |
Realized $ |
Revenue |
Realized $ |
Revenue |
Realized $ |
Revenue |
Realized $ |
|
per Mcf |
per Bbl |
per Bbl |
per Mcfe |
|||||
Excluding hedge impact |
$818,726 |
$3.49 |
$115,747 |
$32.53 |
$38,634 |
$65.26 |
$973,107 |
$3.75 |
Commodity hedge impact |
(263,929) |
(1.13) |
(60,530) |
(17.01) |
3,803 |
6.42 |
(320,656) |
(1.24) |
Including hedge impact |
$554,797 |
$2.36 |
$55,217 |
$15.52 |
$42,437 |
$71.68 |
$652,451 |
$2.51 |
Refer to Note 13 in the Notes to the Group Financial Statements for additional information regarding derivative
financial instruments.
EXPENSES
(In thousands, except per unit data) |
Year Ended |
|||||||
December
31, 2023
|
Per |
December
31, 2022
|
Per |
Total Change |
Per Mcfe Change |
|||
Per Mcfe |
Per Mcfe |
$ |
% |
$ |
% |
|||
LOE(a)
|
$213,078 |
$0.71 |
$182,817 |
$0.62 |
$30,261 |
17% |
$0.09 |
15% |
Production taxes(b)
|
61,474 |
0.21 |
73,849 |
0.25 |
(12,375) |
(17%) |
(0.04) |
(16%) |
Midstream operating expenses(c)
|
69,792 |
0.23 |
71,154 |
0.24 |
(1,362) |
(2%) |
(0.01) |
(4%) |
Transportation expenses(d)
|
96,218 |
0.32 |
118,073 |
0.40 |
(21,855) |
(19%) |
(0.08) |
(20%) |
Total operating expenses |
$440,562 |
$1.47 |
$445,893 |
$1.51 |
$(5,331) |
(1%) |
$(0.04) |
(3%) |
Employees, administrative costs
and professional services(e)
|
78,659 |
0.26 |
77,172 |
0.26 |
1,487 |
2% |
— |
—% |
Costs associated with acquisitions(f)
|
16,775 |
0.06 |
15,545 |
0.05 |
1,230 |
8% |
0.01 |
20% |
Other adjusting costs(g)
|
17,794 |
0.06 |
69,967 |
0.24 |
(52,173) |
(75%) |
(0.18) |
(75%) |
Non-cash equity compensation(h)
|
6,494 |
0.02 |
8,051 |
0.03 |
(1,557) |
(19%) |
(0.01) |
(33%) |
Total operating and G&A expenses |
$560,284 |
$1.87 |
$616,628 |
$2.09 |
$(56,344) |
(9%) |
$(0.22) |
(11%) |
Depreciation, depletion and
amortization
|
224,546 |
0.75 |
222,257 |
0.75 |
2,289 |
1% |
— |
—% |
Allowance for credit losses(i)
|
8,478 |
0.03 |
— |
— |
8,478 |
100% |
0.03 |
100% |
Total expenses |
$793,308 |
$2.65 |
$838,885 |
$2.84 |
$(45,577) |
(5%) |
$(0.19) |
(7%) |
(In thousands, except per unit
data)
|
Year Ended |
|||||||
December
31, 2022
|
Per |
December
31, 2021
|
Per |
Total Change |
Per Mcfe Change |
|||
Per Mcfe |
Per Mcfe |
$ |
% |
$ |
% |
|||
LOE(a)
|
$182,817 |
$0.62 |
$119,594 |
$0.46 |
$63,223 |
53% |
$0.16 |
35% |
Production taxes(b)
|
73,849 |
0.25 |
30,518 |
0.12 |
43,331 |
142% |
0.13 |
108% |
Midstream operating
expenses(c)
|
71,154 |
0.24 |
60,481 |
0.23 |
10,673 |
18% |
0.01 |
4% |
Transportation expenses(d)
|
118,073 |
0.40 |
80,620 |
0.31 |
37,453 |
46% |
0.09 |
29% |
Total operating expenses |
$445,893 |
$1.51 |
$291,213 |
$1.12 |
$154,680 |
53% |
$0.39 |
35% |
Employees, administrative
costs and professional
services(e)
|
77,172 |
0.26 |
56,812 |
0.22 |
20,360 |
36% |
0.04 |
18% |
Costs associated with
acquisitions(f)
|
15,545 |
0.05 |
27,743 |
0.11 |
(12,198) |
(44%) |
(0.06) |
(55%) |
Other adjusting costs(g)
|
69,967 |
0.24 |
10,371 |
0.04 |
59,596 |
575% |
0.20 |
500% |
Non-cash equity
compensation(h)
|
8,051 |
0.03 |
7,400 |
0.03 |
651 |
9% |
— |
—% |
Total operating and G&A
expenses
|
$616,628 |
$2.09 |
$393,539 |
$1.52 |
$223,089 |
57% |
$0.57 |
38% |
Depreciation, depletion and
amortization
|
222,257 |
0.75 |
167,644 |
0.65 |
54,613 |
33% |
0.10 |
15% |
Allowance for credit losses(i)
|
— |
— |
(4,265) |
(0.02) |
4,265 |
(100%) |
0.02 |
(100%) |
Total expenses |
$838,885 |
$2.84 |
$556,918 |
$2.15 |
$281,967 |
51% |
$0.69 |
32% |
(a)LOE includes costs incurred to maintain producing properties. Such costs include direct and contract labor, repairs and maintenance, water
hauling, compression, automobile, insurance, and materials and supplies expenses.
(b)Production taxes include severance and property taxes. Severance taxes are generally paid on produced natural gas, NGLs and oil
production at fixed rates established by federal, state or local taxing authorities. Property taxes are generally based on the taxing
jurisdictions’ valuation of the Group’s natural gas and oil properties and midstream assets.
(c)Midstream operating expenses are daily costs incurred to operate the Group’s owned midstream assets inclusive of employee and
benefit expenses.
(d)Transportation expenses are daily costs incurred from third-party systems to gather, process and transport the Group’s natural gas, NGLs and oil.
(e)Employees, administrative costs and professional services includes payroll and benefits for our administrative and corporate staff, costs of
maintaining administrative and corporate offices, costs of managing our production operations, franchise taxes, public company costs, fees
for audit and other professional services and legal compliance.
(f)We generally incur costs related to the integration of acquisitions, which will vary for each acquisition. For acquisitions considered to be a
business combination, these costs include transaction costs directly associated with a successful acquisition transaction. These costs also
include costs associated with transition service arrangements where we pay the seller of the acquired entity a fee to handle various G&A
functions until we have fully integrated the assets onto our systems. In addition, these costs include costs related to integrating IT systems
and consulting as well as internal workforce costs directly related to integrating acquisitions into our system.
(g)Other adjusting costs include items that affect the comparability of results or that are not indicative of trends in the ongoing business. These
costs consist of one time projects, contemplated transactions or financing arrangements, contract terminations, deal breakage and/or
sourcing costs for acquisitions, and unused firm transportation.
(h)Non-cash equity compensation reflects the expense recognition related to share-based compensation provided to certain key members of
the management team. Refer to Note 17 in the Notes to the Group Financial Statements for additional information regarding non-cash share-
based compensation.
(i)Allowance for credit losses consists of the recognition and reversal of credit losses. Refer to Note 14 in the Notes to the Group Financial
Statements for additional information regarding credit losses.
Operating Expenses
We experienced decreases in per unit operating expense of 3%, or $0.04 per Mcfe, resulting from:
—Higher per Mcfe LOE that increased 15%, or $0.09 per Mcfe, reflective of changes in our portfolio mix due to the higher cost
structure of the Central Region and our growing presence there. LOE includes cost from assets from our Tanos II acquisition
in March 2023 as well as a full year of expenses from the acquired East Texas Assets and ConocoPhillips assets acquired in
April and September 2022, respectively. Importantly, however, while per units costs increased, margins remained relatively
flat at 52%.
—Lower per Mcfe production taxes that declined 16%, or $0.04 per Mcfe were primarily attributable to a decrease in
severance taxes as a result of a decrease in revenue due to lower commodity prices; and
—Lower per Mcfe transportation expenses that declined 20%, or $0.08 per Mcfe, resulting from decreases in third-party
midstream rates that are tied to commodity pricing in the Central Region.
General and Administrative Expense
G&A expense decreased primarily due to:
—A decrease in other adjusting costs due to the comparatively limited transactional activity in 2023 as compared to 2022.
From time to time, we incur costs associated with potential acquisitions that include deposits, rights of first refusal, option
agreement costs and hedging costs incurred in connection with the potential acquisitions. At times, due to changing macro-
economic conditions, commodity price volatility and/or findings observed during our deal diligence efforts, we incur
expenses of this nature as breakage and/or deal sourcing fees. In 2021, we paid $25 million in costs associated with a
potential acquisition and, due to decisions we made in the first quarter of 2022, we terminated the transaction and wrote off
$25 million in certain acquisition related costs related to these items.
—In February 2022, we paid $28 million to terminate a fixed-price purchase contract associated with certain Barnett volumes
acquired during the Blackbeard acquisition. The contract extended through March 2024 and, as a result of the termination,
we will realize more favorable pricing over this period. This transaction also positioned us to refinance these assets as part
of the ABS IV financing arrangement and allowed us to enhance our liquidity by eliminating the need for a $20 million letter
of credit on our Credit Facility. This transaction was classified in other adjusting costs.
Other Expenses
Depreciation, depletion and amortization (“DD&A”) increased due to higher depletion expense due to a 1% increase in
production attributable to an increased number of producing wells from acquisitions.
Allowance for credit losses increased due to the impact on anticipated credit losses on joint interest owner receivables has a
direct relationship with pricing and distributions to individual owners. As the pricing environment declined in 2023, the
underlying well economics did as well, and as a result, in 2023, we increased our reserve by $8 million.
Refer to Notes 5, 10, 11 and 13 in the Notes to the Group Financial Statements for additional information regarding acquisitions,
natural gas and oil properties, property, plant and equipment and derivative financial instruments, respectively.
DERIVATIVE FINANCIAL INSTRUMENTS
We recorded the following gain (loss) on derivative financial instruments in the Consolidated Statement of Comprehensive
Income for the periods presented:
(In thousands) |
Year Ended |
|||
December 31, 2023 |
December 31, 2022 |
$ Change |
% Change |
|
Net gain (loss) on commodity derivatives
settlements(a)
|
$178,064 |
$(895,802) |
$1,073,866 |
(120%) |
Net gain (loss) on interest rate swap(a)
|
(2,722) |
(1,434) |
(1,288) |
90% |
Gain (loss) on foreign currency hedges(a)
|
(521) |
— |
(521) |
(100%) |
Total gain (loss) on settled derivative
instruments
|
$174,821 |
$(897,236) |
$1,072,057 |
(119%) |
Gain (loss) on fair value adjustments of
unsettled financial instruments(b)
|
905,695 |
(861,457) |
1,767,152 |
(205%) |
Total gain (loss) on derivative financial
instruments
|
$1,080,516 |
$(1,758,693) |
$2,839,209 |
(161%) |
(In thousands) |
Year Ended |
|||
December 31, 2022 |
December 31, 2021 |
$ Change |
% Change |
|
Net gain (loss) on commodity derivatives
settlements(a)
|
$(895,802) |
$(320,656) |
$(575,146) |
179% |
Net gain (loss) on interest rate swaps(a)
|
(1,434) |
(530) |
(904) |
171% |
Gain (loss) on foreign currency hedges(a)
|
— |
(1,227) |
1,227 |
(100%) |
Total gain (loss) on settled derivative
instruments
|
$(897,236) |
$(322,413) |
$(574,823) |
178% |
Gain (loss) on fair value adjustments of
unsettled financial instruments(b)
|
(861,457) |
(652,465) |
(208,992) |
32% |
Total gain (loss) on derivative financial
instruments
|
$(1,758,693) |
$(974,878) |
$(783,815) |
80% |
(a)Represents the cash settlement of hedges that settled during the period.
(b)Represents the change in fair value of financial instruments net of removing the carrying value of hedges that settled during the period.
For the year ended December 31, 2023, we recognized a gain on derivative financial instruments of $1,081 million compared to
a loss of $1,759 million in 2022. Adjusting our unsettled derivative contracts to their fair values drove a gain of $906 million in
2023, as compared to a loss of $861 million in 2022.
For the year ended December 31, 2023, we recognized a gain on settled derivative instruments of $175 million as compared to
a loss of $897 million in 2022. The gain on settled derivative instruments relates to lower commodity market prices than we
secured through our derivative contracts. With consistent reliable cash flows central to our strategy, to protect our downside
risk we routinely hedge at levels that, based on our operating and overhead costs, provide a healthy margin even if it means
foregoing potential price upside.
Refer to Note 13 in the Notes to the Group Financial Statements for additional information regarding derivative
financial instruments.
GAIN ON BARGAIN PURCHASES
We recorded the following gain on bargain purchases in the Consolidated Statement of Comprehensive Income for the
periods presented:
(In thousands) |
Year Ended |
|||
December 31, 2023 |
December 31, 2022 |
$ Change |
% Change |
|
Gain on bargain purchases |
$— |
$4,447 |
$(4,447) |
(100%) |
(In thousands) |
Year Ended |
|||
December 31, 2022 |
December 31, 2021 |
$ Change |
% Change |
|
Gain on bargain purchases |
$4,447 |
$58,072 |
$(53,625) |
(92%) |
In past years the E&P segment of the broader energy sector has been in a period of transition and rebalancing, thus creating
opportunities for healthy companies like ours to acquire high quality assets for less than their fair value. We have established a
track record of being disciplined in our bidding to acquire assets that meet our strict asset profile and are accretive to our
overall corporate value.
In 2022, we recognized a gain on bargain purchases of $4 million that was primarily a result of measurement period
adjustments associated with the 2021 Tapstone acquisition.
In 2021, we recognized a gain on bargain purchases of $58 million related to the acquisition of Tapstone and Tanos.
Gain on bargain purchases are not recorded for transactions that are accounted for as an acquisition of assets under IFRS 3,
Business Combinations (“IFRS 3”). Rather, the consideration paid is allocated to the assets acquired on a relative fair
value basis.
Refer to Note 5 in the Notes to the Group Financial Statements for additional information regarding acquisitions and bargain
purchase gain.
FINANCE COSTS
(In thousands) |
Year Ended |
|||
December 31, 2023 |
December 31, 2022 |
$ Change |
% Change |
|
Interest expense, net of capitalized and
income amounts(a)
|
$117,808 |
$86,840 |
$30,968 |
36% |
Amortization of discount and deferred
finance costs
|
16,358 |
13,903 |
2,455 |
18% |
Other |
— |
56 |
(56) |
(100%) |
Total finance costs |
$134,166 |
$100,799 |
$33,367 |
33% |
(In thousands) |
Year Ended |
|||
December 31, 2022 |
December 31, 2021 |
$ Change |
% Change |
|
Interest expense, net of capitalized and
income amounts(a)
|
$86,840 |
$42,370 |
$44,470 |
105% |
Amortization of discount and deferred
finance costs
|
13,903 |
8,191 |
5,712 |
70% |
Other |
56 |
67 |
(11) |
(16%) |
Total finance costs |
$100,799 |
$50,628 |
$50,171 |
99% |
(a)Includes payments related to borrowings and leases.
For the year ended December 31, 2023, interest expense of $118 million increased by $31 million compared to $87 million in
2022, primarily due to the increase in borrowings to fund our 2023 acquisition, incurring a full year of interest on borrowings
associated with the 2022 acquisitions and an increase in the weighted average interest rate on borrowings year-over-year.
As of December 31, 2023 and 2022, total borrowings were $1,325 million and $1,498 million, respectively. For the period ended
December 31, 2023, the weighted average interest rate on borrowings was 6.03% as compared to 5.51% as of December 31,
2022. As of December 31, 2023, 87% of our borrowings now reside in fixed-rate, hedge-protected, amortizing structures
compared to 96% as of December 31, 2022.
Refer to Notes 5, 20, and 21 in the Notes to the Group Financial Statements for additional information regarding acquisitions,
leases and borrowings, respectively.
TAXATION
The effective tax rate is calculated on the face of the Statement of Comprehensive Income by dividing the amount of recorded
income tax benefit (expense) by the income (loss) before taxation as follows:
(In thousands) |
Year Ended |
|||
December 31, 2023 |
December 31, 2022 |
$ Change |
% Change |
|
Income (loss) before taxation |
$1,000,344 |
$(799,502) |
$1,799,846 |
(225%) |
Income tax benefit (expenses) |
(240,643) |
178,904 |
(419,547) |
(235%) |
Effective tax rate |
24.1% |
22.4% |
||
(In thousands) |
Year Ended |
|||
December 31, 2022 |
December 31, 2021 |
$ Change |
% Change |
|
Income (loss) before taxation |
$(799,502) |
$(550,900) |
$(248,602) |
45% |
Income tax benefit (expenses) |
178,904 |
225,694 |
(46,790) |
(21%) |
Effective tax rate |
22.4% |
41.0% |
||
The differences between the statutory U.S. federal income tax rate and the effective tax rates are summarized as follows:
Year Ended |
|||
December 31, 2023 |
December 31, 2022 |
December 31, 2021 |
|
Expected tax at statutory U.S. federal income tax rate |
21.0% |
21.0% |
21.0% |
State income taxes, net of federal tax benefit |
3.1% |
1.2% |
4.4% |
Federal credits |
—% |
—% |
15.4% |
Other, net |
—% |
0.2% |
0.2% |
Effective tax rate |
24.1% |
22.4% |
41.0% |
For the year ended December 31, 2023, we reported a tax expense of $241 million, a change of $420 million, compared to a
benefit of $179 million in 2022 which was a result of the change in the loss before taxation and a change in the amount of tax
credits generated relative to the pre-tax loss. The resulting effective tax rates for the years ended December 31, 2023 and
2022 were 24.1% and 22.4%, respectively. The effective tax rate can be materially impacted by the recognition of the marginal
well tax credit available to qualified producers as noted in our 2021 effective tax rate. A marginal well tax credit was not
available in 2022 and this tax credit has not been announced for 2023. The federal government provides these credits to
encourage companies to continue operating lower-volume wells during periods of low prices to maintain the underlying jobs
they create and the state and local tax revenues they generate for communities to support schools, social programs, law
enforcement and other similar public services.
Refer to Note 8 in the Notes to the Group Financial Statements for additional information regarding taxation.
OPERATING PROFIT, NET INCOME, ADJUSTED EBITDA AND EPS
(In thousands, except per unit data) |
Year Ended |
|||
December 31, 2023 |
December 31, 2022 |
$ Change |
% Change |
|
Operating profit (loss) |
$1,161,051 |
$(671,403) |
$1,832,454 |
(273%) |
Net income (loss) |
759,701 |
(620,598) |
1,380,299 |
(222%) |
Adjusted EBITDA |
542,794 |
502,954 |
39,840 |
8% |
Earnings (loss) per share - basic |
$16.07 |
$(14.82) |
$30.89 |
(208%) |
Earnings (loss) per share - diluted |
$15.95 |
$(14.82) |
$30.77 |
(208%) |
(In thousands, except per unit data) |
Year Ended |
|||
December 31, 2022 |
December 31, 2021 |
$ Change |
% Change |
|
Operating profit (loss) |
$(671,403) |
$(467,064) |
$(204,339) |
44% |
Net income (loss) |
(620,598) |
(325,206) |
(295,392) |
91% |
Adjusted EBITDA |
502,954 |
343,145 |
159,809 |
47% |
Earnings (loss) per share - basic |
$(14.82) |
$(8.20) |
$(6.62) |
81% |
Earnings (loss) per share - diluted |
$(14.82) |
$(8.20) |
$(6.62) |
81% |
For the year ended December 31, 2023, we reported net income of $760 million and basic EPS of $16.07 ($15.95 diluted EPS)
compared to net loss of $621 million and basic loss per share of $14.82 ($14.82 diluted loss per share) in 2022, an increase of
222% and 208%, respectively. We also reported an operating profit of $1,161 million compared with an operating loss of $671
million for the years ended December 31, 2023 and 2022, respectively. This year-over-year increase was primarily attributable
to a $2,839 million increase in gains on derivatives, a $40 million increased in gains on sale of assets, offset by a decrease in
gross profit of $1,048 million, $33 million more in finance costs, and $420 million more income tax expense as compared
to 2022.
Excluding the mark-to-market gain on long-dated derivative valuations, as well as other customary adjustments, we reported
adjusted EBITDA of $543 million for the year ended December 31, 2023 compared to $503 million for the year ended
December 31, 2022, representing an increase of 8% driven by our growth through the Tanos II acquisition in 2023 and a full
year of the 2022 East Texas Assets and ConocoPhillips acquisitions.
LIQUIDITY AND CAPITAL RESOURCES
Overview
Our principal sources of liquidity are cash generated from operations and available borrowings under our Credit Facility. To
minimize interest expense, we use our excess cash flow to reduce borrowings on our Credit Facility and as a result have
historically carried little cash on our Consolidated Statement of Financial Position as evidenced by our $4 million and $7 million
in cash and cash equivalents as of December 31, 2023 and 2022, respectively.
When we acquire assets to grow, we complement our Credit Facility with asset-backed debt securitized by certain natural gas
and oil assets, which are long-term, fixed-rate, fully-amortizing debt structures that better match the long-life nature of our
assets. These structures afford us low borrowing rates and also provide a visible path for reducing leverage as we make
scheduled principal payments. For larger value-adding acquisitions, and to ensure we maintain a leverage profile that we
believe is appropriate for the type of assets we acquire, we also raise proceeds through secondary equity offerings from time
to time.
We monitor our working capital to ensure that the levels remain adequate to operate the business with excess liquidity
primarily utilized for the repayment of debt or dividends to shareholders. In addition to working capital management, we have
a disciplined approach to managing operating costs and allocating capital resources, ensuring that we are generating returns
on our capital investments to support the strategic initiatives in our business operations.
Capital expenditures were $74 million for the year ended December 31, 2023 compared to $86 million for the year ended
December 31, 2022. This decrease in capital expenditures was primarily driven by the completion of wells in 2022 that were
under development by Tapstone at the time we closed that acquisition in 2021. While our March 2023 Tanos II acquisition also
contained wells under development at the time of acquisition, the capital expenditures needed for their development during
2023 was less significant than that required during 2022. We expect to meet our capital expenditure needs for the foreseeable
future from our operating cash flows and our existing cash and cash equivalents. Our future capital requirements will depend
on several factors, including our growth rate and future acquisitions, among other things.
With respect to our other known current obligations, we believe that our sources of liquidity and capital resources will be
sufficient to meet our existing business needs for at least the next 12 months. However, our ability to satisfy our working
capital requirements, debt service obligations and planned capital expenditures will depend upon our future operating
performance, which will be affected by prevailing economic conditions in the natural gas and oil industry and other financial
and business factors, some of which are beyond our control.
Refer to Note 13 in the Notes to the Group Financial Statements for additional information regarding our hedging program to
mitigate the risk associated with future cash flow generation.
The table below represents our liquidity position as of December 31, 2023, 2022 and 2021.
As of |
|||
(In thousands) |
December 31, 2023 |
December 31, 2022 |
December 31, 2021 |
LESS: Cash |
$3,753 |
$7,329 |
$12,558 |
Available borrowings under the Credit Facility(a)
|
134,817 |
183,332 |
222,263 |
Liquidity |
$138,570 |
$190,661 |
$234,821 |
(a)Represents available borrowings under the Credit Facility of $146 million as of December 31, 2023 less outstanding letters of credit of $11
million as of such date. Represents available borrowings under the Credit Facility of $194 million as of December 31, 2022 less outstanding
letters of credit of $11 million as of such date. Represents available borrowings under the Credit Facility of $254 million as of December 31,
2021 less outstanding letters of credit of $32 million as of such date.
DEBT
Our net borrowings consisted of the following as of the reporting date:
As of |
||
(In thousands) |
December 31, 2023 |
December 31, 2022 |
Credit Facility |
$159,000 |
$56,000 |
ABS I Notes |
100,898 |
125,864 |
ABS II Notes |
125,922 |
147,458 |
ABS III Notes |
274,710 |
319,856 |
ABS IV Notes |
99,951 |
130,144 |
ABS V Notes |
290,913 |
378,796 |
ABS VI Notes |
159,357 |
212,446 |
Term Loan I |
106,470 |
120,518 |
Other |
7,627 |
7,084 |
Total debt |
$1,324,848 |
$1,498,166 |
LESS: Cash |
3,753 |
7,329 |
LESS: Restricted cash |
36,252 |
55,388 |
Net debt |
$1,284,843 |
$1,435,449 |
OUR CAPITAL EXPENDITURE PROGRAM
Our strategy to acquire and operate producing assets that generate adjusted EBITDA margins of approximately 50% allows us
to invest capital back into our operations. In addition, we have set goals to achieve “net zero” Scope 1 and Scope 2 emissions
by 2040 through new investments aimed at emissions reductions, such as investments in natural gas emissions detection
devices and conducting aerial scans of our assets.
The majority of our capital expenditures are focused on our midstream operations, which includes pipelines and compression,
while the remaining capital expenditures are focused on production optimization, technology, upstream operations, plugging
capacity expansion, fleet, emissions reductions, and when prudent, may include development activities targeted at replacing
production. Given our operational focus to acquire and operate mature conventional wells and unconventional wells with a
shallow decline rate, we do not incur the same level of large capital expenditures associated with drilling and completion
activities that would typically be incurred by other development focused exploration and production companies.
We have consistently targeted a disciplined leverage profile at or under 2.5 to 1.0 after giving effect to acquisitions and any
related financing arrangements. We believe this leverage range is supported by our differentiated business model, namely with
long-life, low-decline production providing resilient cash flows, and a strategic financial framework that is bolstered by
hedging and amortizing debt instruments. Our weighted-average hedge floor on natural gas production increased from $3.63
per Mcf as of December 31, 2022 to $3.87 per Mcf as of December 31, 2023.
Looking forward, we continue to seek to maximize cash flow. We plan to maintain our hedging strategy and take advantage of
market opportunities to raise the floor price of our risk management program. We will seek to retain our strategic advantages
in purposeful growth through a disciplined capital expenditure program that continues to secure low-cost financing that
supports acquisitive growth while maintaining low leverage and sufficient liquidity.
ASSET RETIREMENT OBLIGATIONS
We continue to be proactive and innovative with respect to asset retirement. In 2017, after our LSE IPO, we proactively began
to meet with state officials to develop a long-term plan to retire our growing portfolio of long-life wells. Collaborating with the
appropriate regulators, we designed our retirement activities to be equitable for all stakeholders with an emphasis on
the environment.
During the year ended December 31, 2023 we accomplished the following:
—Expanded asset retirement operations from 15 rigs at December 31, 2022 to 17 rigs at December 31, 2023 increasing our
asset retirement capacity in Appalachia;
—Retired 222 wells, inclusive of our Central Region operations, outpacing calendar year 2022 activity when we retired 214
wells. These retirements were achieved one full year in advance of our stated goal to retire 200 wells per year by year-end
2023; and
—Retired 182 outside party wells, including 148 state and federal orphan wells and 34 wells for other operators.
This growth in our asset retirement capacity provides us with the ability to further integrate our asset retirement operations
and generate cost efficiencies across a broader footprint. It will also provide us with the ability to generate additional third-
party revenues by providing a suite of services to other production companies which can be utilized to help fund the cost
associated with our own asset retirement program. As a result, we aim to obtain a prudent mix of both cost reduction and
third-party revenues to maximize the benefits of our internal asset retirement program.
Our asset retirement program reflects our solid commitment to a healthy environment and the surrounding communities, and
we anticipate continued investment and innovation in this area. During 2024, we will continue our work to realize the vertical
integration benefits of expanded internal asset retirement capacity to reduce reliance on third-party contractors, reduce
outsource risk, improve process quality and responsiveness, and increase control over environmental remediation and costs.
The composition of the provision for asset retirement obligations at the reporting date was as follows for the
periods presented:
Year Ended |
|||
(In thousands) |
December 31, 2023 |
December 31, 2022 |
December 31, 2021 |
Balance at beginning of period |
$457,083 |
$525,589 |
$346,124 |
Additions(a)
|
3,250 |
24,395 |
96,292 |
Accretion |
26,926 |
27,569 |
24,396 |
Asset retirement costs |
(5,961) |
(4,889) |
(2,879) |
Disposals(b)
|
(17,300) |
(16,779) |
(16,500) |
Revisions to estimate(c)
|
42,650 |
(98,802) |
78,156 |
Balance at end of period |
$506,648 |
$457,083 |
$525,589 |
Less: Current asset retirement obligations |
5,402 |
4,529 |
3,399 |
Non-current asset retirement obligations |
$501,246 |
$452,554 |
$522,190 |
(a)Refer to Note 5 in the Notes to the Group Financial Statements for additional information regarding acquisitions and divestitures.
(b)Associated with the divestiture of natural gas and oil properties. Refer to Note 5 in the Notes to the Group Financial Statements for
additional information.
(c)As of December 31, 2023, we performed normal revisions to our asset retirement obligations, which resulted in a $43 million increase in the
liability. This increase was comprised of a $28 million increase attributable to a lower discount rate as a result of slightly decreased bond
yields as compared to 2022 as inflation began to increase at a lower rate and $16 million in cost revisions based on our recent asset
retirement experiences. Partially offsetting these decreases was a $1 million change attributed to timing. As of December 31, 2022, we
performed normal revisions to our asset retirement obligations, which resulted in a $99 million decrease in the liability. This decrease was
comprised of a $145 million decrease attributable to the lower discount rate which was then offset by a $29 million reduction in anticipated
asset retirement cost. The remaining change was attributable to timing. The lower discount rate was a result of macroeconomic factors
spurred by the COVID-19 recovery, which reduced bond yields and increased inflation. Cost reductions are based on our recent asset
retirement experiences. As of December 31, 2021, we performed normal revisions to our asset retirement obligations, which resulted in a $78
million increase in the liability. This increase was comprised of a $109 million increase attributable to the lower discount rate which was then
offset by a $27 million reduction in anticipated asset retirement cost. The remaining change was attributable to timing. The lower discount
rate was a result of macroeconomic factors spurred by the COVID-19 recovery, which reduced bond yields and increased inflation. Cost
reductions are based on our recent asset retirement experiences.
The anticipated future cash outflows for our asset retirement obligations on an undiscounted and discounted basis were as set
forth in the tables below as of December 31, 2023, 2022 and 2021. When discounting the obligation, we apply a contingency
allowance for annual inflationary cost increases to our current cost expectations and then discount the resulting cash flows
using a credit adjusted risk free discount rate resulting in a net discount rate of 3.4%, 3.6% and 2.9% for the periods indicated,
respectively. While the rate is comparatively small to the commonly utilized PV-10 metric in our industry, the impact is
significant due to the long-life low-decline nature of our portfolio. Although productive life varies within our well portfolio,
presently we expect all of our existing wells to have reached the end of their productive lives and be retired by approximately
2095, consistent with our reserve calculations which were independently evaluated by third-party engineers.
When evaluating our ability to meet our asset retirement obligations we review reserves models which utilize the income
approach to determine the expected discounted future net cash flows from estimated reserve quantities. These models
determine future revenues associated with production using forward pricing then consider the costs to produce and develop
reserves, as well as the cost of asset retirement at the end of a well’s life. These future net cash flows are discounted using a
weighted average cost of capital of 10% to produce the PV-10 of our reserves. After considering the asset retirement costs in
these models, our PV-10 was approximately $2.1 billion, $8.8 billion and $4.0 billion as of December 31, 2023, 2022 and 2021,
respectively, illustrating residual cash flows well beyond our retirement obligations.
As of December 31, 2023:
(In thousands) |
Not Later Than
One Year
|
Later Than One
Year and Not Later
Than Five Years
|
Later Than
Five Years
|
|
Total | ||||
Undiscounted |
$5,402 |
$20,365 |
$1,778,876 |
$1,804,643 |
Discounted |
5,402 |
17,975 |
483,271 |
506,648 |
As of December 31, 2022:
(In thousands) |
Not Later Than
One Year
|
Later Than One
Year and Not Later
Than Five Years
|
Later Than
Five Years
|
|
Total | ||||
Undiscounted |
$4,529 |
$19,671 |
$1,673,905 |
$1,698,105 |
Discounted |
4,529 |
17,314 |
435,240 |
457,083 |
As of December 31, 2021:
(In thousands) |
Not Later Than
One Year
|
Later Than One
Year and Not Later
Than Five Years
|
Later Than
Five Years
|
|
Total | ||||
Undiscounted |
$3,399 |
$17,210 |
$1,594,853 |
$1,615,462 |
Discounted |
3,399 |
13,675 |
508,515 |
525,589 |
CASH FLOWS
Our principal sources of liquidity have historically been cash generated from operating activities. To minimize financing costs,
we apply our excess cash flow to reduce borrowings on our Credit Facility. When we acquire assets to grow, we complement
our Credit Facility with long-term, fixed-rate, fully-amortizing debt structures that better match the long-life nature of our
assets. These structures afford us low borrowing rates and also provide a visible path for reducing leverage as we make
scheduled principal payments. For larger value-adding acquisitions, and to ensure we maintain a leverage profile that we
believe is appropriate for the type of assets we acquire, we will also raise equity proceeds through a secondary offering.
We monitor our working capital to ensure that the levels remain adequate to operate the business with excess cash primarily
being utilized for the repayment of debt or shareholder distributions. In addition to working capital management, we have a
disciplined approach to managing operating costs and allocating capital resources, ensuring that we are generating returns on
our capital investments to support the strategic initiatives in our business operations.
(In thousands) |
Year Ended |
|||
December 31, 2023 |
December 31, 2022 |
$ Change |
% Change |
|
Net cash provided by operating activities |
$410,132 |
$387,764 |
$22,368 |
6% |
Net cash used in investing activities |
(239,369) |
(386,457) |
147,088 |
(38%) |
Net cash provided by (used in) financing
activities
|
(174,339) |
(6,536) |
(167,803) |
2,567% |
Net change in cash and cash equivalents |
$(3,576) |
$(5,229) |
$1,653 |
(32%) |
(In thousands) |
Year Ended |
|||
December 31, 2022 |
December 31, 2021 |
$ Change |
% Change |
|
Net cash provided by operating activities |
$387,764 |
$320,182 |
$67,582 |
21% |
Net cash used in investing activities |
(386,457) |
(627,712) |
241,255 |
(38%) |
Net cash provided by (used in) financing
activities
|
(6,536) |
318,709 |
(325,245) |
(102%) |
Net change in cash and cash equivalents |
$(5,229) |
$11,179 |
$(16,408) |
(147%) |
Net Cash Provided by Operating Activities
For the year ended December 31, 2023, net cash provided by operating activities of $410 million increased by $22 million, or
6%, when compared to $388 million in 2022. The increase in net cash provided by operating activities was predominantly
attributable to the following:
—An increase in total revenue, inclusive of settled hedges, coupled with the decreases in expenses described above. This
increase in adjusted EBITDA was then offset by the increases in finance costs;
—Changes in working capital generated cash outflows, driven by decreasing accounts payable balances, accrued liabilities,
and distribution in suspense balances. These increases are a function of working capital turnover from the higher price
environment experienced in 2022 to the lower price environment in 2023.
Production, realized prices, operating expenses, and G&A are discussed above.
Net Cash Used in Investing Activities
For the year ended December 31, 2023, net cash used in investing activities of $239 million decreased by $147 million, or 38%,
from outflows of $386 million in 2022. The change in net cash used in investing activities was primarily attributable to
the following:
—A decrease in cash outflows of $138 million for acquisition, divestiture and disposal activity. Net cash outflows associated
with acquisitions, divestitures and disposals was $162 million during the year ended December 31, 2023 when compared to
$300 million for the year ended December 31, 2022. Refer to Note 5 and Note 11 in the Notes to the Group Financial
Statements for additional information regarding acquisitions, divestitures and disposals;
—Capital expenditures were $74 million for the year ended December 31, 2023 compared to $86 million for the year ended
December 31, 2022. This decrease in capital expenditures was primarily driven by the completion of wells in 2022 that were
under development by Tapstone at the time we closed that acquisition in 2021. While our March 2023 Tanos II acquisition
also contained wells under development at the time of acquisition, the capital expenditures needed for their development
during 2023 was less than that required during 2022.
Net Cash Provided by Financing Activities
For the year ended December 31, 2023, net cash used in financing activities of $174 million increased by $168 million as
compared to $7 million in 2022. This change in net cash used in financing activities was primarily attributable to the following:
—Credit Facility, ABS Note and Term Loan activity resulted in net repayments of $11 million (including $277 million in
repayments of amortizing debt) in 2023 versus net proceeds of $448 million in 2022, with much of the change attributable
to the issuance of the ABS III-VI Notes in 2022 which refinanced a portion of our Credit Facility by converting it to a fixed-
rate, hedge-protected, amortizing structure.
—An increase of $157 million in proceeds from equity issuances in 2023 that did not occur in 2022.
—A decrease of $12 million in restricted cash as a result of the establishment of the interest reserve required by our ABS III -
VI Notes that were issued in 2022. No similar notes were issued and consolidated into our financial statements in 2023,
—An increase of $99 million due to reduced hedge modifications associated with ABS notes in 2023 as compared to 2022,
—A decrease of $24 million in the repurchase of shares, inclusive of EBT repurchases, as there were no similar EBT
repurchases in 2023, and
—An increase of $25 million in dividends paid in 2023 as compared to 2022;
Refer to Notes 16, 18 and 21 in the Notes to the Group Financial Statements for additional information regarding share capital,
dividends and borrowings, respectively.
OFF-BALANCE SHEET ARRANGEMENTS
We may enter into off-balance sheet arrangements and transactions that give rise to material off-balance sheet obligations. As
of December 31, 2023 and December 31, 2022, our material off-balance sheet arrangements and transactions include operating
service arrangements of $11 million in letters of credit outstanding against our Credit Facility, respectively.
There are no other transactions, arrangements or other relationships with unconsolidated entities or other persons that are
reasonably likely to materially affect our liquidity or availability of capital resources.
CONTRACTUAL OBLIGATIONS AND CONTINGENT LIABILITIES AND COMMITMENTS
We have various contractual obligations in the normal course of our operations and financing activities. Significant contractual
obligations as of the periods presented were as follows:
(In thousands) |
Not Later Than
One Year
|
Later Than
One Year and
Not Later Than
Five Years
|
Later Than
Five Years
|
|
Total | ||||
Recorded contractual obligations |
||||
Trade and other payables |
$53,490 |
$— |
$— |
$53,490 |
Borrowings |
200,822 |
864,264 |
259,762 |
1,324,848 |
Leases |
10,563 |
20,559 |
— |
31,122 |
Asset retirement obligation(a)
|
5,402 |
20,365 |
1,778,876 |
1,804,643 |
Other liabilities(b)
|
178,779 |
2,224 |
— |
181,003 |
Off-Balance Sheet contractual obligations |
||||
Firm Transportation(c)
|
28,242 |
29,919 |
183,209 |
241,370 |
Total |
$477,298 |
$937,331 |
$2,221,847 |
$3,636,476 |
(a)Represents our asset retirement obligation on an undiscounted basis. On a discounted basis the liability is $507 million as of December 31,
2023 as presented in the Consolidated Statement of Financial Position.
(b)Represents accrued expenses and net revenue clearing. Excludes taxes payable, asset retirement obligations and revenue to be distributed.
Refer to Note 23 in the Notes to the Group Financial Statements for information.
(c)Represents reserved capacity to transport gas from production locations through pipelines to the ultimate sales meters.
We believe that our cash flows from operations and existing liquidity will be sufficient to meet our existing contractual
obligations and commitments for the next twelve months, even under a stressed scenario as evidenced by our Viability and
Going Concern assessment. Cash flows from operations were $410 million for the year ended December 31, 2023, which
includes partial-year contributions from our Tanos II acquisition in 2023. Cash flows from operations were $388 million for the
year ended December 31, 2022, which similarly includes only a partial-year of contributions from our Central Region
acquisitions in 2022. As of December 31, 2023 and 2022, we had current assets of $305 million and $354 million, respectively,
and available borrowings on our Credit Facility of $146 million and $194 million, respectively, (excluding $11 million in
outstanding letters of credit, respectively), which could also be used to service our contractual obligations and commitments
over the next twelve months.
Litigation and Regulatory Proceedings
From time to time, we may be involved in legal proceedings in the ordinary course of business. We are not currently a party to
any material litigation proceedings, the outcome of which, if determined adversely to us, individually or in the aggregate, is
reasonably expected to have a material and adverse effect on our business, financial position or results of operations. In
addition, we are not aware of any material legal or administrative proceedings contemplated to be brought against us.
We have no other contingent liabilities that would have a material impact on our financial position, results of operations or
cash flows.
Environmental Matters
Our operations are subject to environmental laws and regulation in all the jurisdictions in which we operate. We are unable to
predict the effect of additional environmental laws and regulations that may be adopted in the future, including whether any
such laws or regulations would adversely affect our operations. We can offer no assurance regarding the significance or cost
of compliance associated with any such new environmental legislation or regulation once implemented.
In May 2022, we joined the Oil and Gas Methane Partnership 2.0 (the “OGMP”), a multi-stakeholder initiative launched by the
United Nations Environment Program and Climate and Clean Air Coalition in partnership with the European Commission, the
UK Government, Environmental Defense Fund and other leading natural gas and oil companies, to further advance our
commitment to reducing emissions.
The OGMP is a voluntary commitment which includes establishment of a credible pathway to attaining the “Gold Standard
Compliance” designation for the natural gas produced by the Group. We have attained the “Gold Standard Pathway” for our
implementation plan whereby we seek to improve our current measurement processes for natural gas emissions. We expect
the impact on our operations to be improved efficiency and reduced emissions.
RECENTLY ISSUED ACCOUNTING PRONOUNCEMENTS
Refer to Note 3 in the Notes to the Group Financial Statements for information regarding recent accounting pronouncements
applicable to our Consolidated Financial Statements.
CRITICAL ACCOUNTING POLICIES AND ESTIMATES
Refer to Note 3 and 4 in the Notes to the Group Financial Statements for information regarding our significant accounting
policies, judgments and estimates.
QUANTITATIVE AND QUALITATIVE DISCLOSURE ABOUT MARKET RISK
Refer to Note 25 in the Notes to the Group Financial Statements for information regarding market risk.
TREND INFORMATION
Other than as disclosed elsewhere in this Annual Report & Form 20-F, we are not aware of any trends, uncertainties, demands,
commitments or events since December 31, 2023 that are reasonably likely to have a material adverse effect on our revenues,
income, profitability, liquidity or capital resources, or that would cause the disclosed financial information to be not necessarily
indicative of future operating results or financial conditions. For a discussion of trend information, Refer to Financial Review for
additional information.
Risk Management Framework
Our ERM program focuses on the importance of
risk awareness and mitigation across the
organization. We proactively identify, assess,
prioritize, monitor and mitigate risks enabling
us to deliver the value-creating strategic
objectives outlined in our business model. The
Board regularly assesses our principal and
emerging risks.
ENTERPRISE RISK
MANAGEMENT PROGRAM
(Oversight and approval by the Audit & Risk Committee)
|

RISK UNIVERSE
Categories of risk
| |||
 |
 |
||
STRATEGIC
RISKS
|
LEGAL,
REGULATORY
& REPUTATIONAL
RISKS
|
||
 |
 |
||
OPERATIONAL
RISKS
|
FINANCIAL
RISKS
|
||

ENTERPRISE RISK
ASSESSMENT REVIEW
(Senior Management Team led with
business unit leader support)
|

PRINCIPAL RISKS | |
—Corporate Strategy
and Acquisition Risk
—Cybersecurity Risk
—Health and Safety Risk
—Regulatory and
Political Risk
|
—Climate Risk
—Commodity Price
Volatility Risk
—Financial Strength
and Flexibility Risk
|
ERM Program
Our ERM program is based on risk identification,
assessment, prioritization, monitoring and mitigation
processes, which are continually evaluated and enhanced
with experience and industry best practices.
As part of our ERM activities our Senior Leadership Team,
as directed by the Audit & Risk Committee of the Board,
regularly engages in risk discussions across all areas of our
operations. This healthy dialogue regarding risk creates a
culture that highly regards risk mitigation as a way to
preserve and create value for our stakeholders.
Within the program’s risk identification phase, we capture
potential and emerging risks that could arise as a result of a
change in circumstances or new developments impacting
us. To strengthen our risk identification, we carry out the
following ongoing activities:
—Continuous monitoring of the risk universe for new or
emerging risks;
—Refresh the risk universe at least annually;
—Enhance our risk awareness culture and identify
risk ownership;
—Interview risk owners for current mitigation
activities; and
—Design and implement a risk mitigation
control framework.
2023 and Ongoing
Risk Assessment
As part of our continuous assessment process during 2023,
each business unit head determined the perceived level of
risk for their individual unit’s risk universe. Our Senior
Leadership Team then reviewed and challenged each
perceived risk level, and compared it to our risk universe as
a whole. The results of this exercise were then used to
narrow our risk universe into four principal risk categories
and seven principal risks outlined below, which are closely
monitored by our Senior Leadership Team and the Audit &
Risk Committee.
During 2024, we will be updating our original risk
identification and mitigation assessment by conducting in-
depth interviews and group discussions with business
process owners to determine emerging and escalating risks
within the business and current business and market
environments. Based on the findings of the updated
assessment, we will reassess a new list of principal risks and
the resulting mitigation plans for each risk.
 |
Strategic Risks |
Corporate Strategy and Acquisition Risk
Our future growth hinges on the successful completion of
acquisitions aligned with our strategic objectives. The
execution and seamless integration of these acquisitions
could exert substantial pressure on our managerial,
operational, and financial resources. Failure to adequately
assess, execute, and integrate these acquisitions may
adversely impact our business operations, financial
performance, and overall prospects.
Risk Indicators
The following KPIs are sensitive to the impact of Corporate
Strategy and Acquisition Risk:
—Adjusted operating cost per Mcfe
—Net cash provided by operating activities
—Maintain net debt-to-adjusted EBITDA at or below 2.5x
—Consistent adjusted EBITDA margin
Link to Strategy
—Acquire long-life stable assets
—Operate our assets in a safe, efficient and
responsible manner
—Generate reliable free cash flow
—Retire assets safely and responsibly and restore the
environment to its natural state
Response/Mitigation
—Disciplined commitment to our core strategy of
acquiring low-cost, long-life, relatively low-decline
producing assets and complementary, synergistic
midstream assets.
—Commercial Development, Land, Reserves, Strategic
Planning and Financial Planning & Analysis teams work
closely to identify and review potential acquisition
opportunities which meet strategic objective criteria.
—Experience and knowledge throughout the organization
in recognizing prospective opportunities.
—Thorough risk assessments and due diligence process on
all potential new acquisitions which includes an analysis
of the target’s emissions profile.
—Feedback and evaluation of external experts in the
diligence process.
—Strong balance sheet with significant liquidity to fund
growth through acquisitions.
Climate Risk
Climate-related matters remain central to numerous global
corporate discussions and decisions. While opportunities
related to climate continue to arise in this swiftly changing
landscape, we acknowledge that these issues also pose risks
for DEC. Environmental regulations, climate change concerns,
and investor-driven changes may lead to (i) increased
business costs, (ii) challenges in executing our strategy, and
(iii) restricted access to specific markets or investors.
Risk Indicators
The following KPIs are sensitive to the impact of
Climate Risk:
—Emissions intensity
—Maintain net debt-to-adjusted EBITDA at or below 2.5x
—Adjusted operating cost per Mcfe
—Net cash provided by operating activities
—Consistent adjusted EBITDA margin
—Meet or exceed state asset retirement goals
Link to Strategy
—Operate our assets in a safe, efficient and
responsible manner
—Retire assets safely and responsibly and restore the
environment to its natural state
Response/Mitigation
—Our Board oversees the development of our climate
change strategy which aims to position us at the heart of
the energy transition based on responsible stewardship
of existing natural gas assets. The Board’s decision-
making is informed by regular climate subject matter
updates from each of our key Board committees.
—Through our annual TCFD reporting process, we identify
and assess climate-related risks for consideration of
appropriate risk mitigation actions.
—Our core business strategy aligns with sustainability
initiatives and breeds sustainability. We acquire reliable,
long-life, producing wells that often have not reached
their full potential under their former owners. This
stewardship model allows us to avoid the high cost and
sometimes sizeable environmental impact often
associated with exploration and drilling, which is the
intended target of many sustainability initiatives.
—Alongside our zero-tolerance policy for fugitive
emissions, we invest capital funds towards emission
reduction technologies and projects and regularly deploy
SAM optimization techniques that allow us to eliminate
or reduce our carbon footprint.
—Our core KPI of methane intensity reduction is central to
our corporate goals to reduce both methane and GHG
emissions on our path towards net zero Scope 1 and 2
GHG emissions by 2040.
—We expanded our asset retirement capabilities, managed
through our Next LVL subsidiary, that will permit DEC to
exceed our long-term Appalachian asset retirement
agreements, reflective of our core KPI to Meet or exceed
state asset retirement goals.
 |
Financial Risks |
Commodity Price Volatility Risk
Changes in commodity prices may affect the value of our
natural gas and oil reserves, operating cash flows and
adjusted EBITDA, regardless of our operating performance.
Risk Indicators
The following KPIs are sensitive to the impact of
Commodity Price Volatility Risk:
—Maintain net debt-to-adjusted EBITDA at or below 2.5x
—Consistent adjusted EBITDA margin
—Net cash provided by operating activities
Link to Strategy
—Generate reliable free cash flow
Response/Mitigation
—Our Senior Leadership Team monitors commodity
markets on a daily basis and internal models are
routinely updated to evaluate market changes. This
monitoring process includes reviewing realized pricing,
forward pricing curves, and basis differentials. This active
monitoring is critical to risk mitigation and the successful
execution of our hedge strategy.
—Our hedging policy continues to be guided by our goal
to generate reliable free cash flow in any commodity
pricing environment and secure our debt and dividend
payments. Our hedge strategy of proactively layering on
appropriately structured hedge contracts at
advantageous prices and tenors allows us to capitalize
on beneficial price movements in a constantly changing,
forward natural gas price market.
—External specialists are consulted on a regular basis to
assist in the execution of our hedging strategy.
Financial Strength and Flexibility Risk
Liquidity and access to capital risk arises from our inability
to generate cash flows from operations to fund our
business requirements or our inability to access external
sources of funding. This risk can result in difficulty in
meeting our financial obligations as they become due.
Risk Indicators
The following KPIs are sensitive to the impact of Financial
Strength and Flexibility Risk:
—Maintain net debt-to-adjusted EBITDA at or below 2.5x
—Consistent adjusted EBITDA margin
—Net cash provided by operating activities
—Meet or exceed state asset retirement goals
Link to Strategy
—Acquire long-life stable assets
—Operate our assets in a safe, efficient and
responsible manner
—Generate reliable free cash flow
—Retire assets safely and responsibly and restore the
environment to its natural state
Response/Mitigation
—Our Senior Leadership Team actively monitors debt
levels and available borrowing capacity on our
Credit Facility.
—Our Senior Leadership Team updates the Board at least
quarterly on our debt and liquidity position.
—Our business model of stable production contributes to
predictable cash flows, which makes it easier to forecast
funding needs.
—Strong access to bank capital as our borrowing base in
the Fall 2023 redetermination was reaffirmed
unanimously by our 14-bank group syndicate.
—Maintain access to multiple avenues of funding beyond
our Credit Facility: equity issuance, asset-backed
securitizations, and bond issuance.
—Proactive hedge program to protect against commodity
price volatility and stabilize operating cash flows.
—Continuous management review of the funding and
financing alternatives available to us to ensure sufficient
access to capital is available to meet our future needs.
 |
Legal, Regulatory and Reputational Risks |
Regulatory and Political Risk
Our operations are subject to regulations in all the
jurisdictions in which we operate. We are unable to predict
the effect of additional laws and or regulations which may
be adopted in the future, including whether any such laws
or regulations would adversely affect our operations. We
can provide no assurance that such new legislation, once
implemented, will not oblige us to incur significant
expenses, undertake significant investments, or
reduce production.
Risk Indicators
The following KPIs are sensitive to the impact of Regulatory
and Political Risk:
—Maintain net debt-to-adjusted EBITDA at or below 2.5x
—Adjusted operating cost per Mcfe
—Net cash provided by operating activities
—Consistent adjusted EBITDA margin
—Emissions intensity
—Meet or exceed state asset retirement goals
—Safety Performance
Link to Strategy
—Operate our assets in a safe, efficient and
responsible manner
—Retire assets safely and responsibly and restore the
environment to its natural state
Response/Mitigation
—Operate to the highest industry standards with
regulators and monitor compliance with our contracts,
asset retirement program and taxation requirements.
—External specialists utilized on legal, regulatory, and tax
issues as required.
—Maintain positive relationships with governments and
key stakeholders.
—Continuous monitoring of the political and regulatory
environments in which we operate.
—Working responsibly and community/stakeholder
engagement and outreach is an important factor in
maintaining positive relationships in the communities in
which we operate.
—We encourage our employees to become actively
involved in their communities through industry
associations in their respective operating areas. By
leading, participating in and championing a variety of
these organizations, we believe that our support of the
energy industry’s associations adds value to our business
through the sharing of operating best practices,
technical knowledge and legislation updates, ultimately
to the benefit of all of our stakeholders.
Health and Safety Risk
Potential impacts from a lack of adherence to health and
safety policies may result in fines and penalties, serious
injury or death, environmental impacts, statutory liability for
environmental redemption and other financial and
reputational consequences that could be significant.
Risk Indicators
The following KPIs are sensitive to the impact of Health and
Safety Risk:
—Maintain net debt-to-adjusted EBITDA at or below 2.5x
—Adjusted operating cost per Mcfe
—Net cash provided by operating activities
—Consistent adjusted EBITDA margin
—Safety Performance
Link to Strategy
—Operate our assets in a safe, efficient and
responsible manner
—Retire assets safely and responsibly and restore the
environment to its natural state
Response/Mitigation
—Effectively managing Health and Safety Risk exposure is
the first priority for the Board and Senior Leadership
Team. The Safety & Sustainability Committee of the
Board regularly reviews health and safety programs
and mitigations.
—Health and safety training is included as part of all staff
and contractor inductions.
—Detailed training on our field manual procedures has
been provided to key stakeholders to ensure processes
and procedures are embedded throughout the
organization and all operations.
—Establishing processes for continually assessing our
overall operating and EHS capabilities, including
evaluations to determine the level of oversight required.
—Effective execution of the field operating manual
in operations.
—Crisis and emergency response procedures and
equipment are maintained and regularly tested to ensure
we are able to respond to an emergency quickly, safely
and effectively.
—Leading and lagging indicators and targets developed in
line with industry guidelines and benchmarks.
—Findings from ‘lessons learned’ reviews are implemented
on future operations.
—All employees maintain work stoppage ability.
 |
Operational Risk |
Cybersecurity Risk
Cybersecurity risks for companies have increased
significantly in recent years due to the mounting threat and
increased sophistication of cybercrime. A cybersecurity
breach, incident or failure of our IT systems could disrupt
our businesses, put employees at risk, result in the
disclosure of confidential information, damage our
reputation and create significant financial and legal
exposure for DEC.
Our network is designed using a Zero Trust Approach
(“ZTA”) and is segmented. We’ve established several layers
of security, including least privilege access, conditional
access policies, and multi-factor authentication (“MFA”).
Our ZTA extends beyond our network to encompass
identity, endpoints, infrastructure, data, and applications.
This integrated ecosystem enables enhanced visibility,
intelligence, and automation for our security team. Due to
our 100% cloud environment, we now focus on continuous
testing of our security posture from both trusted and
untrusted sources—both external and internal to our
networks—rather than relying on a one-time penetration
testing approach. Additionally, we collaborate with a third-
party managed security service provider and utilize internal
resources for round-the-clock incident monitoring.
Risk Indicators
The following KPIs are sensitive to the impact of
Cybersecurity Risk:
—Maintain net debt-to-adjusted EBITDA at or below 2.5x
—Consistent adjusted EBITDA margin
—Net cash provided by operating activities
Link to Strategy
—Operate our assets in a safe, efficient and
responsible manner
—Generate reliable free cash flow
Response/Mitigation
—Employees are our first line of defense against these
attacks and we promote secure behaviors to help
mitigate this growing risk. We focus on practical rules
that we promote through robust mandatory annual
training and e-learning sessions delivered by our digital
security team. One of these rules addresses phishing and
reminds staff to ‘think before they click’.
—We engage with key technology partners and suppliers
to ensure potentially vulnerable systems are identified
and secured.
—We test our cybersecurity crisis management and
business continuity plans, recognizing the evolving
nature and pace of the threat landscape.
—Continuous implementation and monitoring of our IT
Security Policy, which includes measures to protect
against cyberattacks.
—Advanced network security detection which includes
regular threat testing.
—Control and protection of confidential information.
—Our Cybersecurity Council, which includes certain
members of the Senior Leadership Team including the
Chief Financial Officer, Chief Information Officer, Chief
Information Security Officer and General Counsel, meets
at least once a quarter to discuss cybersecurity issues,
risks and strategies. The Cybersecurity Council regularly
briefs (at least on a quarterly basis) the Board of
Directors on information security matters, including
assessing risks, efforts to improve our network security
systems and enhanced employee trainings. The
membership of this committee is adequately trained and
educated to provide proper governance, risk
management and control of the cyber security program
utilizing the National Institute of Standards and
Technology framework.
There were no cybersecurity incidents during the year
ended December 31, 2023, that resulted in an interruption
to our operations, known losses of any critical data or
otherwise had a material impact on the Group’s strategy,
financial condition or results of operations. However, the
scope and impact of any future incident cannot be
on how material cybersecurity attacks may impact
our business.
Our ERM program is based on
risk identification, assessment,
prioritization, monitoring and
mitigation processes, which are
continually evaluated and
enhanced with experience and
industry best practices.
|
|||
Risk Factors
You should carefully consider the risks described below, together with all of the other information in
this Annual Report & Form 20-F. The risks and uncertainties below are not the only ones we face.
Additional risks and uncertainties not presently known to us or that we believe to be immaterial may
also adversely affect our business. If any of the following risks occur, our business, financial condition,
and results of operations could be seriously harmed and you could lose all or part of your investment.
This Annual Report & Form 20-F also contains forward-looking statements that involve risks and
uncertainties. Our actual results may differ materially from those anticipated in these forward-looking
statements as a result of various factors, including the risks described below and elsewhere in this
Annual Report & Form 20-F.
Summary of Risk Factors
We are subject to a variety of risks and uncertainties which
could have a material adverse effect on our business,
financial condition, and results of operations. The summary
below is not exhaustive and is qualified by reference to the
full set of risk factors set forth in this “Risk Factors” section.
—Volatility and future decreases in natural gas, NGLs and
oil prices could materially and adversely affect our
business, results of operations, financial condition, cash
flows or prospects.
—We face production risks and hazards that may affect
our ability to produce natural gas, NGLs and oil at
expected levels, quality and costs that may result in
additional liabilities to us.
—The levels of our natural gas and oil reserves and
resources, their quality and production volumes may be
lower than estimated or expected.
—The present value of future net cash flows from our
reserves, or PV-10, will not necessarily be the same as the
current market value of our estimated natural gas, NGL
and oil reserves.
—We may face unanticipated increased or incremental
costs in connection with decommissioning obligations
such as plugging.
—We may not be able to keep pace with technological
developments in our industry or be able to implement
them effectively.
—Deterioration in the economic conditions in any of the
industries in which our customers operate, a domestic or
worldwide financial downturn, or negative credit market
conditions could have a material adverse effect on our
liquidity, results of operations, business and financial
condition that we cannot predict.
—Our operations are subject to a series of risks relating to
climate change.
—We rely on third-party infrastructure such as TC Energy
(formerly TransCanada), Enbridge, CNX, Dominion
Energy Transmission, Enlink, Williams and MarkWest
(defined herein) that we do not control and/or, in each
case, are subject to tariff charges that we do not control.
—Failure by us, our contractors or our primary offtakers to
obtain access to necessary equipment and
transportation systems could materially and adversely
affect our business, results of operations, financial
condition, cash flows or prospects.
—A proportion of our equipment has substantial prior use
and significant expenditure may be required to maintain
operability and operations integrity.
—We depend on our directors, key members of
management, independent experts, technical and
operational service providers and on our ability to retain
and hire such persons to effectively manage our
growing business.
—We may face unanticipated water and other waste
disposal costs.
—We may incur significant costs and liabilities resulting
from performance of pipeline integrity programs and
related repairs.
—Inflation may adversely affect us by increasing costs
beyond what we can recover through price increases
and limit our ability to enter into future debt financing.
—There are risks inherent in our acquisitions of natural gas
and oil assets.
—We may not have good title to all our assets
and licenses.
—Restrictions in our existing and future debt agreements
could limit our growth and our ability to engage in
certain activities.
—The securitizations of our limited purpose, bankruptcy-
remote, wholly owned subsidiaries may expose us to
financing and other risks, and there can be no assurance
that we will be able to access the securitization market in
the future, which may require us to seek more
costly financing.
—We are subject to regulation and liability under
environmental, health and safety regulations, the
violation of which may affect our financial condition
and operations.
—Our operations are dependent on our compliance with
obligations under permits, licenses, contracts and field
development plans.
—Our operations are subject to the risk of litigation.
—The price of our ordinary shares may be volatile and may
fluctuate due to factors beyond our control.
—The dual listing of our ordinary shares may adversely
affect the liquidity and value of our ordinary shares.
—Failure to comply with requirements to design,
implement and maintain effective internal control over
financial reporting could have a material adverse effect
on our business.
—We are subject to certain tax risks, including changes in
tax legislation in the United Kingdom and the
United States.
Risks Related to Our Business, Operations and Industry
Volatility and future decreases in natural gas, NGLs and oil
prices could materially and adversely affect our business,
results of operations, financial condition, cash flows
or prospects.
Our business, results of operations, financial condition, cash
flows or prospects depend substantially upon prevailing
natural gas, NGL and oil prices, which may be adversely
impacted by unfavorable global, regional and national
macroeconomic conditions, including but not limited to
instability related to the military conflict in Ukraine. Natural
gas, NGLs and oil are commodities for which prices are
determined based on global and regional demand, supply
and other factors, all of which are beyond our control.
Historically, prices for natural gas, NGLs and oil have
fluctuated widely for many reasons, including:
—global and regional supply and demand, and
expectations regarding future supply and demand, for
gas and oil products;
—global and regional economic conditions;
—evolution of stocks of oil and related products;
—increased production due to new extraction
developments and improved extraction and
production methods;
—geopolitical uncertainty;
—threats or acts of terrorism, war or threat of war, which
may affect supply, transportation or demand;
—weather conditions, natural disasters, climate change and
environmental incidents;
—access to pipelines, storage platforms, shipping vessels
and other means of transporting, storing and refining gas
and oil, including without limitation, changes in
availability of, and access to, pipeline ullage;
—prices and availability of alternative fuels;
—prices and availability of new technologies affecting
energy consumption;
—increasing competition from alternative energy sources;
—the ability of OPEC and other oil-producing nations, to
set and maintain specified levels of production
and prices;
—political, economic and military developments in gas and
oil producing regions generally;
—governmental regulations and actions, including the
imposition of export restrictions and taxes and
environmental requirements and restrictions as well as
anti-hydrocarbon production policies;
—trading activities by market participants and others
either seeking to secure access to natural gas, NGLs and
oil or to hedge against commercial risks, or as part of an
investment portfolio; and
—market uncertainty, including fluctuations in currency
exchange rates, and speculative activities by those who
buy and sell natural gas, NGLs and oil on the
world markets.
It is impossible to accurately predict future gas, NGL and oil
price movements. Historically, natural gas prices have been
highly volatile and subject to large fluctuations in response
to relatively minor changes in the demand for natural gas.
According to the U.S. Energy Information Administration,
the historical high and low Henry Hub natural gas spot
prices per MMBtu for the following periods were as follows:
in 2021, high of $23.86 and low of $2.43; in 2022, high of
$9.85 and low of $3.46, and in 2023, high of $3.78 and low
of $1.74 — highlighting the volatile nature of
commodity prices.
The economics of producing from some wells and assets
may also result in a reduction in the volumes of our reserves
which can be produced commercially, resulting in
decreases to our reported reserves. Additionally, further
reductions in commodity prices may result in a reduction in
the volumes of our reserves. We might also elect not to
continue production from certain wells at lower prices, or
our license partners may not want to continue production
regardless of our position.
Each of these factors could result in a material decrease in
the value of our reserves, which could lead to a reduction in
our natural gas, NGLs and oil development activities and
acquisition of additional reserves. In addition, certain
development projects or potential future acquisitions could
become unprofitable as a result of a decline in price and
could result in us postponing or canceling a planned project
or potential acquisition, or if it is not possible to cancel, to
carry out the project or acquisition with negative economic
impacts. Further, a reduction in natural gas, NGL or oil
prices may lead our producing fields to be shut down and
to be entered into the decommissioning phase earlier
than estimated.
Our revenues, cash flows, operating results, profitability,
dividends, future rate of growth and the carrying value of
our gas and oil properties depend heavily on the prices we
receive for natural gas, NGLs and oil sales. Commodity
prices also affect our cash flows available for capital
investments and other items, including the amount and
value of our gas and oil reserves. In addition, we may face
gas and oil property impairments if prices fall significantly.
In light of the continuing increase in supply coming from the
Utica and Marcellus shale plays of the Appalachian Basin, no
assurance can be given that commodity prices will remain at
levels which enable us to do business profitably or at levels
that make it economically viable to produce from certain
wells and any material decline in such prices could result in
a reduction of our net production volumes and revenue and
a decrease in the valuation of our production properties,
which could negatively impact our business, results of
operations, financial condition, cash flows or prospects.
We conduct our business in a highly competitive industry.
The gas and oil industry is highly competitive. The key areas
in which we face competition include:
—engagement of third-party service providers whose
capacity to provide key services may be limited;
—acquisition of other companies that may already own
licenses or existing producing assets;
—acquisition of assets offered for sale by other companies;
—access to capital (debt and equity) for financing and
operational purposes;
—purchasing, leasing, hiring, chartering or other procuring
of equipment that may be scarce; and
—employment of qualified and experienced skilled
management and gas and oil professionals and field
operations personnel.
Competition in our markets is intense and depends, among
other things, on the number of competitors in the market,
their financial resources, their degree of geological,
geophysical, engineering and management expertise and
capabilities, their degree of vertical integration and pricing
policies, their ability to develop properties on time and on
budget, their ability to select, acquire and develop reserves
and their ability to foster and maintain relationships with
the relevant authorities. The cost to attract and retain
qualified and experienced personnel has increased and may
increase substantially in the future.
Our competitors also include those entities with greater
technical, physical and financial resources than us. Finally,
companies and certain private equity firms not previously
investing in natural gas and oil may choose to acquire
reserves to establish a firm supply or simply as an
investment. Any such companies will also increase market
competition which may directly affect us.
The effects of operating in a competitive industry
may include:
—higher than anticipated prices for the acquisition of
licenses or assets;
—the hiring by competitors of key management or other
personnel; and
—restrictions on the availability of equipment or services.
If we are unsuccessful in competing against other
companies, our business, results of operations, financial
condition, cash flows or prospects could be materially
adversely affected.
We may experience delays in production, transportation
and marketing.
Various production, transportation and marketing
conditions may cause delays in natural gas, NGLs and oil
production and adversely affect our business. For example,
the gas gathering systems that we own connect to other
pipelines or facilities which are owned and operated by
third parties. These pipelines and other midstream facilities
and others upon which we rely may become unavailable
because of testing, turnarounds, line repair, reduced
operating pressure, lack of operating capacity, regulatory
requirements, curtailments of receipt or deliveries due to
insufficient capacity or because of damage. In periods
where NGL prices are high, we benefit greatly from the
ability to process NGLs. Our largest processor of NGLs is
the MarkWest Energy Partners, L.P., (“MarkWest”) plant
located in Langley, Kentucky. If we were to lose the ability
to process NGLs at MarkWest’s plant during a period of
high pricing, our revenues would be negatively impacted.
As a short-term measure, we could divert the natural gas
through other pipeline routes; however, certain pipeline
operators would eventually decline to transport the gas due
to its liquid content at a level that would exceed tariff
specifications for those pipelines. The lack of available
capacity on third-party systems and facilities could reduce
the price offered for our production or result in the shut-in
of producing wells. Any significant changes affecting these
infrastructure systems and facilities, as well as any delays in
constructing new infrastructure systems and facilities, could
delay our production, which could negatively impact our
business, results of operations, financial condition, cash
flows or prospects.
We face production risks and hazards that may affect our
ability to produce natural gas, NGLs and oil at expected
levels, quality and costs that may result in additional
liabilities to us.
Our natural gas and oil production operations are subject to
numerous risks common to our industry, including, but not
limited to, premature decline of reservoirs, incorrect
production estimates, invasion of water into producing
formations, geological uncertainties such as unusual or
unexpected rock formations and abnormal geological
pressures, low permeability of reservoirs, contamination of
natural gas and oil, blowouts, oil and other chemical spills,

explosions, fires, equipment damage or failure, challenges
relating to transportation, pipeline infrastructure, natural
disasters, uncontrollable flows of oil, natural gas or well
fluids, adverse weather conditions, shortages of skilled
labor, delays in obtaining regulatory approvals or consents,
pollution and other environmental risks.
If any of the above events occur, environmental damage,
including biodiversity loss or habitat destruction, injury to
persons or property and other species and organisms, loss
of life, failure to produce natural gas, NGLs and oil in
commercial quantities or an inability to fully produce
discovered reserves could result. These events could also
cause substantial damage to our property or the property
of others and our reputation and put at risk some or all of
our interests in licenses, which enable us to produce, and
could result in the incurrence of fines or penalties, criminal
sanctions potentially being enforced against us and our
management, as well as other governmental and third-party
claims. Consequent production delays and declines from
normal field operating conditions and other adverse actions
taken by third parties may result in revenue and cash flow
levels being adversely affected.
Moreover, should any of these risks materialize, we could
incur legal defense costs, remedial costs and substantial
losses, including those due to injury or loss of life, human
health risks, severe damage to or destruction of property,
natural resources and equipment, environmental damage,
unplanned production outages, clean-up responsibilities,
regulatory investigations and penalties, increased public
interest in our operational performance and suspension of
operations, which could negatively impact our business,
results of operations, financial condition, cash flows
or prospects.
The levels of our natural gas and oil reserves and
resources, their quality and production volumes may be
lower than estimated or expected.
The reserves data as of December 31, 2023, 2022 and 2021
contained in this Annual Report & Form 20-F has been
audited by NSAI unless stated otherwise. The standards
utilized to prepare the reserves information that has been
extracted in this document may be different from the
standards of reporting adopted in other jurisdictions.
Investors, therefore, should not assume that the data found
in the reserves information set forth in this Annual Report &
Form 20-F is directly comparable to similar information that
has been prepared in accordance with the reserve reporting
standards of other jurisdictions, such as the United
Kingdom.
In general, estimates of economically recoverable natural
gas, NGLs and oil reserves are based on a number of factors
and assumptions made as of the date on which the reserves
estimates were determined, such as geological, geophysical
and engineering estimates (which have inherent
uncertainties), historical production from the properties or
analogous reserves, the assumed effects of regulation by
governmental agencies and estimates of future commodity
prices, operating costs, gathering and transportation costs
and production related taxes, all of which may vary
considerably from actual results.
Underground accumulations of hydrocarbons cannot be
measured in an exact manner and estimates thereof are a
subjective process aimed at understanding the statistical
probabilities of recovery. Estimates of the quantity of
economically recoverable natural gas and oil reserves, rates
of production and, where applicable, the timing of
development expenditures depend upon several variables
and assumptions, including the following:
—production history compared with production from other
comparable producing areas;
—quality and quantity of available data;
—interpretation of the available geological and
geophysical data;
—effects of regulations adopted by
governmental agencies;
—future percentages of sales;
—future natural gas, NGLs and oil prices;
—capital investments;
—effectiveness of the applied technologies and equipment;
—effectiveness of our field operations employees to
extract the reserves;
—natural events or the negative impacts of
natural disasters;
—future operating costs, tax on the extraction of
commercial minerals, development costs and workover
and remedial costs; and
—the judgment of the persons preparing the estimate.
As all reserve estimates are subjective, each of the
following items may differ materially from those assumed in
estimating reserves:
—the quantities and qualities that are ultimately recovered;
—the timing of the recovery of natural gas and oil reserves;
—the production and operating costs incurred;
—the amount and timing of development expenditures, to
the extent applicable;
—future hydrocarbon sales prices; and
—decommissioning costs and changes to regulatory
requirements for decommissioning.
Many of the factors in respect of which assumptions are
made when estimating reserves are beyond our control and
therefore these estimates may prove to be incorrect over
time. Evaluations of reserves necessarily involve multiple
uncertainties. The accuracy of any reserves evaluation
depends on the quality of available information and natural
gas, NGLs and oil engineering and geological interpretation.
Furthermore, less historical well production data is available
for unconventional wells because they have only become
technologically viable in the past twenty years and the
long-term production data is not always sufficient to
determine terminal decline rates. In comparison, some
conventional wells in our portfolio have been productive for
a much longer time. As a result, there is a risk that estimates
of our shale reserves are not as reliable as estimates of the
conventional well reserves that have a longer historical
profile to draw on. Interpretation, testing and production
after the date of the estimates may require substantial
upward or downward revisions in our reserves and
resources data. Moreover, different reserve engineers may
make different estimates of reserves and cash flows based
on the same available data. Actual production, revenues
and expenditures with respect to reserves will vary from
estimates and the variances may be material.
If the assumptions upon which the estimates of our natural
gas and oil reserves prove to be incorrect or if the actual
reserves available to us (or the operator of an asset in we
have an interest) are otherwise less than the current
estimates or of lesser quality than expected, we may be
unable to recover and produce the estimated levels or
quality of natural gas, NGLs or oil set out in this document
and this may materially and adversely affect our business,
results of operations, financial condition, cash flows
or prospects.
The PV-10, will not necessarily be the same as the current
market value of our estimated natural gas, NGL and
oil reserves.
You should not assume that the present value of future net
cash flows from our reserves is the current market value of
our estimated natural gas, NGL and oil reserves. Actual
future net cash flows from our natural gas and oil properties
will be affected by factors such as:
—actual prices we receive for natural gas, NGL and oil;
—actual cost of development and
production expenditures;
—the amount and timing of actual production;
—transportation and processing; and
—changes in governmental regulations or taxation.
The timing of both our production and our incurrence of
expenses in connection with the development and
production of our natural gas and oil properties will affect
the timing and amount of actual future net cash flows from
reserves, and thus their actual present value. In addition, the
10% discount factor we use when calculating discounted
future net cash flows may not be the most appropriate
discount factor based on interest rates in effect from time
to time and risks associated with us or the natural gas and
oil industry in general. Actual future prices and costs may
differ materially from those used in the present value
additional information regarding our use of PV-10.
We may face unanticipated increased or incremental costs
in connection with decommissioning obligations such
as plugging.
In the future, we may become responsible for costs
associated with abandoning and reclaiming wells, facilities
and pipelines which we use for the processing of natural gas
and oil reserves. With regards to plugging, we are party to
agreements with regulators in the states of Ohio, West
Virginia, Kentucky and Pennsylvania, four of our largest
wellbore states, setting forth plugging and abandonment
schedules spanning a period ranging from 10 to 15 years. We
will incur such decommissioning costs at the end of the
operating life of some of our properties. The ultimate
decommissioning costs are uncertain and cost estimates can
vary in response to many factors including changes to
relevant legal requirements, the emergence of new
restoration techniques, the shortage of plugging vendors,
difficult terrain or weather conditions or experience at other
production sites. The expected timing and amount of
expenditure can also change, for example, in response to
changes in reserves, wells losing commercial viability sooner
than forecasted or changes in laws and regulations or their
interpretation. As a result, there could be significant
adjustments to the provisions established which would affect
future financial results. The use of other funds to satisfy such
decommissioning costs may impair our ability to focus
capital investment in other areas of our business, which
could materially and adversely affect our business, results of
operations, financial condition, cash flows or prospects.
We may not be able to keep pace with technological
developments in our industry or be able to implement
them effectively.
The natural gas and oil industry is characterized by rapid
and significant technological advancements and
introductions of new products and services using new
technologies, such as emissions controls and processing
technologies. Rapid technological advancements in
information technology and operational technology
domains require seamless integration. Failure to integrate
these technologies efficiently may result in operational
inefficiencies, security vulnerabilities, and increased costs.
During mergers and acquisitions, integrating technology
assets from acquired companies can be complex. Poor
integration may lead to data inconsistencies, security gaps
and operational disruptions. Technology systems are also
susceptible to cybersecurity threats, including malware,
data breaches, and ransomware attacks. These threats may
disrupt operations, compromise sensitive data and lead to
significant financial losses. Further, inefficient data
management practices may result in data breaches, data
loss and missed opportunities for operational insights. The
presence of legacy technology systems can also pose
challenges, as they may lack modern security features,
making them vulnerable to cyber threats and necessitating
costly upgrades. As others use or develop new
technologies, we may be placed at a competitive
disadvantage or may be forced by competitive pressures to
implement those new technologies at substantial costs. In
addition, other natural gas and oil companies may have
greater financial, technical and personnel resources that
allow them to enjoy technological advantages, which may
in the future allow them to implement new technologies
before we can. Additionally, reliance on global supply
chains for information technology hardware, software and
operational technology equipment exposes the industry to
supply chain disruptions, shortages and cybersecurity risks.
A lowering or withdrawal of the ratings, outlook or watch
assigned to us or our debt by rating agencies may increase
our future borrowing costs and reduce our access to capital.
The rating, outlook or watch assigned to us or our debt
could be lowered or withdrawn entirely by a rating agency
if, in that rating agency’s judgment, current or future
circumstances relating to the basis of the rating, outlook, or
watch such as adverse changes to our business, so warrant.
Our credit ratings may also change as a result of the
differing methodologies or changes in the methodologies
used by the rating agencies. Any future lowering of our
debt’s ratings, outlook or watch likely would make it more
difficult or more expensive for us to obtain additional
debt financing.
It is also possible that such ratings may be lowered in
connection with this listing or in connection with future
events, such as future acquisitions. Holders of our ordinary
shares will have no recourse against us or any other parties
in the event of a change in or suspension or withdrawal of
such ratings. Any lowering, suspension or withdrawal of
such ratings may have an adverse effect on the market
price or marketability of our ordinary shares.
If we do not have access to capital on favorable terms, on
the timeline we require, or at all, our financial condition
and results of operations could be materially
adversely affected.
We require capital to complete acquisitions that we believe
will enhance shareholder return. Significant volatility or
disruption in the global financial markets may result in us not
being able to obtain additional financing on favorable terms,
on the timeline we anticipate, or at all, and we may not be
able to refinance, if necessary, any outstanding debt when
due, all of which could have a material adverse effect on our
financial condition. Any inability to obtain additional funding
on favorable terms, on the timeline we anticipate, or at all,
may prevent us from acquiring new assets, cause us to
curtail our operations significantly, reduce planned capital
expenditures or obtain funds through arrangements that
management does not currently anticipate, including
disposing of our assets, the occurrence of any of which may
significantly impair our ability to deliver shareholder returns.
If our operating results falter, our cash flow or capital
resources prove inadequate, or if interest rates increase
significantly, we could face liquidity problems that could
materially and adversely affect our results of operations and
financial condition.
Deterioration in the economic conditions in any of the
industries in which our customers operate, a domestic or
worldwide financial downturn, or negative credit market
conditions could have a material adverse effect on our
liquidity, results of operations, business and financial
condition that we cannot predict.
Economic conditions in a number of industries in which our
customers operate have experienced substantial
deterioration in the past, resulting in reduced demand for
natural gas and oil. Renewed or continued weakness in the
economic conditions of any of the industries we serve or
that are served by our customers, or the increased focus by
markets on carbon-neutrality, could adversely affect our
business, financial condition, results of operation and
liquidity in a number of ways. For example:
—demand for natural gas and electricity in the United
States is impacted by industrial production, which if
weakened would negatively impact the revenues,
margins and profitability of our natural gas business;
—a decrease in international demand for natural gas or
NGLs produced in the United States could adversely
affect the pricing for such products, which could
adversely affect our results of operations and liquidity;
—the tightening of credit or lack of credit availability to
our customers could adversely affect our liquidity, as our
ability to receive payment for our products sold and
delivered depends on the continued creditworthiness of
our customers;
—our ability to refinance our Credit Facility may be limited
and the terms on which we are able to do so may be less
favorable to us depending on the strength of the capital
markets or our credit ratings;
—our ability to access the capital markets may be
restricted at a time when we would like, or need, to raise
capital for our business including for exploration and/or
development of our natural gas reserves;
—increased capital markets scrutiny of oil and gas
companies may lead to increased costs of capital or lack
of credit availability; and
—a decline in our creditworthiness may require us to post
letters of credit, cash collateral, or surety bonds to
secure certain obligations, all of which would have an
adverse effect on our liquidity.

Our operations are subject to a series of risks relating to
climate change.
Continued public concern regarding climate change and
potential mitigation through regulation could have a
material impact on our business. International agreements,
national, regional, state and local legislation, and regulatory
measures to limit GHG emissions are currently in place or in
various stages of discussion or implementation. For
example, the Inflation Reduction Act, which was signed into
law in August 2022, includes a “methane fee” that is
expected to be imposed beginning with emissions reported
for calendar year 2024. In addition, the current U.S.
administration has proposed more stringent methane
pollution limits for new and existing gas and oil operations.
Given that some of our operations are associated with
emissions of GHGs, these and other GHG emissions-related
laws, policies and regulations may result in substantial
capital, compliance, operating and maintenance costs. The
level of expenditure required to comply with these laws and
regulations is uncertain and is expected to vary depending
on the laws enacted by particular countries, states,
provinces and municipalities.
Additionally, regulatory, market and other changes to
respond to climate change may adversely impact our
business, financial condition or results of operations.
Reporting expectations are also increasing, with a variety of
customers, capital providers and regulators seeking
increased information on climate-related risks. For example,
the SEC has adopted climate-related disclosures rules that
may require us to incur significant costs to assess and
disclose on a range of climate-related data and risks.
Internationally, the United Nations-sponsored “Paris
Agreement” requires member nations to individually
determine and submit non-binding emissions reduction
targets every five years after 2020. President Biden has
recommitted the United States to the Paris Agreement and,
in April 2021, announced a goal of reducing the United
States’ emissions by 50-52% below 2005 levels by 2030. In
November 2021, the international community gathered in
Glasgow at the 26th Conference of the Parties to the UN
Framework Convention on Climate Change, during which
multiple announcements were made, including a call for
parties to eliminate certain fossil fuel subsidies and pursue
further action on non-carbon dioxide GHGs. Relatedly, the
United States and European Union jointly announced the
launch of the “Global Methane Pledge,” which aims to cut
global methane pollution at least 30% by 2030 relative to
2020 levels, including “all feasible reductions” in the energy
sector. Such commitments were re-affirmed at the 27th
Conference of the Parties in Sharm El Sheikh. The emission
reduction targets and other provisions of legislative or
regulatory initiatives and policies enacted in the future by
the United States or states in which we operate, could
adversely impact our business by imposing increased costs
in the form of higher taxes or increases in the prices of
emission allowances, limiting our ability to develop new gas
and oil reserves, transport hydrocarbons through pipelines
or other methods to market, decreasing the value of our
assets, or reducing the demand for hydrocarbons and
refined petroleum products. With increased pressure to
reduce GHG emissions by replacing fossil fuel energy
generation with alternative energy generation, it is possible
that peak demand for gas and oil will be reached, and gas
and oil prices will be adversely impacted as and when this
happens. Further, the consequences of the effects of global
climate change, and the continued political and societal
attention afforded to mitigating the effects of climate
change, may generate adverse investor and stakeholder
sentiment towards the hydrocarbon industry and negatively
impact the ability to invest in the sector. Similarly, longer
term reduction in the demand for hydrocarbon products
due to the pace of commercial deployment of alternative
energy technologies or due to shifts in consumer
preference for lower GHG emissions products could reduce
the demand for the hydrocarbons that we produce.
Additionally, the SEC’s proposed climate rule published in
March 2022, requiring disclosure of a range of climate
related risks, is expected to be finalized late-2023. We are
currently assessing this rule, and at this time we cannot
predict the costs of implementation or any potential
adverse impacts resulting from the rule. To the extent this
rule is finalized as proposed, we or our customers could
incur increased costs related to the assessment and
disclosure of climate-related risks. Additionally, enhanced
climate disclosure requirements could accelerate the trend
of certain stakeholders and lenders restricting or seeking
more stringent conditions with respect to their investments
in certain carbon intensive sectors.
Further, in response to concerns related to climate change,
companies in the fossil fuel sector may be exposed to
increasing financial risks. Financial institutions, including
investment advisors and certain sovereign wealth, pension
and endowment funds, may elect in the future to shift some
or all of their investment into non-fossil fuel related sectors.
Institutional lenders who provide financing to fossil-fuel
energy companies have also become more attentive to
sustainable lending practices, and some of them may elect in
the future not to provide funding for fossil fuel energy
companies. There is also a risk that financial institutions will
be required to adopt policies that have the effect of
reducing the funding provided to the fossil fuel sector. In
2021, President Biden signed an executive order calling for
the development of a “climate finance plan,” and, separately,
the Federal Reserve announced in 2020 that it has joined the
Network for Greening the Financial System, a consortium of
financial regulators focused on addressing climate-related
risks in the financial sector. A material reduction in the
capital available to the fossil fuel industry could make it more
difficult to secure funding for exploration, development,
production, and transportation activities, which could in turn
negatively affect our operations.
The Group may also be subject to activism from
environmental non-governmental organizations (“NGOs”)
campaigning against fossil fuel extraction or negative
publicity from media alleging inadequate remedial actions to
retire non-producing wells effectively, which could affect our
reputation, disrupt our programs, require us to incur
significant, unplanned expense to respond or react to
intentionally disruptive campaigns or media reports, create
blockades to interfere with operations or otherwise
negatively impact our business, results of operations,
financial condition, cash flows or prospects. Litigation risks
are also increasing as a number of entities have sought to
bring suit against various oil and natural gas companies in
state or federal court, alleging among other things, that such
companies created public nuisances by producing fuels that
contributed to climate change or alleging that the companies
have been aware of the adverse effects of climate change for
some time but defrauded their investors or customers by
failing to adequately disclose those impacts.
Finally, our operations are subject to disruption from the
physical effects that may be caused or aggravated by
climate change. These include risks from extreme weather
events, such as hurricanes, severe storms, floods, heat
waves, and ambient temperature increases, as well as
wildfires, each of which may become more frequent or
more severe as a result of climate change.
We rely on third-party infrastructure that we do not
control and/or, in each case, are subject to tariff charges
that we do not control.
A significant portion of our production passes through
third-party owned and controlled infrastructure. If these
third-party pipelines or liquids processing facilities
experience any event that causes an interruption in
operations or a shut-down such as mechanical problems, an
explosion, adverse weather conditions, a terrorist attack or
labor dispute, our ability to produce or transport natural gas
could be severely affected. For example, we have an
agreement with a third-party where approximately 49% of
the NGLs we sold during the year ending December 31, 2023
were processed at the third-party’s facility in Kentucky. Any
material decrease in our ability to process or transport our
natural gas through third-party infrastructure could have a
material adverse effect on our business, results of
operations, financial condition, cash flows or prospects.
Our use of third-party infrastructure may be subject to tariff
charges. Although we seek to manage our flow via our
midstream infrastructure, we may not always be able to
avoid higher tariffs or basis blowouts due to the lack of
interconnections. In such instances, the tariff charges can be
substantial and the cost is not subject to our direct control,
although we may have certain contractual or governmental
protections and rights. Generally, the operator of the
gathering or transmission pipelines sets these tariffs and
expenses on a cost sharing basis according to our
proportionate hydrocarbon through-put of that facility. A
provisional tariff rate is applied during the relevant year and
then finalized the following year based on the actual final
costs and final through-put volumes. Such tariffs are
dependent on continued production from assets owned by
third parties and, may be priced at such a level as to lead to
production from our assets ceasing to be economic and thus
may have a material adverse effect on our business, results
of operations, financial condition, cash flows or prospects.
Furthermore, our use of third-party infrastructure exposes
us to the possibility that such infrastructure will cease to be
operational or be decommissioned and therefore require us
to source alternative export routes and/or prevent
economic production from our assets. This could also have
a material adverse effect on our business, results of
operations, financial condition, cash flows or prospects.
Failure by us, our contractors or our primary offtakers to
obtain access to necessary equipment and transportation
systems could materially and adversely affect our
business, results of operations, financial condition, cash
flows or prospects.
We rely on our natural gas and oil field suppliers and
contractors to provide materials and services that facilitate
our production activities, including plugging and
abandonment contractors. Any competitive pressures on
the oil field suppliers and contractors could result in a
material increase of costs for the materials and services
required to conduct our business and operations. For
example, we are dependent on the availability of plugging
vendors to help us satisfy abandonment schedules that we
have agreed to with the states of Ohio, West Virginia,
Kentucky and Pennsylvania. Such personnel and services
can be scarce and may not be readily available at the times
and places required. Future cost increases could have a
material adverse effect on our asset retirement liability,
operating income, cash flows and borrowing capacity and
may require a reduction in the carrying value of our
properties, our planned level of spending for development
and the level of our reserves. Prices for the materials and
services we depend on to conduct our business may not be
sustained at levels that enable us to operate profitably.
We and our offtakers rely, and any future offtakers will rely,
upon the availability of pipeline and storage capacity
systems, including such infrastructure systems that are
owned and operated by third parties. As a result, we may
be unable to access or source alternatives for the
infrastructure and systems which we currently use or plan
to use, or otherwise be subject to interruptions or delays in
the availability of infrastructure and systems necessary for
the delivery of our natural gas, NGLs and oil to commercial
markets. In addition, such infrastructure may be close to its
design life and decisions may be taken to decommission
such infrastructure or perform life extension work to
maintain continued operations. Any of these events could
result in disruptions to our projects and thereby impact our
ability to deliver natural gas, NGLs and oil to commercial
markets and/or may increase our costs associated with the
production of natural gas, NGLs and oil reliant upon such
infrastructure and systems. Further, our offtakers could
become subject to increased tariffs imposed by
government regulators or the third-party operators or
owners of the transportation systems available for the
transport of our natural gas, NGLs and oil, which could
result in decreased offtaker demand and downward
pricing pressure.
If we are unable to access infrastructure systems facilitating
the delivery of our natural gas, NGLs and oil to commercial
markets due to our contractors or primary offtakers being
unable to access the necessary equipment or transportation
systems, our operations will be adversely affected. If we are
unable to source the most efficient and expedient
infrastructure systems for our assets then delivery of our
natural gas, NGLs and oil to the commercial markets may
be negatively impacted, as may our costs associated with
the production of natural gas, NGLs and oil reliant upon
such infrastructure and systems.
A proportion of our equipment has substantial prior use
and significant expenditure may be required to maintain
operability and operations integrity.
A part of our business strategy is to optimize or refurbish
producing assets where possible to maximize the efficiency
of our operations while avoiding significant expenses
associated with purchasing new equipment. Our producing
assets and midstream infrastructure require ongoing
maintenance to ensure continued operational integrity. For
example, some older wells may struggle to produce suitable
line pressure and will require the addition of compression to
push natural gas. Despite our planned operating and capital
expenditures, there can be no guarantee that our assets or
the assets we use will continue to operate without fault and
not suffer material damage in this period through, for
example, wear and tear, severe weather conditions, natural
disasters or industrial accidents. If our assets, or the assets
we use, do not operate at or above expected efficiencies,
we may be required to make substantial expenditures
beyond the amounts budgeted. Any material damage to
these assets or significant capital expenditure on these
assets for improvement or maintenance may have a
material adverse effect on our business, results of
operations, financial condition, cash flows or prospects. In
addition, as with planned operating and capital expenditure,
there is no guarantee that the amounts expended will
ensure continued operation without fault or address the
effects of wear and tear, severe weather conditions, natural
disasters or industrial accidents. We cannot guarantee that
such optimization or refurbishment will be commercially
feasible to undertake in the future and we cannot provide
assurance that we will not face unexpected costs during the
optimization or refurbishment process.
We depend on our directors, key members of
management, independent experts, technical and
operational service providers and on our ability to retain
and hire such persons to effectively manage our
growing business.
Our future operating results depend in significant part upon
the continued contribution of our directors, key senior
management and technical, financial and operations
personnel. Management of our growth will require, among
other things, stringent control of financial systems and
operations, the continued development of our control
environment, the ability to attract and retain sufficient
numbers of qualified management and other personnel, the
continued training of such personnel and the presence of
adequate supervision.
In addition, the personal connections and relationships of
our directors and key management are important to the
conduct of our business. If we were to unexpectedly lose a
member of our key management or fail to maintain one of
the strategic relationships of our key management team,
our business, results of operations, financial condition, cash
flows or prospects could be materially adversely affected.
In particular, we are highly dependent on our Chief
Executive Officer, Robert Russell (“Rusty”) Hutson, Jr.
Acquisitions are a key part of our strategy, and Mr. Hutson
has been instrumental in sourcing them and securing their
financing. Furthermore, as our founder, Mr. Hutson is
strongly associated with our success, and if he were to
cease being the Chief Executive Officer, perception of our
future prospects may be diminished. We maintain a “key
person” life insurance policy on Mr. Hutson, but not any
other of our employees. As a result, we are insured against
certain losses resulting from the death of Mr. Hutson, but
not any of our other employees.
Attracting and retaining additional skilled personnel will be
fundamental to the continued growth and operation of our
business. We require skilled personnel in the areas of
development, operations, engineering, business
development, natural gas, NGLs and oil marketing, finance
and accounting relating to our projects. Personnel costs,
including salaries, are increasing as industry wide demand
for suitably qualified personnel increases. We may not
successfully attract new personnel and retain existing
personnel required to continue to expand our business and
to successfully execute and implement our
business strategy.
We may face unanticipated water and other waste
disposal costs.
We may be subject to regulation that restricts our ability to
discharge water produced as part of our natural gas, oil and
NGL production operations. Productive zones frequently
contain water that must be removed for the natural gas, oil
and NGL to produce, and our ability to remove and dispose
of sufficient quantities of water from the various zones will
determine whether we can produce natural gas, oil and NGL
in commercial quantities. The produced water must be
transported from the leasehold and/or injected into
disposal wells. The availability of disposal wells with
sufficient capacity to receive all of the water produced from
our wells may affect our ability to produce our wells. Also,
the cost to transport and dispose of that water, including
the cost of complying with regulations concerning water
disposal, may reduce our profitability. We have entered into
various water management services agreements in the
Appalachian Basin which provide for the disposal of our
produced water by established counterparties with large
integrated pipeline networks. If these counterparties fail to
perform, we may have to shut in wells, reduce drilling
activities, or upgrade facilities for water handling or
treatment. The costs to dispose of this produced water may
increase for a number of reasons, including if new laws and
regulations require water to be disposed in a
different manner.

In 2016, the EPA adopted effluent limitations for the
treatment and discharge of wastewater resulting from
onshore unconventional natural gas, oil and NGL extraction
facilities to publicly owned treatment works. In addition, the
injection of fluids gathered from natural gas, oil and NGL
producing operations in underground disposal wells has
been identified by some groups and regulators as a
potential cause of increased seismic events in certain areas
of the country, including the states of West Virginia, Ohio
and Kentucky in the Appalachian Basin as well as
Oklahoma, Texas and Louisiana in our Central Region.
Certain states, including those located in the Appalachian
Basin have adopted, or are considering adopting, laws and
regulations that may restrict or prohibit oilfield fluid
disposal in certain areas or underground disposal wells, and
state agencies implementing those requirements may issue
orders directing certain wells in areas where seismic events
have occurred to restrict or suspend disposal well permits
or operations or impose certain conditions related to
disposal well construction, monitoring, or operations. Any
of these developments could increase our cost to dispose
of our produced water.
We may incur significant costs and liabilities resulting
from performance of pipeline integrity programs and
related repairs.
Pursuant to the authority under the Natural Gas Pipeline
Safety Act of 1968 (“NGPSA”) and Hazardous Liquid
Pipeline Safety Act of 1979 (“HLPSA”), as amended by the
Pipeline Safety Improvement Act of 2002 (“PSIA”), the
Pipeline Inspection, Protection, Enforcement and Safety Act
of 2006 (“PIPESA”) and the Pipeline Safety, Regulatory
Certainty, and Job Creation Act of 2011 (the “2011 Pipeline
Safety Act”), the Pipeline and Hazardous Materials Safety
Administration (“PHMSA”) has promulgated regulations
requiring pipeline operators to develop and implement
integrity management programs for certain gas and
hazardous liquid pipelines that, in the event of a pipeline
leak or rupture could affect high consequence areas
(“HCAs”), which are areas where a release could have the
most significant adverse consequences, including high-
population areas, certain drinking water sources and
unusually sensitive ecological areas. These regulations
require operators of covered pipelines to:
—perform ongoing assessments of pipeline integrity;
—identify and characterize applicable threats to pipeline
segments that could impact HCAs;
—improve data collection, integration and analysis;
—repair and remediate the pipeline as necessary; and
—implement preventive and mitigating actions.
In addition, states have adopted regulations similar to
existing PHMSA regulations for certain intrastate gas and
hazardous liquid pipelines. At this time, we cannot predict
the ultimate cost of compliance with applicable pipeline
integrity management regulations, as the cost will vary
significantly depending on the number and extent of any
repairs found to be necessary as a result of pipeline
integrity testing, but the results of these tests could cause
us to incur significant and unanticipated capital and
operating expenditures for repairs or upgrades deemed
necessary to ensure the safe and reliable operation of
our pipelines.
The 2011 Pipeline Safety Act amends the NGPSA and HLPSA
pipeline safety laws, requiring increased safety measures for
gas and hazardous liquids pipelines. Among other things,
the 2011 Pipeline Safety Act directs the Secretary of
Transportation to promulgate regulations relating to
expanded integrity management requirements, automatic
or remote-controlled valve use, excess flow valve use, leak
detection system installation, testing to confirm the material
strength of certain pipelines, and operator verification of
records confirming the maximum allowable pressure of
certain intrastate gas transmission pipelines. Additionally,
pursuant to one of the requirements of the 2011 Pipeline
Safety Act, in May 2016, PHMSA proposed rules that would,
if adopted, impose more stringent requirements for certain
gas lines, extend certain of PHMSA’s current regulatory
safety programs for gas pipelines beyond HCAs to cover
gas pipelines found in newly defined “moderate
consequence areas” that contain as few as five dwellings
within the potential impact area and require gas pipelines
installed before 1970 that were exempted from certain
pressure testing obligations to be tested to determine their
maximum allowable operating pressures (“MAOP”). Other
requirements proposed by PHMSA under the rulemaking
include: reporting to PHMSA in the event of certain MAOP
exceedances; strengthening PHMSA integrity management
requirements; considering seismicity in evaluating threats to
a pipeline; conducting hydrostatic testing for all pipeline
segments manufactured using longitudinal seam welds; and
using more detailed guidance from PHMSA in the selection
of assessment methods to inspect pipelines. The proposed
rulemaking also seeks to impose a number of requirements
on gathering lines. In January 2017, PHMSA finalized new
regulations for hazardous liquid pipelines that significantly
extend and expand the reach of certain PHMSA integrity
management requirements (i.e., periodic assessments,
repairs and leak detection), regardless of the pipeline’s
proximity to an HCA. The final rule also requires all pipelines
in or affecting an HCA to be capable of accommodating in-
line inspection tools within the next 20 years. In addition,
the final rule extends annual and accident reporting
requirements to gravity lines and all gathering lines and also
imposes inspection requirements on pipelines in areas
affected by extreme weather events and natural disasters,
such as hurricanes, landslides, floods, earthquakes, or other
similar events that are likely to damage infrastructure
PHMSA regularly revises its pipeline safety regulations. For
example, in June 2016, the President signed the Protecting
our Infrastructure of Pipelines and Enhancing Safety Act of
2016 (the “2016 PIPES Act”) into law. The 2016 PIPES Act
reauthorizes PHMSA through 2019, and facilitates greater
pipeline safety by providing PHMSA with emergency order
authority, including authority to issue prohibitions and
safety measures on owners and operators of gas or
hazardous liquid pipeline facilities to address imminent
hazards, without prior notice or an opportunity for a
hearing, as well as enhanced release reporting requirements,
requiring a review of both natural gas and hazardous liquid
integrity management programs, and mandating the
creation of a working group to consider the development of
an information-sharing system related to integrity risk
analyses. The 2016 PIPES Act also requires that PHMSA
publish periodic updates on the status of those mandates
outstanding from the 2011 Pipeline Safety Act PHMSA has
recently published three parts of its so-called “Mega Rule,”
including rules focused on: the safety of gas transmission
pipelines, the safety of hazardous liquid pipelines and
enhanced emergency order procedures. PHMSA finalized
the first part of the rule, which primarily addressed
maximum operating pressure and integrity management
near HCAs for onshore gas transmission pipelines, in
October 2019. PHMSA finalized the second part of the rule,
which extended federal safety requirements to onshore gas
gathering pipelines with large diameters and high operating
pressures, in November 2021. PHMSA published the final of
the three components of the Mega Rule in August 2022,
which took effect in May 2023. The final rule applies to
onshore gas transmission pipelines, and clarifies integrity
management regulations, expands corrosion control
requirements, mandates inspection after extreme weather
events, and updates existing repair criteria for both HCA
and non-HCA pipelines. Finally, PHMSA published a Notice
of Proposed Rulemaking regarding more stringent gas
pipeline leak detection and repair requirements to reduce
natural gas emissions on May 18, 2023.
At this time, we cannot predict the cost of such
requirements, but they could be significant. Moreover,
federal and state legislative and regulatory initiatives
relating to pipeline safety that require the use of new or
more stringent safety controls or result in more stringent
enforcement of applicable legal requirements could subject
us to increased capital costs, operational delays and costs
of operation.
Moreover as of January 2023, the maximum civil penalties
PHMSA can impose are $257,664 per pipeline safety
violation per day, with a maximum of $2,576,627 for a
related series of violations. The safety enhancement
requirements and other provisions of the 2011 Pipeline
Safety Act as well as any implementation of PHMSA
regulations thereunder or any issuance or reinterpretation
of guidance by PHMSA or any state agencies with respect
thereto could require us to install new or modified safety
controls, pursue additional capital projects or conduct
maintenance programs on an accelerated basis, any or all of
which tasks could result in our incurring increased
operating costs that could have a material adverse effect
on our results of operations or financial position. States are
also pursuing regulatory programs intended to safely build
pipeline infrastructure. The adoption of new or amended
regulations by PHMSA or the states that result in more
stringent or costly pipeline integrity management or safety
standards could have a significant adverse effect on us and
similarly situated midstream operators.
We are currently operating in a period of economic
uncertainty and capital markets disruption, which has been
significantly impacted by geopolitical instability due to
the ongoing military conflict between Russia and Ukraine,
and more recently, the Israel-Hamas war. Our business
may be adversely affected by any negative impact on the
global economy and capital markets resulting from the
conflict in Ukraine or any other geopolitical tensions.
U.S. and global markets are experiencing volatility and
disruption following the escalation of geopolitical tensions
and the start of the military conflict between Russia and
Ukraine. In February 2022, a full-scale military invasion of
Ukraine by Russian troops transpired. Although the length
and impact of the ongoing military conflict is highly
unpredictable, the conflict in Ukraine has led, and could
continue to lead, to market disruptions, including significant
volatility in commodity prices, credit and capital markets, as
well as supply chain interruptions.
Additionally, Russia’s prior annexation of Crimea, recent
recognition of two separatist republics in the Donetsk and
Luhansk regions of Ukraine and subsequent military
interventions in Ukraine have led to sanctions and other
penalties being levied by the United States, European Union
and other countries against Russia, Belarus, the Crimea
Region of Ukraine, the so-called Donetsk People’s Republic,
and the so-called Luhansk People’s Republic, including
agreement to remove certain Russian financial institutions
from the Society for Worldwide Interbank Financial
Telecommunication (“SWIFT”) payment system, expansive
bans on imports and exports of products to and from
Russia and bans on the exportation of U.S. denominated
banknotes to Russia or persons located there. Additional
potential sanctions and penalties have also been proposed
and/or threatened. Russian military actions and the
resulting sanctions could adversely affect the global
economy and financial markets and lead to instability and
lack of liquidity in capital markets, potentially making it
more difficult for us to obtain additional funds.
Additionally, on October 7, 2023, Hamas, a U.S. designated
terrorist organization, launched a series of coordinated
attacks from the Gaza Strip onto Israel. On October 8, 2023,
Israel formally declared war on Hamas, and the armed
conflict is ongoing as of the date of this filing. Hostilities
between Israel and Hamas could escalate and involve
surrounding countries in the Middle East. We are actively
monitoring the situation in Ukraine and Israel and assessing
their impact on our business. To date we have not
experienced any material interruptions in our infrastructure,
supplies, technology systems or networks needed to
support our operations given our operating areas are
exclusively located within the Central Region and the
Appalachian Basins of the U.S. We have no way to predict
the progress or outcome of the conflicts in Ukraine or Israel
or their impacts in Ukraine, Russia, Belarus, Israel or the
Gaza Strip as the conflicts, and any resulting government
reactions, are rapidly developing and beyond our control.
The extent and duration of the military actions, sanctions
and resulting market disruptions could be significant and
could potentially have substantial impact on the global
economy and our business for an unknown period of time.
Any of the aforementioned factors could affect our
business, financial condition and results of operations. Any
such disruptions may also magnify the impact of other risks
described in this Annual Report & Form 20-F.
Risks Relating to Our Financing, Acquisitions, Investment
and Indebtedness
Inflation may adversely affect us by increasing costs
beyond what we can recover through price increases and
limit our ability to enter into future debt financing.
Inflation can adversely affect us by increasing costs of
materials, equipment, labor and other services. In addition,
inflation is often accompanied by higher interest rates.
Continued inflationary pressures could impact our
profitability. Though we believe that the rates of inflation in
recent years, including the 12 months ended December 31,
2023, have not had a significant impact on our operations, a
continued increase in inflation, including inflationary
pressure on labor, could result in increases to our operating
costs, and we may be unable to pass these costs on to our
customers. These inflationary pressures could also
adversely impact our ability to procure materials and
equipment in a cost-effective manner, which could result in
reduced margins and production delays and, as a result, our
business, financial condition, results of operations and cash
flows could be materially and adversely affected. We
continue to undertake actions and implement plans to
address these inflationary pressures and protect the
requisite access to materials and equipment. With respect
to our costs of capital, our ABS Notes (as defined below)
are fixed-rate instruments (subject to adjustment pursuant
to the sustainability-linked features described under
2023 we had $159 million outstanding on our Credit Facility.
Nevertheless, inflation may also affect our ability to enter
into future debt financing, including refinancing of our
Credit Facility or issuing additional SPV-level asset backed
securities, as high inflation may result in a relative increase
in the cost of debt capital.
We are taking efforts to mitigate inflationary pressures, by
working closely with other suppliers and service providers
to ensure procurement of materials and equipment in a
cost-effective manner. However, these mitigation efforts
may not succeed or may be insufficient.
Concerns about global economic growth have had a
significant adverse impact on global financial markets and
commodity prices. If the economic climate in the United
States or abroad deteriorates, worldwide demand for
petroleum products could diminish further, which could
impact the price at which natural gas, NGLs and oil can be
sold, which could affect our results of operations, financial
condition, cash flows and prospects.
There are risks inherent in our acquisitions of natural gas
and oil assets.
Acquisitions are an essential part of our strategy for
protecting and growing cash flow, particularly in relation to
the risk that some of our wells may have a higher than
anticipated production decline rate. Over the past several
years, we have undertaken a number of acquisitions of
natural gas and oil assets (and of companies holding such
assets), including, but not limited to the acquisition of
certain assets of Carbon Energy Corporation (the “Carbon
Acquisition”), the acquisition of certain assets and
infrastructure of EQT Corporation (the “EQT Acquisition”),
the acquisition of certain assets from Triad Hunter, LLC (the
“Utica Acquisition”), the acquisition of 51.25% working
interest in certain assets and infrastructure from Indigo
Minerals LLC (the “Indigo Acquisition”), the acquisition of
certain assets and infrastructure from Blackbeard Operating
LLC (the “Blackbeard Acquisition”), the acquisition of
51.25% working interest in certain assets, infrastructure,
equipment and facilities in conjunction with Oaktree from
Tanos Energy Holdings III, LLC (the “Tanos Acquisition”),
the acquisition of 51.25% working interest in certain assets,
infrastructure, equipment and facilities in conjunction with
Oaktree from Tapstone Energy Holdings LLC (the
“Tapstone Acquisition”), the acquisition of 52.5% working
interest in certain upstream assets and related facilities
within the Central Region from a private seller, in
conjunction with Oaktree (the “East Texas Assets
Acquisition”), the acquisition of certain upstream assets and
related infrastructure within the Central Region from Tanos
Energy Holdings II LLC (the “Tanos II Acquisition”) and the
acquisition of certain upstream assets and related gathering
infrastructure in the Central Region from ConocoPhillips
(the “ConocoPhillips Acquisition”). Our ability to complete
future acquisitions will depend on us being able to identify
suitable acquisition candidates and negotiate favorable
terms for their acquisition, in each case, before any
attractive candidates are purchased by other parties such
as private equity firms, some of whom have substantially
greater financial and other resources than we do. We may
face competition for attractive acquisition targets that may
also increase the price of the target business. As a result,
there is no assurance that we will always be able to source
and execute acquisitions in the future at
attractive valuations.
Furthermore, to further the Group’s growth, we have made
further acquisitions outside the Appalachian Basin, a region
in which we have developed our operational experience
into the Bossier Shale, the Haynesville Shale, the Barnett
Shale Play, and the Cotton Valley and Mid-Continent
producing areas. Accordingly, an acquisition in a new area
in which we lack experience may present unanticipated
risks and challenges that were not accounted for or
previously experienced. Ordinarily, our due diligence efforts
are focused on higher valued and material properties or
assets. Even an in-depth review of all properties and
records may not reveal all existing or potential problems,
nor will such review always permit a buyer to become
sufficiently familiar with the properties to fully assess their
deficiencies and capabilities. Generally, physical inspections
are not performed on every well or facility, and structural or
environmental problems are not necessarily observable
even when an inspection is undertaken.
There can be no assurance that our prior acquisitions or any
other potential acquisition will perform operationally as
anticipated or be profitable. We could fail to appropriately
value any acquired business and the value of any business,
company or property that we acquire or invest in may
actually be less than the amount paid for it or its estimated
production capacity. We may be required to assume pre-
closing liabilities with respect to an acquisition, including
known and unknown title, contractual, and environmental
and decommissioning liabilities, and may acquire interests
in properties on an “as is” basis without recourse to the
seller of such interest or the seller may have limited
resources to provide post-sale indemnities.
In addition, successful acquisitions of gas and oil assets
require an assessment of a number of factors, including
estimates of recoverable reserves, the time of recovering
reserves, exploration potential, future natural gas, NGLs and
oil prices and operating costs. Such assessments are
inexact, and we cannot guarantee that we make these
assessments with a high degree of accuracy. In connection
with assessments, we perform a review of the acquired
assets. However, such a review will not reveal all existing or
potential problems. Furthermore, review may not permit us
to become sufficiently familiar with the assets to fully
assess their deficiencies and capabilities.
Integrating operations, technology, systems, management,
back office personnel and pre- or post-completion costs for
future acquisitions may prove more difficult or expensive
than anticipated, thereby rendering the value of any
company or assets acquired less than the amount paid. We
may also take on unexpected liabilities which are uncapped,
have to undertake unanticipated capital expenditures in
connection with a new acquisition or provide uncapped
liabilities in connection with the purchase and sale of assets,
which are customary in such agreements. The integration of
acquired businesses or assets requires significant time and
effort on the part of our management. Following such
integration efforts, prior acquisitions may still not achieve
the level of financial or operational performance that was
anticipated when they were acquired. In addition, the
integration of new acquisitions can be difficult and disrupt
our own business because our operational and business
culture may differ from the cultures of the acquired
businesses, unpopular cost-cutting measures may be
required, internal controls may be more difficult to maintain
and control over cash flows and expenditures may be
difficult to establish. If we encounter any of the foregoing
issues in relation to one of our acquisitions this could have a
material adverse effect on our business, results of
operations, financial condition, cash flows or prospects.
We may be unable to make attractive acquisitions or
successfully integrate acquired businesses, and any
inability to do so may disrupt our business and hinder our
ability to grow.
In the future we may make acquisitions of businesses that
complement or expand our current business. However, we
may not be able to identify attractive acquisition
opportunities. Even if we do identify attractive acquisition
opportunities, we may not be able to complete the
acquisition or do so on commercially acceptable terms.
The success of any completed acquisition will depend on
our ability to integrate effectively the acquired business
into our existing operations. The process of integrating
acquired businesses may involve unforeseen difficulties and
may require a disproportionate amount of our managerial
and financial resources. In addition, possible future
acquisitions may be larger and for purchase prices
significantly higher than those paid for earlier acquisitions.
No assurance can be given that we will be able to identify
additional suitable acquisition opportunities, negotiate
acceptable terms, obtain financing for acquisitions on
acceptable terms or successfully acquire identified targets.
Our failure to achieve consolidation savings, to integrate
the acquired businesses and assets into our existing
operations successfully or to minimize any unforeseen
operational difficulties could have a material adverse effect
on our financial condition and results of operations.
Our Credit Facility also limits our ability to incur certain
indebtedness, which could indirectly limit our ability to
engage in acquisitions of businesses.
We may not have good title to all our assets and licenses.
Although we believe that we take due care and conduct
due diligence on new acquisitions in a manner that is
consistent with industry practice, there can be no assurance
that we have good title to all our assets and the rights to
develop and produce natural gas and oil from our assets.
Such reviews are inherently incomplete and it is generally
not feasible to review in depth every individual well or field
involved in each acquisition. There can be no assurance that
any due diligence carried out by us or by third parties on
our behalf in connection with any assets that we acquire
will reveal all of the risks associated with those assets, and
the assets may be subject to preferential purchase rights,
consents and title defects that were not apparent at the
time of acquisition. We may acquire interests in properties
on an “as is” basis without recourse to the seller of such
interest or the seller may have limited resources to provide
post-sale indemnities. In addition, changes in law or change
in the interpretation of law or political events may arise to
defeat or impair our claim to certain properties which we
currently own or may acquire which could result in a
material adverse effect on our business, results of
operations, financial condition, cash flows or prospects.
The issuance of additional ordinary shares in the Group in
connection with future acquisitions or other growth
opportunities, any share incentive or share option plan or
otherwise may dilute all other shareholdings.
We may seek to raise financing to fund future acquisitions
and other growth opportunities. We may, for these and
other purposes, issue additional equity or convertible equity
securities. As a result, existing holders of ordinary shares
may suffer dilution in their percentage ownership or the
market price of the ordinary shares may be
adversely affected.
As of December 31, 2023, we have issued options under our
equity incentive plans to employees and executive directors
for a total of 220,441 new ordinary shares of the Group, all
of which are currently outstanding, and have also entered
into restricted stock unit agreements and performance
stock unit agreements with certain employees, of which
307,576 restricted stock units and 612,482 performance
stock units are outstanding. We may, in the future, issue
further options and/or warrants to subscribe for new
ordinary shares to certain advisers, employees, directors,
senior management and/or consultants of the Group. The
exercise of any such options would result in a dilution of the
shareholdings of other investors. Additionally, although we
currently have no plans for an offering of ordinary shares, it
is possible that we may decide to offer additional ordinary
shares in the future. Subject to any applicable pre-emption
rights, any future issues of ordinary shares by the Group
may have a dilutive effect on the holdings of shareholders
and could have a material adverse effect on the market
price of ordinary shares as a whole.
Restrictions in our existing and future debt agreements
could limit our growth and our ability to engage in
certain activities.
Our Credit Facility contains a number of significant
covenants that may limit our ability to, among other things:
—incur additional indebtedness;
—incur liens;
—sell assets;
—make certain debt payments;
—enter into agreements that restrict or prohibit the
payment of dividends;
—limits our subsidiaries’ ability to make certain payments
with respect to their equity, based on the pro forma
effect thereof on certain financial ratios, which would be
the source of distributable profits from which we may
issue a dividend; and
—conduct hedging activities.
In addition, our Credit Facility requires us to maintain
compliance with certain financial covenants.
We may also be prevented from taking advantage of
business opportunities that arise because of the limitations
from the restrictive covenants under our Credit Facility.
These restrictions may limit our ability to obtain future
financings to withstand a future downturn in our business
or the economy in general, or to otherwise conduct
necessary corporate activities.
A breach of any covenant in our Credit Facility will result in
a default under the agreement and may result in an event of
default under the Credit Facility if such default is not cured
during any applicable grace period. An event of default, if
not waived, could result in acceleration of the indebtedness
outstanding under our Credit Facility and in an event of
default with respect to, and an acceleration of, the
indebtedness outstanding under any other debt
agreements to which we are a party. Any such accelerated
indebtedness would become immediately due and payable.
If that occurs, we may not be able to make all of the
required payments or borrow sufficient funds to refinance
such indebtedness. Even if new financing were available at
that time, it may not be on terms that are acceptable to us.
Any significant reduction in our borrowing base under our
Credit Facility as a result of periodic borrowing base
redeterminations or otherwise may negatively impact our
ability to fund our operations.
Our Credit Facility limits the amounts we can borrow up to
a borrowing base amount, which the lenders, in their sole
discretion, unilaterally determine based upon our reserve
reports for the applicable period and other data and
reports. Such determinations will be made on a regular
basis semi-annually (each a “Scheduled Redetermination”)
and at the option of the lenders with more than 66.6% of
the loans and commitments under the Credit Facility, no
more than one time in between each Scheduled
Redetermination. As of the date hereof, our borrowing base
is $305 million.
In the future, we may not be able to access adequate
funding under our Credit Facility as a result of a decrease in
our borrowing base due to the issuance of new
indebtedness, the outcome of a borrowing base
redetermination, or an unwillingness or inability on the part
of lending counterparties to meet their funding obligations
and the inability of other lenders to provide additional
funding to cover a defaulting lender’s portion. Declines in
commodity prices from their current levels could result in a
determination to lower the borrowing base and, in such a
case, we could be required to repay any indebtedness in
excess of the redetermined borrowing base. As a result, we
may be unable to make acquisitions or otherwise carry out
business plans, which could have a material adverse effect
on our business, results of operations, financial condition,
cash flows or prospects.
The securitizations of our limited purpose, bankruptcy-
remote, wholly owned subsidiaries may expose us to
financing and other risks, and there can be no assurance
that we will be able to access the securitization market in
the future, which may require us to seek more
costly financing.
Through limited purpose, bankruptcy-remote, wholly
owned subsidiaries (“SPVs”), we have securitized and
expect to securitize in the future, certain of our assets to
generate financing. In such transactions, we convey a pool
of assets to an SPV, that, in turn, issues certain securities or
enters into certain debt agreements, such as our Term
Loan I. The securities issued by the SPVs and the Term
Loan I are each collateralized by a pool of assets. In
exchange for the transfer of finance receivables to the SPV,
we typically receive the cash proceeds from the sale of the
securities or entering into term loans.
Although our SPVs have successfully completed
securitizations in connection with the Term Loan I, the ABS
I Notes, ABS II Notes, ABS III Notes, ABS IV Notes, ABS V
Notes and ABS VI Notes (each as defined herein), there can
be no assurance that we, through our SPVs, will be able to
complete additional securitizations, particularly if the
securitization markets become constrained. In addition, the
value of any securities that our limited purpose,
bankruptcy-remote, wholly owned subsidiaries retain in our
securitizations, including securities retained to comply with
applicable risk retention rules, might be reduced or, in some
cases, eliminated as a result of an adverse change in
economic conditions or the financial markets. In addition,
our Term Loan I, ABS I Notes, ABS II Notes, ABS III Notes,
ABS IV Notes, ABS V Notes and ABS VI Notes are subject
to customary accelerated amortization events, including
events tied to the failure to maintain stated debt service
coverage ratios.
If it is not possible or economical for us to securitize our
assets in the future, we would need to seek alternative
financing to support our operations and to meet our
existing debt obligations, which may be less efficient and
more expensive than raising capital via securitizations and
may have a material adverse effect on our results of
operations, financial condition, cash flows and liquidity.

An increase in interest rates would increase the cost of
servicing our indebtedness and could reduce our
profitability, decrease our liquidity and impact
our solvency.
Our Credit Facility provides for, and our future debt
agreements may provide for, debt incurred thereunder to
bear interest at variable rates. As of December 31, 2023, we
had $159 million outstanding on our Credit Facility.
Increases in interest rates would increase the cost of
servicing indebtedness under our Credit Facility or under
future debt agreements subject to interest at variable rates,
and materially reduce our profitability, decrease our
liquidity and impact our solvency.
Our hedging activities could result in financial losses or
could reduce our net income.
To achieve more predictable cash flows, we employ a
hedging strategy involving opportunistically hedging a
majority of our first two years of production as well as
hedging a significant percentage of production beyond our
first two years of forecasted production. Even so, the
remainder of our production that is unhedged is exposed to
the continuing and prolonged declines in the prices of
natural gas, NGLs and oil. Our results of operations and
financial condition would be negatively impacted if the
prices of natural gas, NGLs or oil were to remain depressed
or decline materially from current levels. To achieve more
predictable cash flows and to reduce our exposure to
fluctuations in the prices of natural gas, NGLS and oil, we
may enter into additional hedging arrangements for a
significant portion of our production.
Our derivative contracts may result in substantial gains or
losses. For example, we reported an operating profit of
$1,161 million for the year ended December 31, 2023,
compared with an operating loss of $671 million for the year
ended December 31, 2022 and $467 million for the year
ended December 31, 2021. While our earnings are impacted
by a variety of factors as described in Results of
Operations, a key driver of our year over year change from
an operating loss to profit was attributable to a change of
$1,767 million in the mark-to-market valuation adjustment
on our derivative financial instrument valuations to $906
million gain in 2023 from $861 million loss in 2022. There
can be no assurance that we will not realize additional
losses due to our hedging activities in the future. In
addition, if we enter into any derivative contracts and
experience a sustained material interruption in our
production, we might be forced to satisfy all or a portion of
our hedging obligations without the benefit of the cash
flows from our sale of the underlying physical commodity,
resulting in a substantial diminution of our liquidity. Our
ability to use hedging transactions to protect us from future
natural gas, NGL and oil price volatility will be dependent
upon natural gas, NGL and oil prices at the time we enter
into future hedging transactions and our future levels of
hedging and, as a result, our future net cash flows may be
more sensitive to commodity price changes. In addition, if
commodity prices remain low, we will not be able to
replace our hedges or enter into new hedges at
favorable prices.
Our price hedging strategy and future hedging transactions
will be determined at our discretion, subject to the terms of
certain agreements governing our indebtedness. The prices
at which we hedge our production in the future will be
dependent upon commodity prices at the time we enter
into these transactions, which may be substantially higher
or lower than current prices. Accordingly, our price hedging
strategy may not protect us from significant declines in
prices received for our future production. Conversely, our
hedging strategy may limit our ability to realize cash flows
from commodity price increases. It is also possible that a
substantially larger percentage of our future production will
not be hedged as compared with the next few years, which
would result in our natural gas, NGL and oil revenues
becoming more sensitive to commodity price fluctuations.
The failure of our hedge counterparties to meet their
obligations to us may adversely affect our financial results.
An attendant risk exists in hedging activities that the
counterparty in any derivative transaction cannot or will not
perform under the instrument and that we will not realize
the benefit of the hedge. Disruptions in the financial
markets could lead to sudden decreases in a counterparty’s
liquidity, which could make them unable to perform under
the terms of the derivative contract and we may not be
able to realize the benefit of the derivative contract. Any
default by the counterparty to these derivative contracts
when they become due would have a material adverse
effect on our results of operations, financial condition, cash
flows and prospects.
We may not be able to enter into commodity derivatives
on favorable terms or at all.
To achieve a more predictable cash flow, we employ a
hedging strategy involving opportunistically hedging a
majority of our first two years of production as well as
hedging a significant percentage of production beyond our
first two years of forecasted production. If we are unable to
maintain sufficient hedging capacity with our
counterparties, we could have greater exposure to changes
in commodity prices and interest rates, which could have a
material adverse impact on our business, results of
operations, financial condition, cash flows or prospects.
Risks Relating to Legal, Tax, Environmental and
Regulatory Matters
We are subject to regulation and liability under
environmental, health and safety regulations, the violation
of which may affect our financial condition and operations.
We operate in an industry that has certain inherent hazards
and risks, and consequently we are subject to stringent and
comprehensive laws and regulations, especially with regard
to the protection of health, safety and the environment. For
example, we are subject to laws and regulations related to
occupational safety and health, hydraulic fracturing
activities, air emissions, soil and water quality, the
protection of threatened and endangered plant and animal
species, biodiversity and ecosystems, and the safety of our
assets and employees. Although we believe that we have
adequate procedures in place to mitigate operational risks,
there can be no assurances that these procedures will be
adequate to address every potential health, safety and
environmental hazard, and a failure to adequately mitigate
risks may result in loss of life, injury, or adverse impacts on
the health of employees, contractors and third-parties or
the environment. Any failure by us or one of our
subcontractors, whether inadvertent or otherwise, to
comply with applicable legal or regulatory requirements
may give rise to civil, administrative and/or criminal
liabilities, civil fines and penalties, delays or restrictions in
acquiring or disposing of assets and/or delays in securing
or maintaining required permits, licenses and approvals.
Further, a lack of regulatory compliance may lead to denial,
suspension, or termination of permits, licenses, or approvals
that are required to operate our sites or could result in
other operational restrictions or obligations. Our health,
safety and environmental policies require us to observe
local, state and national legal and regulatory requirements
and to apply generally accepted industry best practices
where legislation or regulation does not exist.
The terms and conditions of licenses, permits, regulatory
orders, approvals or permissions may include more
stringent operational, environmental and/or health and
safety requirements. Obtaining development or production
licenses and permits may become more difficult or may be
delayed due to federal, regional, state or local
governmental constraints, considerations, or requirements
on issuing. Furthermore, third-parties such as environmental
NGOs may administratively or judicially contest or protest
licenses and permits already granted by relevant authorities
or applications for the same and operations may be subject
to other administrative or judicial challenges.
In addition, under certain environmental laws and
regulations, we could be subject to joint and several strict
liability for the removal or remediation of previously
released materials, pollution, or property contamination
regardless of whether we were responsible for the release
or contamination or whether the operations were in
compliance with all applicable laws at the time those
actions were taken. Private parties, including the owners of
properties on or adjacent to well sites and facilities where
petroleum hydrocarbons or wastes are taken for
reclamation or disposal, may also have the right to pursue
legal actions as well as to seek damages for non-
compliance with environmental laws and regulations or for
personal injury or property damage. In addition, the risk of
accidental spills or releases of pollutants or contaminants
could expose us to significant liabilities that could have a
material adverse effect on our business, financial condition
and results of operations.
We incur, and expect to continue to incur, capital and
operating costs in an effort to comply with increasingly
complex operational health and safety and environmental
laws and regulations. New laws and regulations, the
imposition of more stringent requirements in permits and
licenses, increasingly strict enforcement of, or new
interpretations of, existing laws, regulations and permits
and licenses, or the discovery of previously unknown
contamination or hazards may require further costly
expenditures to, for example:
—modify operations, including an increase in plugging and
abandonment operations;
—install or upgrade pollution or emissions
control equipment;
—perform site clean ups, including the remediation and
reclamation of gas and oil sites;
—curtail or cease certain operations;
—provide financial securities, bonds, and/or take out
insurance; or
—pay fees or fines or make other payments for pollution,
discharges to the environment or other breaches of
environmental or health and safety requirements or
consent agreements with regulatory agencies.
We cannot predict with any certainty the full impact of any
new laws, regulations, or policies on our operations or on
the cost or availability of insurance to cover the risks
associated with such operations. The costs of such
measures and liabilities related to potential operational
health and safety or environmental risks associated with the
Group may increase, which could materially and adversely
affect our business, results of operations, financial
condition, cash flows or prospects. In addition, it is not
possible to predict what future operational health and
safety or environmental laws and regulations will be
enacted or how current or future operational, health, safety
or environmental laws and regulations will be applied or
enforced. We may have to incur significant expenditure for
the installation and operation of additional systems and
equipment for monitoring and carry out remedial measures
in the event that operational health and, safety and
environmental regulations become more stringent or costly
reform is implemented by regulators. Any such expenditure
may have a material adverse effect on our business, results
of operations, financial condition, cash flows or prospects.
No assurance can be given that compliance with
occupational health and safety and environmental laws or
regulations in the regions where we operate will not result
in a curtailment of production or a material increase in the
cost of production or development activities.
Increasing attention to sustainability matters may impact
our business and financial results.
Increasing attention has been given to corporate activities
related to sustainability matters in public discourse and the
investment community. A number of advocacy groups,
both domestically and internationally, have campaigned for
governmental and private action to promote change at
public companies related to sustainability matters, including
through the investment and voting practices of investment
advisers, public pension funds, activist investors,
universities and other members of the investing community.
These activities include increasing attention and demands
for action related to climate change, advocating for
changes to companies’ board of directors and promoting
the use of alternative forms of energy. These activities may
result in demand shifts for oil and natural gas products and
additional governmental investigations and private ligation
against us. In addition, a failure to comply with evolving
investor or customer expectations and standards or if we
are perceived to not have responded appropriately to the
growing concern for sustainability issues, regardless of
whether there is a legal requirement to do so, could cause
reputational harm to our business, increase our risk of
litigation, and could have a material adverse effect on our
results of operation.
In addition, organizations that provide information to
investors on corporate governance and related matters
have developed ratings systems for evaluating companies
on their approach to sustainability matters. These ratings
are used by some investors to inform their investment and
voting decisions. Unfavorable sustainability ratings may
lead to increased negative investor sentiment toward us
and our industry and to the diversion of investment to other
companies or industries, which could have a negative
impact on our stock price and our access to and costs of
capital. Also, institutional lenders may decide not to provide
funding for oil and natural gas companies based on climate
change related concerns, which could affect our access to
capital for potential growth projects.
The current U.S. administration, acting through the
executive branch and/or in coordination with Congress,
could enact rules and regulations that impose more
onerous permitting and other costly environmental, health
and safety requirements on our operations.
Governmental, scientific and public concern over the threat
of climate change arising from GHG emissions has resulted
in increasing political risks in the United States, including
climate change-related commitments expressed by some
political candidates who are now, or may in the future be, in
political office.
While our operations are largely not conducted on federal
lands, we may in the future consider acquisitions of natural
gas and oil assets located in areas in which the
development of such assets would require permits and
authorizations to be obtained from or issued by federal
agencies. To conduct these operations, we may be required
to file applications for permits, seek agency authorizations
and comply with various other statutory and regulatory
requirements. Further, new oil and gas leasing on public
lands has been the subject of recent proposed reforms,
including bans in certain areas, raising royalty rates and
implementing stricter standards for entities seeking to
purchase oil and gas leases. Complying with any of these
requirements may adversely affect our ability to conduct
operations at the costs and in the time periods anticipated,
and may consequently adversely impact our anticipated
returns from our operations.
Presidential or congressional actions could adversely affect
our operations by restricting the lands available for
development and/or access to permits required for such
development, or by imposing additional and costly
environmental, health and safety requirements. Any such
measures or increased costs could have a material adverse
effect on our business, results of operations, financial
condition, cash flows or prospects.
Our operations are dependent on our compliance with
obligations under permits, licenses, contracts and field
development plans.
Our operations must be carried out in accordance with the
terms of permits, licenses, operating agreements, annual
work programs and budgets. Fines, penalties, or
enforcement actions may be imposed and a permit or
license may be suspended or terminated if a permit or
license holder, or party to a related agreement, fails to
comply with its obligations under such permit, license or
agreement, or fails to make timely payments of levies and
taxes for the licensed activity, or fails to provide the
required geological information or meet other reporting
requirements. It may from time to time be difficult to
ascertain whether we have complied with obligations under
permits or licenses as the extent of such obligations may be
unclear or ambiguous and regulatory authorities in
jurisdictions in which we do business, or in which we may
do business in the future, may not be forthcoming with
confirmatory statements that work obligations have been
fulfilled, which can lead to further operational uncertainty.
In addition, we and our commercial partners, as applicable,
have obligations to operate assets in accordance with
specific requirements under certain licenses and related
agreements, field development agreements, laws and
regulations. If we or our partners were to fail to satisfy such
obligations with respect to a specific field, the license or
related agreements for that field may be suspended,
revoked or terminated. Although we have in the past
acquired and may in the future acquire shale assets, a
significant source of our natural gas and crude oil remains
conventional wells. In some instances, these conventional
wells are located on the same property as unconventional
wells that produce shale oil. In these cases, the rights to
access the shale layers of the property will typically be
conditioned on the ongoing productivity of conventional
wells on the property. Furthermore, the shale rights may be
owned by a third party, and in such instances, we will enter
into a joint use agreement with the third party. This joint use
agreement may stipulate that in consideration for permission
to operate the conventional wells, we are to use reasonable
efforts to maintain production so that the third party retains
the shale licenses. If we fail to maintain production in the
conventional wells, under the joint use agreement, we may
be liable to the third party for replacing the lost land rights.
The relevant authorities are typically authorized to, and do
from time to time, inspect to verify compliance by us or our
commercial partners, as applicable, with relevant laws and
the licenses or the agreements pursuant to which we
conduct our business. There can be no assurance that the
views of the relevant government agencies regarding the
development of the fields that we operate or the compliance
with the terms of the licenses pursuant to which we conduct
such operations will coincide with our views, which might
lead to disagreements that may not be resolved.
The suspension, revocation, withdrawal or termination of
any of the permits, licenses or related agreements pursuant
to which we may conduct business, as well as any delays in
the continuous development of or production at our fields
caused by the issues detailed above could materially and
adversely affect our business, results of operations, financial
condition, cash flows or prospects. In addition, failure to
comply with the obligations under the permits, licenses or
agreements pursuant to which we conduct business,
whether inadvertent or otherwise, may lead to fines,
penalties, restrictions, enforcement actions brought by
governmental authorities, withdrawal of licenses and
termination of related agreements.
We do not insure against certain risks and our insurance
coverage may not be adequate for covering losses
arising from potential operational hazards and
unforeseen interruptions.
We insure our operations in accordance with industry
practice and plan to continue to insure the risks we
consider appropriate for our needs and circumstances.
However, we may elect not to have insurance for certain
risks, due to the high premium costs associated with
insuring those risks or for various other reasons, including
an assessment in some cases that the risks are remote.
Our insurance may not be adequate to cover all losses or
liabilities we may suffer. We cannot assure that we will be
able to obtain insurance coverage at reasonable rates (or at
all), or that any coverage we or the relevant operator
obtain, and any proceeds of insurance, will be adequate and
available to cover any claims arising. We may become
subject to liability for pollution, blow-outs or other hazards
against which we have not insured or cannot insure,
including those in respect of past activities for which we
were not responsible. Any indemnities we may receive from
sub-contractors, operators or joint venture partners may be
difficult to enforce if such sub-contractors, operators or
joint venture partners lack adequate resources.
Operational insurance policies are usually placed in one
year contracts and the insurance market can withdraw
cover for certain risks due to events occurring in other
parts of the industry, thus greatly increasing the costs of
risk transfer. For example, in September 2018, a gas pipeline
operated by another midstream company exploded in
Beaver County, Pennsylvania, a state in which we have
operations. The explosion resulted in the destruction of
residential property and motor vehicles as well as the
evacuation of nearby households. Catastrophic events such
as these may cause the insurance costs for our midstream
operations to rise, despite us not being involved in the
catastrophic event. In the event that insurance coverage is
not available or our insurance is insufficient to fully cover
any losses, including losses incurred due to lost revenues
resulting from third party operations or processing plants,
claims and/or liabilities incurred, or indemnities are difficult
to enforce, our business and operations, financial results or
financial position may be disrupted and adversely affected.
The payment by our insurers of any insurance claims may
result in increases in the premiums payable by us for our
insurance coverage and could adversely affect our financial
performance. In the future, some or all of our insurance
coverage may become unavailable or
prohibitively expensive.
Our internal systems and website may be subject to
intentional and unintentional disruption, and our
confidential information may be misappropriated, stolen
or misused, which could adversely impact our reputation
and future sales.
We have faced, and may in the future continue to face,
cyber-attacks and data security breaches. Such cyber-
attacks and breaches are designed to penetrate our
network security or the security of our internal systems,
misappropriate proprietary information and/or cause
interruptions to our services, and we expect to continue to
face similar threats in the future. We cannot guarantee that
we will be able to successfully prevent all attacks in the
future. Such future attacks could include hackers obtaining
access to our systems, the introduction of malicious
computer code or denial of service attacks. If an actual or
perceived breach of our network security occurs, it could
adversely affect our business or reputation, and may expose
us to the loss of information, litigation and possible liability.
An actual security breach could also impair our ability to
operate our business and provide products and services to
our customers. Additionally, malicious attacks, including
cyber-attacks, may damage our assets, prevent production
at our producing assets and otherwise significantly affect
corporate activities. For example, we utilize electronic
monitoring of meters and flow rate devices to monitor
pressure build-up in our production wells. If there were a
cyber-attack that penetrated our monitoring systems such
that they provided false readings, this could result in an
unknown pressure build-up, creating a dangerous situation
which could end up in an explosion. As techniques used to
obtain unauthorized access to or to sabotage systems
change frequently and may not be known until launched
against us or our third-party service providers, we may be
unable to anticipate or implement adequate measures to
protect against these attacks and our service providers may
likewise be unable to do so. Such an outcome would have a
material adverse impact on our business, results of
operations, financial condition, cash flows or prospects.
In addition, confidential or financial payment information
that we maintain may be subject to misappropriation, theft
and deliberate or unintentional misuse by current or former
employees, third-party contractors or other parties who
have had access to such information. Any such
misappropriation and/or misuse of our information could
result in the Group, among other things, being in breach of
certain data protection requirements and related legislation
as well as incurring liability to third parties. We expect that
we will need to continue closely monitoring the accessibility
and use of confidential information in our business, educate
our employees and third-party contractors about the risks
and consequences of any misuse of confidential information
and, to the extent necessary, pursue legal or other remedies
to enforce our policies and deter future misuse. If our
confidential information is misappropriated, stolen or
misused as a result of a disruption to our website or internal
systems this could have a material adverse effect on our
business, results of operations, financial condition, cash
flows or prospects.
Although we maintain insurance to protect against losses
resulting from certain of data protection breaches and
cyber-attacks, our coverage for protecting against such
risks may not be sufficient.

Our operations are subject to the risk of litigation.
From time to time, we may be subject, directly or indirectly,
to litigation arising out of our operations and the regulatory
environments in our areas of operations. Historically,
categories of litigation that we have faced included actions
by royalty owners over payment disputes, personal injury
claims and property related claims, including claims over
property damage, trespass or nuisance. Although we
currently face no material litigation that is reasonably
expected to have an adverse material impact for which we
are not sufficiently indemnified or insured, damages
claimed under such litigation in the future may be material
or may be indeterminate, and the outcome of such
litigation, if determined adversely to us, could individually
or in the aggregate, be reasonably expected to have a
material and adverse effect on our business, financial
position or results of operations. While we assess the merits
of each lawsuit and defend ourselves accordingly, we may
be required to incur significant expenses or devote
significant resources to defend against such litigation. In
addition, the adverse publicity surrounding such claims may
have a material adverse effect on our business.
We are subject to certain tax risks.
Any change in our tax status or in taxation legislation in the
United Kingdom or the United States could affect our
ability to provide returns to shareholders. Statements in this
document concerning the taxation of holders of our
ordinary shares are based on current law and practice,
which is subject to change.
We are subject to income taxes in the United Kingdom and
the United States, and there can be no certainty that the
current taxation regime in the United Kingdom, the United
States or other jurisdictions within which we currently
operate or may operate in the future will remain in force or
that the current levels of corporation taxation will remain
unchanged. For example, the U.S. government has imposed
a minimum tax on corporations and proposed and may
enact significant changes to the taxation of business
entities including, among others, an increase in the U.S.
federal income tax rate applicable to corporations, like us,
and surtaxes on certain types of income. Certain U.S.
localities also maintain a severance tax or impact fee on the
removal of oil and natural gas from the ground and such tax
rates may be increased or new severance taxes or impact
fees may be implemented. In addition, in response to
current global events and consumer hardship, the United
Kingdom announced on May 26, 2022 a new “Energy Profits
Levy” on oil and gas exploration and production companies
operating in the United Kingdom and the UK Continental
Shelf at a rate of 25% (subsequently increased to 35%). As
we do not operate our exploration, production or extraction
activities in the United Kingdom or in the UK Continental
Shelf, we do not expect the Energy Profits Levy to impact
our headline corporation tax rate in the United Kingdom,
however, the taxation of energy companies remains
uncertain, particularly in the context of current global
events, and the future stability of such tax regimes cannot
be guaranteed.
Our domestic and international tax liabilities are subject to
the allocation of expenses in differing jurisdictions. Our
effective tax rate could be adversely affected by changes in
the mix of earnings and losses in taxing jurisdictions with
differing statutory tax rates, certain non-deductible
expenses, the valuation of deferred tax assets and liabilities
and changes in federal, state or international tax laws and
accounting principles. Increases in our effective tax rate
could materially affect our net financial results. Although we
believe that our income tax liabilities are reasonably
estimated and accounted for in accordance with applicable
laws and principles, an adverse resolution of one or more
uncertain tax positions in any period could have a material
adverse effect on our business, results of operations,
financial condition, cash flows or prospects.
In the past we have been able to offset a large portion of
our U.S. federal income tax burden with marginal well tax
credits that are available to qualified producers who
operate lower-volume wells during a low commodity pricing
environment. There can be no assurance that there will be
no amendment to the existing taxation laws applicable to us,
which may have a material adverse effect on our financial
position. Our ability to utilize marginal well tax credits in the
United States could be or become subject to limitations (for
example, if we are deemed to undergo an “ownership
change” for applicable U.S. federal income tax purposes).
The nature and amount of tax that we expect to pay and
the reliefs expected to be available to us are each
dependent upon several assumptions, any one of which
may change and which would, if so changed, affect the
nature and amount of tax payable and reliefs available. In
particular, the nature and amount of tax payable may be
dependent on the availability of relief under tax treaties and
is subject to changes to the tax laws or practice in any of
the jurisdictions we currently are subject to or may be
subject to in the future. Any limitation in the availability of
relief under these treaties, any change in the terms of any
such treaty or any changes in tax law, interpretation or
practice could increase the amount of tax payable by us.
Finally, because we are an entity incorporated in the United
Kingdom that is treated as a U.S. corporation for all
purposes of U.S. federal income tax law, any changes in U.S.
federal income tax law could negatively impact our
effective tax rate and cash flows, which could cause our
business, results of operations, financial condition, cash
flows or prospects to be materially adversely affected.
The taxation of an investment in our ordinary shares
depends on the individual circumstances of the holders of
our ordinary shares. Holders of our ordinary shares are
strongly advised to consult their professional tax advisers.
Tax legislation may be enacted in the future that could
negatively impact our current or future tax structure and
effective tax rates.
Long-standing international tax initiatives that determine
each country’s jurisdiction to tax cross-border international
trade and profits are evolving as a result of, among other
things, initiatives such as the Anti-Tax Avoidance Directives,
as well as the Base Erosion and Profit Shifting reporting
requirements, mandated and/or recommended by the EU,
G8, G20 and Organization for Economic Cooperation and
Development, including the imposition of a minimum global
effective tax rate for multinational businesses regardless of
the jurisdiction of operation and where profits are
generated (Pillar Two). As these and other tax laws and
related regulations change (including changes in the
interpretation, approach and guidance of tax authorities),
our financial results could be materially impacted. Given the
unpredictability of these possible changes and their
potential interdependency, it is difficult to assess whether
the overall effect of such potential tax changes would be
cumulatively positive or negative for our earnings and
cash flow, but such changes could adversely affect our
financial results.
Risks Relating to Our Ordinary Shares
Our ordinary shares are subject to market price volatility
and the market price may decline disproportionately in
response to developments that are unrelated to our
operating performance.
The market price of our ordinary shares has been, and may
in the future be, volatile and subject to wide fluctuations as
a result of a variety of factors including, but not limited to:
—operating results that vary from our financial guidance or
the expectations of securities analysts and investors;
—the financial performance of the major end markets that
we target;
—the operating and securities price performance of
companies that investors consider to be comparable
to us;
—announcements of strategic developments, acquisitions
and other material events by us or our competitors;
—failure to meet or exceed financial estimates and
projections of the investment community or that we
provide to the public;
—issuance of new or updated research or reports by
securities analysts;
—changes in government regulations;
—financing or other corporate transactions;
—the loss of any of our key personnel;
—sales of our ordinary shares by us, our executive officers
and board members or our shareholders in the future;
—price and volume fluctuations in the overall stock market,
including as a result of trends in the economy as a
whole; and
—other events and factors, many of which are beyond
our control.
These and other market and industry factors may cause the
market price and demand for our ordinary shares to
fluctuate substantially, regardless of our actual operating
performance, which may limit or prevent investors from
readily selling their ordinary shares and may otherwise
negatively affect the liquidity of our ordinary shares. In the
past, when the market price of a stock has been volatile,
holders of that stock have sometimes instituted securities
class action litigation against the issuer. If any of the
holders of our ordinary shares were to bring such a lawsuit
against us, we could incur substantial costs defending the
lawsuit and the attention of our senior management would
be diverted from the operation of our business. Any
adverse determination in litigation could also subject us to
significant liabilities.
The requirements of being a U.S. public company,
including compliance with the reporting requirements of
the Securities Exchange Act of 1934, as amended (the
“Exchange Act”), and the requirements of the Sarbanes-
Oxley Act, may strain our resources, increase our costs
and distract management, and we may be unable to
comply with these requirements in a timely or
cost-effective manner.
As a new U.S. public company, we are required to comply
with new laws, regulations and requirements, certain
corporate governance provisions of Sarbanes-Oxley Act,
related regulations of the SEC and the requirements of the
NYSE, with which we were not required to comply as a
private company. Complying with these statutes,
regulations and requirements will occupy a significant
amount of our time and will significantly increase our costs
and expenses. We will need to: institute a more
comprehensive compliance function to test and conclude
on the sufficiency of our internal control over financial
reporting; comply with rules promulgated by the NYSE;
prepare and distribute periodic public reports; establish
new internal policies, such as those relating to insider
trading; and involve and retain to a greater degree outside
professionals in the above activities. At any time, we may
conclude that our internal controls, once tested, are not
operating as designed or that the system of internal
controls does not address all relevant financial statement
risks. In our second annual report on Form 20-F, our
independent registered public accounting firm must attest
to the effectiveness of our internal control over financial
reporting. Our independent registered public accounting
firm may issue a report that concludes it does not believe
our internal control over financial reporting is effective.
Compliance with Sarbanes-Oxley Act requirements may
strain our resources, increase our costs and distract
management; and we may be unable to comply with these
requirements in a timely or cost-effective manner.
As a new U.S. public company, we are subject to significant
regulatory oversight and reporting obligations under U.S.
federal securities laws and the continuous scrutiny of
securities analysts and investors. In addition, most members
of our management team have limited experience
managing a U.S. public company, interacting with U.S.
public company investors, and complying with the
increasingly complex laws pertaining to U.S. public
companies. Our management team may not successfully or
efficiently manage us as a U.S. public company. These new
obligations and constituents require significant attention
from our management team and could divert our
management team’s attention away from the day-to-day
management of our business, which could adversely affect
our business, results of operations and financial condition.
Further, we expect that, as a new U.S. public company,
being subject to these rules and regulations may make it
more difficult and more expensive for us to obtain director
and officer liability insurance and we may be required to
accept reduced policy limits and coverage or incur
substantially higher costs to obtain the same or similar
coverage. As a result, it may be more difficult for us to
attract and retain qualified individuals to serve on our board
of directors or as executive officers. We are currently
evaluating these rules, and we cannot predict or estimate
the amount of additional costs we may incur or the timing
of such costs.
We qualify as a foreign private issuer and, as a result, we
will not be subject to U.S. proxy rules and will be subject
to Exchange Act reporting obligations that, to some
extent, are more lenient and less frequent than those of a
U.S. domestic public company.
We report under the Exchange Act as a non-U.S. company
with foreign private issuer status. Because we qualify as a
foreign private issuer under the Exchange Act, we are
exempt from certain provisions of the Exchange Act that
are applicable to U.S. domestic public companies, including
(i) the sections of the Exchange Act regulating the
solicitation of proxies, consents or authorizations in respect
of a security registered under the Exchange Act; (ii) the
sections of the Exchange Act requiring insiders to file public
reports of their stock ownership and trading activities and
liability for insiders who profit from trades made in a short
period of time; and (iii) the rules under the Exchange Act
requiring the filing with the SEC of quarterly reports on
Form 10-Q containing unaudited financial and other
specified information, or current reports on Form 8-K, upon
the occurrence of specified significant events. In addition,
foreign private issuers are not required to file their annual
report on Form 20-F until 120 days after the end of each
fiscal year, while U.S. domestic issuers that are accelerated
filers are required to file their annual report on Form 10-K
within 75 days after the end of each fiscal year. Foreign
private issuers also are exempt from Regulation Fair
Disclosure, aimed at preventing issuers from making
selective disclosures of material information. As a result of
the above, you may not have the same protections afforded
to shareholders of companies that are not foreign private
issuers, some investors may find the ordinary shares less
attractive, and there may be a less active trading market for
the ordinary shares.
As a foreign private issuer, we are permitted to adopt
certain home country practices in relation to corporate
governance matters that differ significantly from the
corporate governance listing standards of the NYSE. These
practices may afford less protection to shareholders than
they would enjoy if we complied fully with the corporate
governance listing standards of the NYSE.
As a foreign private issuer listed on the NYSE, we are
subject to corporate governance listing standards.
However, NYSE rules permit a foreign private issuer like us
to follow the corporate governance practices of its home
country in lieu of certain NYSE corporate governance listing
standards, provided that we disclose which requirements
that we have not complied with in any year and confirm the
UK corporate governance practices we have complied with.
Certain corporate governance practices in the United
Kingdom, which is our home country, may differ
significantly from the NYSE corporate governance listing
standards. Although we voluntarily comply with the higher
corporate governance standards of the UK Corporate
Governance Code, we could include non-independent
directors as members of our nomination and remuneration
committee, and our independent directors would not
necessarily hold regularly scheduled meetings at which only
independent directors are present. We may in the future
elect to follow home country practices in the United
Kingdom with regard to other matters. Therefore, our
shareholders may be afforded less protection than they
otherwise would have under the NYSE corporate
governance listing standards applicable to U.S.
domestic issuers.
We may lose our foreign private issuer status, which would
then require us to comply with the Exchange Act’s
domestic reporting regime and cause us to incur
significant additional legal, accounting and other
expenses.
As a foreign private issuer, we are not required to comply
with all of the periodic disclosure and current reporting
requirements of the Exchange Act applicable to U.S.
domestic issuers. To the extent we no longer qualify as a
foreign private issuer as of June 30, 2024 (the end of our
second fiscal quarter in the fiscal year after this listing), we
would be required to comply with all of the periodic
disclosure and current reporting requirements of the
Exchange Act applicable to U.S. domestic issuers as of
July 1, 2024. In order to maintain our current status as a
foreign private issuer, either (a) a majority of our ordinary
shares must be either directly or indirectly owned of record
by non-residents of the United States or (b)(i) a majority of
our executive officers or directors cannot be U.S. citizens or
residents, (ii) more than 50% of our assets must be located
outside the United States and (iii) our business must be
administered principally outside the United States. If we
lose our status as a foreign private issuer, we would be
required to comply with the Exchange Act reporting and
other requirements applicable to U.S. domestic issuers,
including the requirement to prepare our financial
statements in accordance with U.S. generally accepted
accounting principles, which are more detailed and
extensive than the requirements for foreign private issuers.
We may also be required to make changes in our corporate
governance practices in accordance with various SEC and
NYSE rules. The regulatory and compliance costs to us
under U.S. securities laws if we are required to comply with
the reporting requirements applicable to a U.S. domestic
issuer may be significantly higher than the cost we would
incur as a foreign private issuer. As a result, we expect that
a loss of foreign private issuer status would increase our
legal and financial compliance costs and would make some
activities highly time consuming and costly. If we lose
foreign private issuer status and are unable to comply with
the reporting requirements applicable to a U.S. domestic
issuer by the applicable deadlines, we would not be in
compliance with applicable SEC rules or the rules of NYSE,
which could cause investors could lose confidence in our
public reports and could have a material adverse effect on
the trading price of our ordinary shares. We also expect
that if we were required to comply with the rules and
regulations applicable to U.S. domestic issuers, it would
make it more difficult and expensive for us to obtain
director and officer liability insurance, and we may be
required to accept reduced coverage or incur substantially
higher costs to obtain coverage. These rules and
regulations could also make it more difficult for us to
attract and retain qualified members of our board
of directors.
Failure to comply with requirements to design, implement
and maintain effective internal control over financial
reporting could have a material adverse effect on
our business.
As a UK public company traded on the Main Market of the
LSE, we are not required to evaluate our internal control
over financial reporting in a manner that meets the rules
and regulations of the SEC.
The process of designing and implementing effective
internal control over financial reporting is a continuous
effort that requires us to anticipate and react to changes in
our business and the economic and regulatory
environments and to expend significant resources to
maintain internal control over financial reporting that is
adequate to satisfy our reporting obligations as a U.S.
public company. If we are unable to establish or maintain
adequate internal control over financial reporting, it could
cause us to fail to meet our reporting obligations on a
timely basis, result in material misstatements in our
consolidated financial statements and harm our results of
operations. In addition, we will be required, pursuant to the
rules and regulations of the SEC, to furnish a report by
management on the effectiveness of our internal control
over financial reporting in the second annual report
following the completion of this listing. This assessment will
need to include disclosure of any material weaknesses
identified by our management in our internal control over
financial reporting. Assessing the effectiveness of our
internal control over financial reporting will require
significant documentation, testing and possible
remediation. Testing and maintaining internal control over
financial reporting may divert our management’s attention
from other matters that are important to our business.
We may not be able to conclude on an annual basis that we
have effective internal control over financial reporting or
our independent registered public accounting firm may not
issue an unqualified opinion on the effectiveness of our
internal control over financial reporting. If either we are
unable to conclude that we have effective internal control
over financial reporting or our independent registered
public accounting firm is unable to issue an unqualified
opinion on the effectiveness of internal control over
financial reporting, investors could lose confidence in our
reported financial information, which could have a material
adverse effect on the trading price of our ordinary shares.
We will incur increased costs as a result of operating as a
public company in the United States, and our management
will be required to devote substantial time to new
compliance initiatives and corporate
governance practices.
As a U.S. public company, we will incur significant legal,
accounting and other expenses that we did not incur
previously. The Sarbanes-Oxley Act, the Dodd-Frank Wall
Street Reform and Consumer Protection Act, the listing
requirements of NYSE and other applicable securities rules
and regulations impose various requirements on non-U.S.
reporting public companies, including the establishment
and maintenance of disclosure controls and procedures,
internal control over financial reporting and corporate
governance practices. Our management and other
personnel will need to devote a substantial amount of time
to these compliance initiatives. Moreover, these rules and
regulations will increase our legal and financial compliance
costs and will make some activities more time consuming
and costly. For example, we expect that these rules and
regulations may increase the cost of our director and officer
liability insurance.
However, these rules and regulations are often subject to
varying interpretations, in many cases due to their lack of
specificity, and, as a result, their application in practice may
evolve over time as new guidance is provided by regulatory
and governing bodies. This could result in continuing
uncertainty regarding compliance matters and higher costs
necessitated by ongoing revisions to disclosure and
governance practices.
Because we may not pay any cash dividends on our
ordinary shares in the future, capital appreciation, if any,
may be your sole source of gains and you may never
receive a return on your investment.
Under current UK law, a company’s accumulated realized
profits, so far as not previously utilized by distribution or
capitalization, must exceed its accumulated realized losses
so far as not previously written off in a reduction or
reorganization of capital duly made (on a non-consolidated
basis), before dividends can be paid. Therefore, we must
have distributable profits before issuing a dividend.
Although we historically declared dividends on our ordinary
shares, in the future, our board of directors may decide, in
its discretion, not to declare and pay dividends based on a
number of factors, including our performance and financial
condition, cash requirements, future prospects, commodity
prices, the performance and dividend yield of our peers, in
addition to general economic conditions. Further, the
Group’s Credit Facility contains a restricted payment
covenant that limits its subsidiaries’ ability to make certain
payments with respect to their equity, based on the pro
forma effect thereof on certain financial ratios, which would
be the source of distributable profits from which we may
issue a dividend. Consequently, any historical declared
dividends are in no way a guide to potential future
dividends and capital appreciation, if any, on our ordinary
shares may be your sole source of gains.
There is no guarantee that we will continue to pay
dividends on our ordinary shares in the future.
Our ability and the Board’s decision to pay dividends is
dependent upon our performance and financial condition,
cash requirements, future prospects, commodity prices, the
performance and dividend yield of our peers, compliance
with the financial covenants and restricted payments
covenant in our Credit Facility, profits available for
distribution and other factors deemed to be relevant at the
time and on the continued health of the markets in which
we operate. Further, subsequent to our listing on the NYSE,
while our Board’s evaluation of our ability or need to pay
dividends will primarily remain a question of the foregoing
factors, it will also take into account the performance of our
ordinary shares, including relative to our peer group. There
can be no guarantee that we will continue to pay dividends
in the future on our ordinary shares.
The rights of our shareholders may differ from the rights
typically offered to shareholders of a U.S. corporation.
We are incorporated under UK law. The rights of holders of
ordinary shares are governed by UK law, including the
provisions of the UK Companies Act 2006 (the “Companies
Act 2006”), and by our Articles of Association. These rights
differ in certain respects from the rights of shareholders in
typical U.S. corporations. Refer to Memorandum and
Articles of Association in this Annual Report & Form 20-F
for a description of the principal differences between the
provisions of the Companies Act 2006 applicable to us and,
for example, the Delaware General Corporation Law
relating to shareholders’ rights and protections.
Claims of U.S. civil liabilities may not be enforceable
against us.
We are incorporated under the laws of the United Kingdom.
In addition, certain of our directors and officers reside
outside the United States. As a result, it may not be
possible for investors to effect service of process within the
United States upon such persons or to enforce judgments
obtained in U.S. courts against them or us, including
judgments predicated upon the civil liability provisions of
the U.S. federal securities laws.
The United States and the United Kingdom do not currently
have a treaty providing for recognition and enforcement of
judgments (other than arbitration awards) in civil and
commercial matters. Consequently, a final judgment for
payment given by a court in the United States, whether or
not predicated solely upon U.S. securities laws, would not
automatically be recognized or enforceable in the United
Kingdom. In addition, uncertainty exists as to whether UK
courts would entertain original actions brought in the UK
against us or our directors or senior management
predicated upon the securities laws of the United States or
any state in the United States. Provided that certain
requirements are met, a final and conclusive monetary
judgment for a definite sum obtained against us in U.S.
courts (that is not a sum payable in respect of taxes or
similar charges or in respect of a fine or a penalty), would
be treated by the courts of the UK as a cause of action in
itself and sued upon as a debt at common law without any
retrial of the issue. Whether the relevant requirements are
met in respect of a judgment based upon the civil liability
provisions of the U.S. securities laws, including whether the
award of monetary damages under such laws would
constitute a penalty, is an issue for the court making such
decision. If a UK court gives judgment for the sum payable
under a U.S. judgment, the UK judgment will be enforceable
by methods generally available for this purpose. These
methods generally permit the UK court discretion to
prescribe the manner of enforcement.
As a result, U.S. investors may not be able to enforce
against us or our executive officers, board of directors or
certain experts named herein who are residents of the
United Kingdom or countries other than the United States
any judgments obtained in U.S. courts in civil and
commercial matters, including judgments under the U.S.
federal securities laws.
General Risks
Events of force majeure may limit our ability to operate
our business and could adversely affect our
operating results.
The weather, unforeseen events, or other events of force
majeure in the areas in which we operate could cause
disruptions or suspension of our operations. This
suspension could result from a direct impact to our
properties or result from an indirect impact by a disruption
or suspension of the operations of those upon whom we
rely for gathering and transportation. If disruption or
suspension were to persist for a long period, our results of
operations would be materially impacted.
If securities or industry analysts do not publish research,
or publish inaccurate or unfavorable research, about our
business, the price of our ordinary shares and our trading
volume could decline.
The trading market for our ordinary shares will depend in
part on the research and reports that securities or industry
analysts publish about us or our business. Securities and
industry analysts do not currently, and may never, publish
research on us. If no or too few securities or industry
analysts commence coverage on us, the trading price for
our ordinary shares would likely be negatively affected. In
the event securities or industry analysts initiate coverage, if
one or more of the analysts who cover us downgrade our
ordinary shares or publish inaccurate or unfavorable
research about our business, the price of our ordinary
shares would likely decline. If one or more of these analysts
cease coverage of us or fail to publish reports on us
regularly, demand for our ordinary shares could decrease,
which might cause the price of our ordinary shares and
trading volume to decline.
Viability and Going Concern
In accordance with Provision 31 section 4 of the UK Corporate
Governance Code, and taking into account our current financial position
and principal risks for a period longer than the 12 months required by
the going concern statement, the Senior Leadership Team prepared a
viability analysis which was assessed by the Board for approval.
Strategy, Business Model and
Market Context
their respective sections within this Annual Report & Form
20-F.
During 2023, we continued to grow and generate
significant operating cash flows from both our Appalachian
and Central Region assets. This growth allowed us to
generate an 8% increase in adjusted EBITDA year-over-
year. Our focus on acquiring assets from which we can
generate robust free cash flow in any price environment
remains central to our business model. We apply a
disciplined approach to valuing and acquiring assets,
protecting the associated cash flows with a proactive
hedge program, all while diligently working to enhance the
assets’ productivity and reduce expenses and emissions to
ensure we create a sustainable return to our shareholders.
During this time we have also used a significant portion of
our free cash flow to repay debt on our amortizing
borrowing structures and Credit Facility providing strong
additional evidence of our success.
2023 provided some unique market dynamics. We
experienced uncharacteristically low commodity prices as
well as significant inflationary pressures. We also saw an
aggressive rise in interest rates to combat inflation which
impacted the cost of capital for many. Our unique business
model leaves us well positioned for volatile markets,
however, and our consistent and reliable cash flows allowed
us to not only grow, but also to opportunistically layer on
additional derivative contracts at high pricing levels to
secure our cash flows at elevated levels in the future. The
importance of which has been recently evident as prices
have retreated substantially during the onset of 2024.
While periods of extreme volatility can make it challenging
for buyers and sellers to reach commercial terms, changing
commodity markets create added growth opportunity.
During higher commodity price environments companies
seek exit strategies to divest non-core assets creating the
necessary capital to drill and develop their core leasehold
positions. Conversely, during low commodity price
environments companies look to divest assets as they seek
additional liquidity to cover marginal well economics on
unhedged production. Thus, as markets cycle, it creates a
plethora of opportunities to build on our strategy of value-
accretive acquisitions.
Assessment Process and
Key Assumptions
Our financial outlook is assessed primarily through a
detailed annual business planning process and a more
general multi-year forecast. The Senior Leadership Team
provides the Board with a detailed overview as part of its
annual budget approval while providing regular updates at
each Board meeting throughout the year. The Board uses
this information, along with any other detail it requests, to
assess our current performance and longer-term outlook.
The outputs from the business planning process include a
set of key performance objectives, an assessment of our
primary risks, the anticipated operational outlook and a set
of financial forecasts that consider the sources of funding
available to DEC (the “Base Plan”).
 |
Key assumptions, which underpin the annual business
planning process, include the forward price strip for each
commodity (natural gas, NGLs and oil), forecasted
operating cost and capital expenditure levels, production
profiles, and the availability of liquidity or additional
financing. We regularly produce cash flow projections,
which we sensitize for different scenarios including, but not
limited to, changes in commodity prices and production
rates from our wells. The Directors and Senior Leadership
Team closely monitor these forecast assumptions and
projections and seek to mitigate our operating and
liquidity risks.
Based on our financial scenario planning process, the
Directors and Senior Leadership Team believe that stress
testing forecast results over the Base Plan for a two-year
period through March 2026 forms a reasonable expectation
of our viability. At least annually, we perform our two-year
Base Plan forecast for our medium-term strategic planning
period. The two-year planning period has been reduced
from three years due to the loss of information value in the
third year primarily as a result of volatile commodity prices
and an incomplete hedge book. Therefore the Directors and
Senior Leadership Team endorse a two-year assessment
period to furnish the most pertinent and valuable data for
assessing the outlook of the business. The Directors and
Senior Leadership Team are confident that they
appropriately monitor and manage operational risks
effectively within the two-year Base Plan, and our scenario
planning is focused primarily on plausible changes in
external factors, providing a reasonable degree of
confidence.
Viability
The principal risks and uncertainties that affect the
Directors’ assessment of our viability in this period are:
—The effect of volatile natural gas prices on the business;
—Operational production performance of the producing
assets; and
—Operating cost levels and our ability to control costs.
The Base Plan incorporates key assumptions that reflect
these principal risks as follows:
—Projected operating cash flows are calculated using a
production profile which is consistent with current
operating results and decline rates;
—Assumes commodity prices are in line with the current
forward curve which considers basis differentials;
—Operating cost levels stay consistent with
historical trends which have been recently elevated due
to the inflationary environment;
—The financial impact of our current hedging contracts in
place, being approximately 83% and 76%, of total
production volumes hedged for the years ending
December 31, 2024 and 2025, respectively; and
—The scenario also includes the scheduled principal and
interest payments on our current debt arrangements.
To assess our viability, the Directors and Senior Leadership
Team considered various scenarios around the Base Plan
that primarily reflect a more severe, but plausible, downside
impact of the principal risks, both individually and in the
aggregate, as well as the additional capital requirements
that downside scenarios could place on us. Conservatively,
our viability statement considered the combined impact of
all three listed scenarios in:
Scenario 1: Cyclically low gas prices for a year (Henry Hub
prices of $1.50 per MMbtu before returning to strip pricing),
which have been historically observed in the market.
Scenario 2: Considered the impact of climate change by
assuming a 2 week period of lost production in our East
Texas/Louisiana region, which is susceptible to hurricanes,
due to a natural disaster (assumed to occur once in each
year of the assessment period).
Scenario 3: Considered the impact of climate change by
assuming a 2 week period of lost production in our
Appalachia region (assumption of lost production in 25% of
the total region), which is susceptible to flooding, due to a
natural disaster (assumed to occur once in each year of the
assessment period).
The Directors and Senior Leadership Team considered the
impact that these principal risks could, in certain
circumstances, have on our prospects within the
assessment period, and accordingly appraised the
opportunities to actively mitigate the risk of these severe,
but plausible, downside scenarios. Based on their
evaluation, the Directors and Senior Leadership Team have
a reasonable expectation that we will be able to continue to
operate and meet our liabilities as we mature over the two-
year period of their assessment.
Going Concern
In assessing our going concern status, we have taken
account of our financial position, anticipated future trading
performance, borrowings and other available credit
facilities, forecasted compliance with covenants on those
borrowings, and capital expenditure commitments and
plans. Our cash generation and liquidity remain adequate
and we believe we will be able to operate within
existing facilities.
The Directors are satisfied that our forecasts and
projections, that take into account reasonably possible
changes in trading performance, show that we have
adequate resources to continue in operational existence for
the next 12 months from the date of this Annual Report &
Form 20-F and that it is appropriate to adopt the going
concern basis in preparing our consolidated financial
statements for the year ended December 31, 2023.
The Strategic Report was approved by the Board of
Directors and signed on its behalf by:

David E. Johnson
Chairman of the Board
March 19, 2024

The Chairman’s Governance
Statement
| |||||
Dear Shareholder,
As a Board we have been driving our governance standards towards meeting
best practice, and it has been my privilege to work with this Board which is
committed to maintaining high standards of corporate governance. As
Chairman of the Group, my role is to provide leadership, ensuring that the
Board performs its role effectively and has the capacity, ability, structure,
corporate governance systems and support to enable it to continue to do so.
This Governance section of this Annual Report & Form 20-F provides an
update on our Board and Corporate Governance Policy. It includes our
Corporate Governance Code compliance statements and the reports of the
Board committees, namely the Audit & Risk, Nomination & Governance,
Remuneration, and Sustainability & Safety Committees.
In these reports, we set out our governance structures and explain how we
have applied the UK Corporate Governance Code and additional changes
implemented due to the Group’s recent NYSE-listing.
|
 |
||||
 David E. Johnson
Chairman of the Board
March 19, 2024
|
|||||
“ |
|||||
As a Board we have been
driving our governance
standards towards meeting
or exceeding best practice.
|
|||||
Governance Framework
The Group’s success is directly linked to sound and
effective governance and we remain committed to
achieving high standards in all we do. The Directors
recognize the importance of strong corporate governance
and have developed a corporate governance framework
and policies appropriate to the size of the Group.
As the Group grows, the Directors and Senior Leadership
Team continue to review and adjust our approach, make
ongoing improvements to the Group’s corporate
governance framework and policies and procedures as part
of building a successful and sustainable company. For
example, in connection with our NYSE-listing, the Group
refreshed its governance framework to incorporate NYSE
Rules and SEC Rules, as appropriate. Among other things,
this involved reviewing each Board committee charter and
implementing several new governance policies.
Good governance creates the opportunity for appropriate
decisions to be made by the right people at the right time
to support the delivery of our strategy and manage any
risks associated with delivery of that strategy.
Board Agenda and Activities
During the Year
The Board is responsible for the direction and overall
performance of the Group with an emphasis on policy and
strategy, financial results and major operational issues.
During the year, the matters reserved for the Board’s
decision have been reviewed and re-affirmed. Specific
matters for the Board’s consideration include:
—Approval of the Group’s strategic plan;
—Review of the performance of the Group’s strategy,
objectives, business plans and budgets;
—Review and assess the Group’s sustainability goals,
including the Group’s GHG emission intensity
reduction targets;
—Review and assess the Group’s health and safety metrics
and goals;
—Approval of the Group’s operating and capital
expenditure budgets and any material changes to them;
—Review of material changes to the Group’s corporate
structure and management and control structure;
—Review of changes to governance and business policies;
—Monitoring efforts related to community and stakeholder
engagement;
—Ensuring an effective system of internal control and
risk management;
—Ensure that appropriate succession planning procedures
are in-place;
—Approval of annual and interim reports and accounts,
and preliminary announcements of year-end results; and
—Review of the effectiveness of the Board and
its committees.
The Board delegates matters not reserved for the Board to
the Senior Leadership Team.
BOARD OF DIRECTORS
Defines business strategy, assesses risks and monitors performance
| ||||||
Remuneration Committee
Responsible for the Group’s
remuneration policy, and for
setting pay levels and bonuses
for senior management in line
with individual performance.
Ensures safety and
sustainability KPIs are included
in remuneration packages.
|
Sustainability &
Safety Committee
Monitors the Group’s social,
ethical, environmental and
safety performance, and
oversees all sustainable
development issues on
behalf of the Board.
|
Nomination & Governance
Committee
Ensures a balance of skills,
knowledge, independence,
experience and diversity
on the Board and its
committees. Monitors
the Group’s
governance structure.
|
Audit & Risk Committee
Supports the Board in
monitoring the integrity of
the Group’s financial
statements and reviews the
effectiveness of the Group’s
system of internal controls
and risk
management systems.
|
|||
CEO
Takes ultimate responsibility for delivering on strategy, financial and operating performance.
| ||||||||
Executive Vice
President of
Operations
Description of role
Coordinates operating
activities and
sustainability initiatives
to ensure transparency
and long-term value for
DEC’s stakeholders.
|
President & Chief
Financial Officer
Description of role
Manages the finance
and accounting
activities of the Group
and ensures that its
financial reports are
accurate and
completed in a
timely manner.
Oversees the Group’s
information technology
function to ensure
safety and soundness of
internal controls and
systems.
|
Chief Legal &
Risk Officer
Description of role
Responsible for legal and
compliance, government,
policy engagement,
community engagement
and land and mineral
owner engagement.
|
Executive Vice
President & Investment
Officer
Description of role
Responsible for
identifying and valuing
acquisition targets and for
developing and
implementing a
commodity marketing
strategy to maximize
commodity revenues.
|
Chief Human Resources
Officer
Description of role
Responsible for HR
function and employee
relations, policies,
practices and operations.
|
||||
Responsibility
—Operations
—EHS
—Sustainability
—Regulatory
|
Responsibility
—Treasury
—Accounting &
Financial Reporting
—Investor Relations
—Information
Technology
—Sustainability
Reporting
|
Responsibility
—Legal & Compliance
—Land
—Policy Engagement
—Community
Relations
|
Responsibility
—Acquisitions
—Marketing
|
Responsibility
—Human Resource
|
||||
Risk Management
Guidelines
—Employee Handbook
and Code of
Business Conduct &
Ethics
—EHS Policy & Field
Operating Guidelines
—Socio-Economic
Policy
|
Risk Management
Guidelines
—Employee Handbook
and Code of
Business Conduct &
Ethics
—Tax Policy
—Anti-Bribery &
Corruption Policies
|
Risk Management
Guidelines
—Employee Handbook
and Code of Business
Conduct & Ethics
—Anti-Bribery &
Corruption Policies
—Compliance Hotline &
Whistleblowing Policy
—Securities Dealing
Policy
|
Risk Management
Guidelines
—Employee Handbook
and Code of Business
Conduct & Ethics
—Anti-Bribery &
Corruption Policies
|
Risk Management
Guidelines
—Employee Handbook
and Code of Business
Conduct & Ethics
—Anti-Bribery &
Corruption Policies
—Compliance Hotline &
Whistleblowing Policy
|
||||
Stakeholder
Engagement
Responsibility
—Communities
—Employees
—Joint Operating
Partners
—Suppliers
|
Stakeholder
Engagement
Responsibility
—Employees
—Rating Agencies
—Financial Institutions
—Debt & Equity
Investors
|
Stakeholder
Engagement
Responsibility
—Employees
—Industry Associations
—Communities
—Land & Mineral
Owners
—Government &
Regulators
|
Stakeholder
Engagement
Responsibility
—Customers
|
Stakeholder
Engagement
Responsibility
—Employees
—Communities
|
||||
Board Effectiveness,
Composition and Independence
As of December 31, 2023, the Board was comprised of
seven Directors being the Group’s CEO, the Non-Executive
Chairman (who was independent upon appointment) and
five other Non-Executive Directors, all of whom were
deemed Independent Non-Executive Directors under the
UK Corporate Governance Code. As a foreign private issuer,
under the listing requirements and rules of the NYSE, we
are not required to have independent directors on our
Board, except that our audit committee is required to
consist fully of independent directors, subject to certain
phase-in schedules. Our Board has determined that six of
our seven Directors do not have a relationship that would
interfere with the exercise of independent judgment in
carrying out the responsibilities of a director and that each
of these directors is “independent” as that term is defined
under the rules of the NYSE.
On January 1, 2023, Kathryn Z. Klaber was appointed to the
Board as an Independent Non-Executive Director. She
currently serves on the Nomination & Governance
Committee and Sustainability & Safety Committee. This
appointment was the culmination of a search effort led by
the Nomination & Governance Committee, utilizing a
leading external Board-appointment vendor, Heidrick &
Struggles, which does not have any connection to the
Group. Ms. Klaber brings to the Board a range of
professional experience, including deep EHS, governance,
regulatory and risk management experience.
On September 15, 2023, Bradley G. Gray stepped down
from his role as an Executive Director of the Board
concurrent with his appointment as the Group’s President
and Chief Financial Officer.
The skills and experience of the Non-Executive Directors
are wide and varied and contribute to productive and
challenging discussions in the boardroom ensuring the
Board has appropriate independent oversight. For more
details on the skills, knowledge and experience of our
Board please see the Directors’ biographies in the Board of
With a Non-Executive Chairman, and, as of January 1, 2024,
four other Independent Non-Executive Directors, over half
of the Board is independent and the Audit & Risk and
Remuneration Committees are independent. As Mr. Thomas
has served on the Board for nine years as of January 1,
2024, the Board no longer considers him independent.
Female representation at the Board level has improved
from 29% in late-2019 to 43% as of December 31, 2023
(three out of seven Board members being female).
Recognizing the importance of workforce engagement,
Sandra M. Stash serves as the Director responsible for
workforce engagement as required under the UK Corporate
Governance Code. The Non-Executive Director Employee
Representative directly engages with employees and
provides a forum for feedback to management. These
discussions cover a variety of topics including the Group’s
culture, policies and actions. Ms. Stash has served as the
Non-Executive Director Employee Representative since
2019. Further information on her role and the work
this Annual Report & Form 20-F.
The Board provides effective leadership and overall
management of the Group’s affairs. It approves the Group’s
strategy and investment plans and regularly reviews
operational and financial performance and risk
management matters. A schedule of matters reserved for
the Board is included in the previous section.
The Board and its committees hold regularly scheduled
meetings each year. Additional meetings are held when
necessary to consider matters of importance that cannot be
held over until the next scheduled meeting.
All Directors have access to the advice and services of the
Group’s solicitors and the Group’s Corporate Secretary,
who is responsible for ensuring that all Board procedures
are followed. Any Director may take independent
professional advice at the Group’s expense in the
furtherance of their duties.
In accordance with the UK Corporate Governance Code, the
Directors must stand for re-election annually. The Group’s
Articles of Association also require any new Director
appointed by the Board during the year to retire at the next
Annual General Meeting (“AGM”) and offer themselves
for re-election.
The Board delegates certain responsibilities to the Board
committees, listed below, which have clearly defined terms
of reference.
These terms of reference are reviewed annually to ensure
they remain fit for purpose and can be viewed on the
Group’s website at www.div.energy.
GENDER DIVERSITY |
TENURE |
|
3 of 7
Directors are Female
|
2 of 7
0-3 years
|
|
 |
||
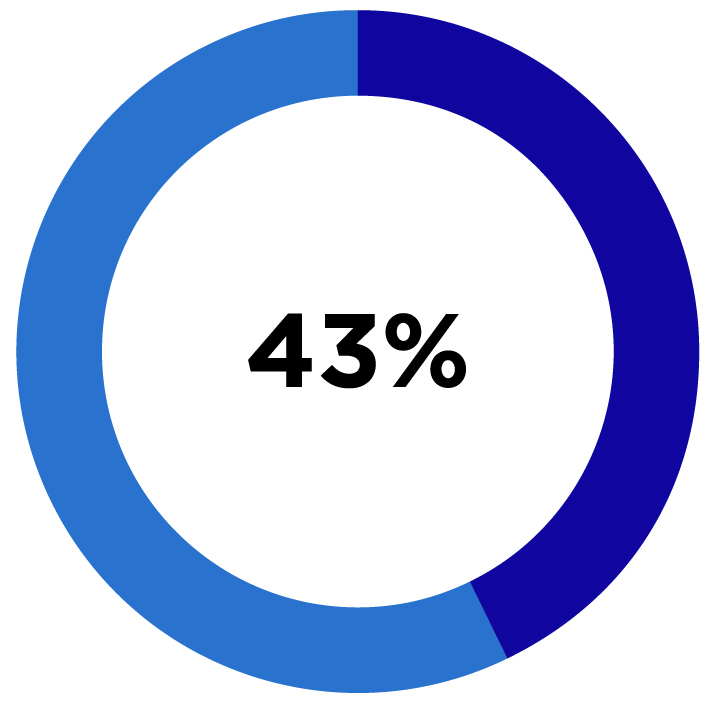 |
||
2 of 7
4-6 years
|
||
|
||
3 of 7
7+ years
|
||
 |
From left to right: Mr. David J. Turner, Jr.; Mr. Martin K. Thomas; Ms. Sylvia Kerrigan; Ms. Sandra M. Stash; Mr. Rusty Hutson, Jr.;
Mr. David E. Johnson; Ms. Kathryn Z. Klaber; Mr. Bradley G. Gray (served on the Board through September 15, 2023).
Board Committees
The Directors have established four Board committees: an
Audit & Risk Committee, Remuneration Committee,
Nomination & Governance Committee, and Sustainability &
Safety Committee. The members of these committees are
constituted in accordance with the requirements of the UK
Corporate Governance Code (the “Code”), as applicable.
The terms of reference of the committees have been
prepared in line with prevailing best practice, including the
provisions of the Code. A summary of the delegated duties
and responsibilities, terms of reference of the committees
and their activities for the year are presented in their
committee reports set out below.
Board Diversity
Diversity is a key component of the Group’s Board
composition, with emphasis placed not only on gender but
also on culture, nationality, experience and cognitive
diversity. The Board has recruited consistently over the last
few years to enhance its diversity and is focusing on a
period of stability before making further additions.
Although the Board does not currently have any ethnically
diverse members, it acknowledges the UK Listing Rules’
diversity targets, which the Group intends to continue to
closely examine and evaluate in 2024 in terms of Board
membership, additions, recruitment and retention.
The Board is pleased to report it has achieved two of the UK Listing Rules’ targets of (i) more than 40% female representation
on the Board, with 43% of the Board being female and (ii) a female holding a senior Board position, with Ms. Kerrigan serving
as the Senior Independent Director.
Diversity targets – Progress Update
Target |
Progress |
The Board aspires to meet and ultimately exceed the target
for at least 40% of Board positions to be held by females.
|
We are pleased to report that as at December 31, 2023, 43%
of our Board identified as female.
|
That at least one of the positions of Chair, CEO, CFO or
Senior Independent Director is held by a female.
|
As of December 31, 2023, our Senior Independent Director
position is held by a female.
|
That at least one member of the Board is from a minority
ethnic background.
|
While we have not achieved this target yet, we continually
aspire to increase diverse representation on our Board.
|
Board and Executive Management Diversity
Prepared in accordance with UK Listing Rule 9.8.6R(10) as of March 1, 2024:
GENDER IDENTITY OR SEX(a)
Number of
Board members
|
Percentage of
the Board
|
Number of senior positions
on the Board (CEO, CFO,
SID and Chair)(a)
|
Number
in executive
management
|
Percentage
of executive
management
|
|
Male |
4 |
57% |
3 |
6 |
67% |
Female |
3 |
43% |
1 |
3 |
33% |
Other categories |
0 |
0% |
0 |
0 |
0% |
Not specified/prefer not
to say
|
0 |
0% |
0 |
0 |
0% |
ETHNIC BACKGROUND
Number of
Board members
|
Percentage of
the Board
|
Number of senior positions
on the Board (CEO, CFO,
SID and Chair)(a)
|
Number
in executive
management
|
Percentage
of executive
management
|
|
White British or other
White (including
minority-white groups)
|
7 |
100% |
4 |
9 |
100% |
Mixed/Multiple
Ethnic Groups
|
0 |
0% |
0 |
0 |
0% |
Asian/Asian British |
0 |
0% |
0 |
0 |
0% |
Black/African/Caribbean/
Black British
|
0 |
0% |
0 |
0 |
0% |
Other ethnic group,
including Arab
|
0 |
0% |
0 |
0 |
0% |
Not specific/prefer not
to say
|
0 |
0% |
0 |
0 |
0% |
(a)The data reported on the basis of gender identity.
The Board continues to demonstrate diversity in a wider
sense, with Directors from the U.S. as well as the UK,
bringing a range of domestic and international experience
to the Board. The Board’s diverse range of experience and
expertise covers not only a wealth of experience of
operating in the natural gas and oil industry but also
extensive technical, operational, financial, legal and
environmental expertise. Further information on our
commitment to diversity at the Board and senior
Form 20-F.
UK CORPORATE GOVERNANCE CODE
COMPLIANCE STATEMENT
The Directors support high standards of corporate
governance, and it is the policy of the Group to comply with
current best practice in UK corporate governance.
The UK Corporate Governance Code published in July 2018
by the Financial Reporting Council (“FRC”), as amended
from time to time, (the “Corporate Governance Code”)
recommends that: (i) the Chair of the Board of Directors
should meet the independence criteria set out in the
Corporate Governance Code on appointment; and (ii) the
Board should appoint one of the Independent Non-
Executive Directors to be the Senior Independent Director.
The Chair of the Board is David E. Johnson, who was
independent as of his appointment and whom the Group
continues to consider independent, and the Senior
Independent Director is Sylvia Kerrigan. The Board also
considers Sandra M. Stash, David J. Turner, Jr., Sylvia
Kerrigan and Kathryn Z. Klaber to meet the independence
criteria set out in the Corporate Governance Code.
Currently, the Board is of the opinion that as of the date of
this report it fully complies with the requirements of the
Corporate Governance Code other than as set out below.
The Corporate Governance Code recommends that the
chair of the Remuneration Committee should have served
on a remuneration committee previously for at least 12
months. When Sylvia Kerrigan was appointed as chair of
the Remuneration Committee, she had only served on the
committee for approximately 9 months. However, as of
March 17, 2023, Sylvia Kerrigan had served on the
Remuneration Committee for a full 12 months and, as a
result, the Group is currently in compliance in this respect.
Additionally, the Directors acknowledge the requirement to
implement a diversity policy that will be applicable to the
Group’s administrative, management and supervisory
bodies and the remuneration, audit and nomination
committees. The Group has yet to finalize such a policy at
this time but is committed to encouraging diversity and will
continue to evaluate and develop plans and policies in the
coming year that will promote diversity. Current disclosures
on the Group’s diversity achievements is included in the
section “Our Employees - Workforce Diversity” in the
with the Board closely overseeing progress against
regulatory and stakeholder expectation.
OUR APPROACH TO GOVERNANCE
As of the date of this Annual Report & Form 20-F, our
Board is made up of seven Directors: one Executive
Director, chairman and five Non-Executive Directors (four
of whom are independent).
Alongside the continued focus on our business strategy, we
achieved significant milestones in 2023 in strengthening
core areas of the business. One such area of focus was
corporate governance, where we engaged external
consultants to advise on Board best practices, including
independence, composition and diversity.
Key Governance Improvements During 2023
The Board recognizes the benefits of good governance
and is seeking to apply this in a meaningful way. DEC is a
rapidly evolving company that is in an expansion and
transition phase. Accordingly, the Board is acutely aware of
the need to rapidly and effectively integrate new businesses
into the reporting and governance framework of the Group,
as determined by the Board. It is recognized that the Board
has a key role in balancing the fundamental elements of
good governance, namely to deliver business growth
and build trust while maintaining a dynamic
management framework.
The Board appreciates the importance of good and
effective communication and remains in close contact with
its shareholders and other stakeholders.
The Board is actively engaged in the process of solidifying
its governance framework for its rapidly expanding
business. The Board concluded that overall compliance with
governance best practice has improved during the year
under review, with the following having been achieved:
—The Board re-affirmed several key governance policies
including the following: Securities Dealing Code,
Compliance Hotline and Whistleblowing Policy,
Anti-Bribery Policy, Socio-Economic Policy, Modern
Slavery Policy, EHS Policy, Climate Change Policy,
Employee Relations Policy, Human Rights Policy and
Business Partners Policy. Additionally, in 2023, the
Board reviewed and approved the following new
governance policies: Biodiversity Policy, Code of
Business Conduct & Ethics, Tax Policy and
Hedging Policy.
—The Board achieved further progression of the Group’s
overall corporate governance framework and practices,
taking into account evolving market best practices and
the Group’s NYSE-listing, including, among other things,
a review and update of the Group’s committee charters
and governance policies.
—The Audit & Risk Committee is fully independent and
continues to adopt best practice.
—The Remuneration Committee is also independent with 3
Non-Executive Directors and the Non-Executive
Chairman, and, together with a third-party consultant,
conducted a thorough review of the remuneration policy
and practices and undertook a consultation exercise with
the Group’s largest shareholders.
—Each committee completed a thorough charter
evaluation to identify gaps in coverage, relevance and
applicability as well as potential areas of improvement.
As a result of this exercise and with guidance from
external advisors, the committee charters for the
Nomination & Governance Committee, Audit & Risk
Committee and Remuneration Committee were updated
to reflect NYSE Rules and SEC Rules.
—Together with the executive management team, the
Chairman and the Nomination & Governance Committee
continued to formulate succession planning procedures
and plans around key-roles in management.
—The Board encouraged employee outreach and training
regarding the Group’s Compliance Hotline and
Whistleblowing Policy and was satisfied by measures
taken, including the placement of awareness posters with
hotline details in all major offices.
—The percentage of female Board members was increased
from 38% to 43%.
—Sylvia Kerrigan was appointed as Senior
Independent Director.
Corporate Governance Practices and Foreign
Private Issuer Status
Companies listed on the NYSE must comply with the
corporate governance standards provided under Section
303A of the NYSE Listed Company Manual. As a “foreign
private issuer,” as defined by the SEC, we are permitted to
follow home country corporate governance practices,
instead of certain corporate governance practices required
by the NYSE for U.S. domestic issuers, except that we are
required to comply with Sections 303A.06, 303A.11 and
303A.12(b) and (c) of the Listed Company Manual. Under
Section 303A.06, we must have an audit committee that
meets the independence requirements of Rule 10A-3 under
the Exchange Act. Under Section 303A.06, we must
disclose any significant ways in which our corporate
governance practices differ from those followed by
domestic companies under NYSE listing standards. Finally,
under Section 303A.12(b) and (c), we must promptly notify
the NYSE in writing after becoming aware of any non-
compliance with any applicable provisions of this Section
303A and must annually make a written affirmation to the
NYSE. Further, an LSE listed company must disclose in its
annual financial report a statement of how the listed
company has applied the principles set out in the UK
Corporate Governance Code, in a manner that would
enable shareholders to evaluate how the principles have
been applied, and a statement as to whether the listed
company has (a) complied throughout the accounting
period with all relevant provisions set out in the UK
Corporate Governance Code; or (b) not complied
throughout the accounting period with all relevant
provisions set out in the UK Corporate Governance Code
and if so, setting out: (i) those provisions, if any it has not
complied with; (ii) in the case of provisions whose
requirements are of a continuing nature, the period
within which, if any, it did not comply with some or all of
those provisions; and (iii) the company’s reasons for
non-compliance.
For the purposes of NYSE rules, so long as the Group
qualifies as a foreign private issuer, we are eligible to take
advantage of certain exemptions from NYSE corporate
governance requirements provided in the NYSE rules. We
are required to disclose the significant ways in which our
corporate governance practices differ from those that
apply to U.S. companies under NYSE listing standards.
Section 312.03 of the NYSE Rules requires that a listed
company obtain, in specified circumstances, (1) shareholder
approval to adopt or materially revise equity compensation
plans, as well as (2) shareholder approval prior to an
issuance (a) of more than 1% of its ordinary shares
(including derivative securities thereof) in either number or
voting power to related parties, (b) of more than 20% of its
outstanding ordinary shares (including derivative securities
thereof) in either number or voting power or (c) that would
result in a change of control. The Group intends to follow
home country law in determining whether shareholder
approval is required. Section 302 of the NYSE Rules also
requires that a listed company hold an annual shareholders’
meeting for holders of securities during each fiscal year. We
will follow home country law in determining whether and
when such shareholders’ meetings are required.
The Group may in the future decide to use other foreign
private issuer exemptions with respect to some or all of the
other requirements under the NYSE Rules. Following our
home country governance practices may provide less
protection than is accorded to investors under the NYSE
listing requirements applicable to domestic issuers. We
intend to take all actions necessary for us to maintain
compliance as a foreign private issuer under the applicable
corporate governance requirements of the Sarbanes-Oxley
Act of 2002, the rules adopted by the SEC and NYSE listing
standards. Because we are a foreign private issuer, our
directors and senior management are not subject to
shortswing profit and insider trading reporting obligations
under Section 16 of the Exchange Act. They will, however,
be subject to the obligations to report changes in share
ownership under Section 13 of the Exchange Act and
related SEC rules.
Board of Directors
The Group has a commitment to strong governance, reporting and operating
standards. At the date of this report, the current Board consists of seven Directors:
including a Non-Executive Chair (who was independent upon appointment and
whom the Group continues to consider independent), a Non-Executive Vice-Chair,
an Executive Director, the Senior Independent Director, three additional
independent Non-Executive Directors.
|
||||
COMMITTEE MEMBERSHIPS |
||||
 |
Audit & Risk |
|||
 |
Nomination |
|||
 |
Remuneration |
|||
 |
Sustainability & Safety |
|||
    |
Chair |
|||
 |
Committee Membership:
Remuneration Committee, Sustainability & Safety Committee
Experience:
Mr. Johnson has served on our board of directors since February 2017 and as our
Non-Executive Chairman of the Board since April 2019. He has worked at a number
of leading investment firms, as both an investment analyst and a manager, and more
recently in equity sales and investment management. Mr. Johnson currently serves on
the board of Chelverton Equity Partners, an AIM-listed holding company, where he
serves as a member of the Remuneration, Audit & Nomination committees.
Previously, Mr. Johnson was a consultant at Chelverton Asset Management from
August 2016 to February 2019. Prior to that, he worked as a fund manager for the
investment department of a large insurance company and then as Head of Sales and
Head of Equities at a London investment bank. Mr. Johnson earned a Bachelor of Arts
in Economics from the University of Reading.
Key Strengths:
Investment sector knowledge; providing strong leadership to the Board in
connection with the Board’s role of overseeing strategy and developing
stakeholder relations.
Current External Roles:
Chelverton Equity Partners (Director), an AIM-listed holding company.
|
David E. Johnson
Non-Executive Chairman,
Independent upon Appointment
Age 63
Appointed February 3, 2017 and
as Chair of the Board on April 30,
2019
|
 |
Committee Membership:
None
Experience:
Mr. Hutson is our co-founder and has served as our Chief Executive Officer since
the founding of our predecessor entity in 2001. Mr. Hutson also serves on our
board of directors. Mr. Hutson is the fourth generation in his family to immerse
himself in the natural gas and oil industry, with family roots dating back to the
early 1900s. Mr. Hutson spent many summers of his youth working with his father
and grandfather in the oilfields of West Virginia. He graduated from Fairmont
State College (WV) with a degree in accounting. After college, Mr. Hutson spent
13 years steadily progressing into multiple leadership roles at well-known banking
institutions such as Bank One and Compass Bank. His final years in the banking
industry were spent as CFO of Compass Financial Services. Building upon his
experiences in the natural gas and oil industry, as well as the financial sector, Mr.
Hutson established Diversified Energy Company in 2001. After years of refining his
strategy, Mr. Hutson and his team took the Company public in 2017. He continues
to lead his team and expand the Group’s footprint. With a rapidly growing
portfolio, Mr. Hutson remains focused on operational excellence and creating
shareholder value.
Key Strengths:
Deep understanding and leadership in the natural gas and oil sector; strong track
record in developing and delivering results in line with strategy.
Current External Roles:
Vice Chairman of Board of Governors of Fairmont State University
|
Rusty Hutson, Jr.
Co-Founder and Chief Executive
Officer
Age 54
Appointed July 31, 2014
|
 |
Committee Membership:
Nomination & Governance Committee
Experience:
Mr. Thomas has served on our board of directors since January 2015. He is a
consultant in the corporate team of the law firm Wedlake Bell LLP in London.
During a legal career of over 35 years, Mr. Thomas specialises in advising on IPOs
and secondary offerings of equity and debt on the London capital markets,
corporate governance requirements for UK listed companies, corporate finance
and M&A work (including cross-border transactions). Previously named one of The
Lawyer’s “UK Hot 100 Lawyers” and ranked by both Chambers and Partners and
Legal 500, Mr. Thomas has advised clients operating in a variety of sectors,
including natural gas and oil, renewable energy, natural resources and mining,
climate change, financial services and early stage technology. Mr. Thomas has also
held senior management positions including seven years as the European
Managing Partner of a global law firm headquartered in the United States.
Key Strengths:
Corporate law; advising on mergers and acquisitions; public offerings.
Current External Roles:
Wedlake Bell LLP (Consultant) and Jasper Consultants Limited (Director).
|
Martin K. Thomas
Non-Executive Vice Chair
Age 59
(independent through 12/31/23)
Appointed January 1, 2015
|
 |
Committee Membership:
Sustainability & Safety Committee (Chair), Remuneration Committee,
Audit & Risk Committee
Experience:
Ms. Stash has served on our board of directors since October 2019. Ms. Stash
accumulated more than 35 years of international experience in the natural gas and
oil and hard rock and coal mining industries, beginning her career as one of the
first female drilling engineers in North America and most recently served as
Executive Vice President for Tullow Oil until her retirement on 1 April 2020. During
her time in these industries, Ms. Stash developed deep business and operations
experience across six continents and is recognized for her unique capabilities in
bridging the extractive sector to external stakeholders – in government, civil
society and at the community level. Her distinguished professional career also
included roles at ARCO, TNK-BP, BP, Anaconda and Talisman Energy, and
spanned top leadership positions in general management, commercial
negotiations, operations and engineering, supply chain management, government
and public affairs, sustainability and HSE. Ms. Stash holds a Directorship
Certification through the National Association of Corporate Directors and also
serves on the boards of Trans Mountain Company and Chaarat Gold.
Key Strengths:
Risk management and sustainability; operations and engineering;
employee engagement
Current External Roles:
Colorado School of Mines (Board of Governors member), Trans Mountain
Corporation, a Canadian Crown Corporation (Director) and Chaarat Gold Holdings
Limited (Director), an AIM-listed gold mining company.
|
Sandra M. Stash
Independent Non-Executive
Director and Non-Executive
Director Employee
Representative
Age 64
Appointed October 21, 2019
|
 |
Committee Membership:
Audit & Risk Committee (Chair), Remuneration Committee
Experience:
Mr. Turner has served on our board of directors since May 2019. Mr. Turner serves as
Chief Financial Officer of Regions Financial Corporation (“Regions”) and is a member
of the Regions Executive Leadership Team. Regions is an NYSE-listed S&P 500
banking group. Mr. Turner leads all of Regions’ finance operations, including financial
systems, investor relations, corporate treasury, corporate tax, management planning
and reporting, and accounting. Mr. Turner joined Regions in 2005 and led the Internal
Audit Division before being named Chief Financial Officer in 2010. His responsibilities
included overseeing various audits of the overall corporation, reporting to the Audit
and Risk Committee of the Board of Directors. Prior to joining Regions, Mr. Turner
served as an Audit Partner of KPMG LLP and previously served Arthur Andersen LLP
in a number of positions, culminating in Audit Partner. His primary focus was auditing
financial institutions. Mr. Turner earned a BS degree in accounting from the University
of Alabama and attended Tulane University in Louisiana.
Key Strengths:
Financial expert with recent and relevant experience; capital markets; financial
operations; audit experience.
Current External Roles:
Regions Financial Corporation (CFO) and Junior Achievement of Alabama, Inc.
(Board and Executive Committee).
|
David J. Turner, Jr.
Independent Non-Executive
Director
Age 60
Appointed May 27, 2019
|
 |
Committee Membership:
Nomination & Governance Committee (Chair), Audit & Risk Committee, Sustainability
& Safety Committee
Experience:
Ms. Klaber has served on our board of directors since January 2023. Ms. Klaber has
more than 30 years of experience with a focus on energy development and EHS
compliance complements the Board’s collective experience. Ms. Klaber currently
serves as the Managing Director of The Klaber Group, which provides strategic
consulting services to businesses and organizations with a focus on energy
development in the United States and abroad. Prior to founding The Klaber Group,
Ms. Klaber launched and led the Marcellus Shale Coalition as its first CEO, growing
the organization to be the premier regional trade association for the natural gas
and oil industry in the Northeastern Unites States. As CEO from 2009 to 2013 of
the Marcellus Shale Coalition, Ms. Klaber worked closely with elected leaders,
regulators and member companies to advance the responsible development of the
Appalachian Basin. Ms. Klaber's other experience also includes serving as
the Executive Vice President for Competitiveness at the Allegheny Conference on
Community Development and Executive Director of the Pennsylvania Economy
League where her work focused on advancing key policy and regulatory matters.
Earlier in her career, Ms. Klaber accumulated significant experience in EHS strategy
and compliance with the international consulting firm Environmental Resource
Management. Ms. Klaber holds an undergraduate degree in environmental science
from Bucknell University and a Masters in Business Administration from
Carnegie Mellon University.
Key Strengths:
Regulatory compliance, energy specific sustainability programs; EHS processes
industry knowledge, risk management; governance
Current External Roles:
The Klaber Group (Managing Director); RLG International (Director) processes,
industry knowledge, risk management; governance
|
Kathryn Z. Klaber
Independent Non-Executive
Director
Age 58
Appointed January 1, 2023
|
 |
Committee Membership:
Remuneration Committee (Chair), Nomination & Governance Committee
Experience:
Ms. Kerrigan has served on our board of directors since October 2021. Ms. Kerrigan
provides a wealth of experience in the energy, industrial and transportation sectors
where she has engaged in corporate responsibility and sustainability, merger and
acquisition, regulatory, risk management, cybersecurity and information privacy
matters. Ms. Kerrigan currently serves as the Chief Legal Officer for Occidental
Petroleum (NYSE: OXY). Prior to working at Occidental, Ms. Kerrigan served as the
Executive Director of the Kay Bailey Hutchinson Energy Center for Business, Law and
Policy at the University of Texas where she also earned a Doctor of Jurisprudence
degree and served in a number of roles with Marathon Oil Corporation over the
course of more than 20 years. In her time with Marathon Oil Corporation, she held a
number of roles overseeing public policy, legal and compliance,
corporate positioning and external communications before retiring in 2017 after eight
years as the Executive Vice President, General Counsel and Corporate Secretary.
Prior to working at Marathon, Ms. Kerrigan served in various domestic and
international corporate, government and legal roles, including an appointment to the
United Nations Security Council in Geneva, Switzerland. Ms. Kerrigan holds a NACD
Directorship Certification through the National Association of Corporate Directors.
Key Strengths:
Corporate law, governance, merger and acquisition, regulatory, risk management,
cybersecurity and information privacy matters, corporate responsibility
and sustainability.
Current External Roles:
Occidental Petroleum (Chief Legal Officer) and Team Industrial Services
(Lead Director).
|
Sylvia Kerrigan
Senior Independent
Non-Executive Director
Age 58
Appointed October 11, 2021
|
Senior Management
 |
Mr. Gray has served as our President and Chief Financial Officer since September
2023, and prior to that served as Executive Vice President, Chief Operating Officer
since October 2016. Prior to joining us, Mr. Gray served as the Senior Vice President
and Chief Financial Officer for Royal Cup, Inc. from August 2014 to October 2016.
Prior to that, from 2006 to 2014, Mr. Gray served in various roles at The McPherson
Companies, Inc., most recently as Executive Vice President and Chief Financial
Officer from September 2006 to December 2013. Mr. Gray previously worked in
various financial and operational roles at Saks Incorporated from 1997 to 2006.
Mr. Gray has a B.S. degree in Accounting from the University of Alabama and earned
his CPA license (Alabama).
Key Strengths:
Corporate structure; operational processes and management; acquisition integration;
finance; strategic support to the CEO.
Current External Roles:
None
|
Bradley G. Gray
President and Chief
Financial Officer
Age 55
|
 |
Mr. Sullivan has served as our Senior Executive Vice President, Chief Legal & Risk
Officer, and Corporate Secretary since September 2023, and prior to that served as
Executive Vice President, General Counsel and Corporate Secretary since 2019. Prior
to joining us, Mr. Sullivan worked with Greylock Energy, LLC (an ArcLight Capital
Partners portfolio company) and its predecessor, Energy Corporation of America,
from 2012 to 2017, most recently as Executive Vice President, General Counsel and
Corporate Secretary from 2017 to 2019. Prior to that, Mr. Sullivan served as counsel
for EQT Corporation from 2006 to 2012. He is a member of the leadership and board
of directors of several commerce, legal and industry groups, and has considerable
experience in corporate governance and reporting, corporate responsibility and
sustainability matters, complex commercial transactions, land/real estate,
acquisitions & divestitures, financing, government investigations and corporate
workouts and restructurings. Mr. Sullivan received a B.A. from the University of
Kentucky and a J.D. degree from the West Virginia University College of Law. He
holds licenses to practice law in several states, including Pennsylvania and West
Virginia.
Key Strengths:
Legal expert, mergers and acquisitions, land/real estate, regulatory compliance and
governance, risk management and strategic support to the CEO
Current External Roles:
None
|
Ben Sullivan
Senior Executive Vice President,
Chief Legal & Risk Officer, and
Corporate Secretary
Age 45
|
Directors’ Report
The Directors present their report on the Group, together with
the audited Group Financial Statements, for the year ended
December 31, 2023.
Board of Directors
The Directors of the Group who were in office during the
year and up to the date of signing the financial
statements were:
—David E. Johnson - Non-Executive Chair (independent
upon appointment)
—Rusty Hutson, Jr. - Chief Executive Officer and
Executive Director
—Bradley G. Gray - President and Chief Financial Officer
and Executive Director (until September 15, 2023)
—Martin K. Thomas - Non-Executive Vice Chair
(independent from 1/1/2023 to 12/31/2023)
—David J. Turner, Jr. - Independent Non-
Executive Director
—Sandra M. Stash - Independent Non-Executive Director
—Sylvia Kerrigan - Senior Independent
Non-Executive Director
—Kathryn Z. Klaber - Independent Non-Executive Director
Incorporation and Listing
The Company was incorporated on July 31, 2014, and
completed the transfer to the Premium Listing Segment of
the Official List of the Financial Conduct Authority (“FCA”)
and admission to the Main Market of the LSE from AIM in
May 2020. The Company commenced trading on the New
York Stock Exchange (“NYSE”) on December 18, 2023.
Review of Business, Outlook
and Dividends
The Group is a natural gas, NGLs and oil producer and
midstream operator and is focused on acquiring and
operating mature producing wells with long lives and
low-decline profiles. The Group’s assets have historically
been located within the Appalachian Basin, but the Group
has acquired assets expanding its footprint into the Central
Region, consisting of the states of Louisiana, Texas and
Oklahoma. The Group is headquartered in Birmingham,
Alabama, U.S., and has field offices located throughout the
states in which it operates.
Details of the Group’s progress during the year and its
future prospects, including its intended dividend strategy,
Results
The Group’s reported statutory earnings for 2023 was
$760 million, or $16.07 per share, and when adjusted for
certain non-cash items, it reported adjusted EBITDA of
$543 million, or $11.51 per share. The Group’s adjusted
EBITDA for 2022 was $503 million, or $11.92 per share. For
& Form 20-F.
Dividend Approach
The Board’s target has been to return free cash flow to
shareholders by way of dividend, on a quarterly basis, in
line with the strength and consistency of the Group’s
cash flows.
For the three months ended March 31, 2023, the Group paid
a dividend of $0.875 per share on September 29, 2023. For
the three months ended June 30, 2023, the Group paid a
dividend of $0.875 per share on December 29, 2023. For
the three months ended September 30, 2023, the Group
expects to pay a dividend of $0.875 per share on March 28,
2024. For the three months ended December 31, 2023, the
Group expects to pay a dividend of $0.29 per share.
The Directors may further revise the Group’s approach to
dividends from time to time in line with the Group’s actual
results and financial position. The Board’s approach to its
dividend reflects the Group’s current and expected future
cash flow generation potential.
Disclosure of Information under
LR 9.8.4R
The information that fulfills the reporting requirements
under this rule can be found on the pages identified below.
Section |
Topic |
Location |
(1) |
Interest capitalized |
Director’s Report, starting on
page 133
|
(2) |
Publication of unaudited
financial information
|
Not applicable |
(4) |
Details of long-term
incentive schemes
|
Directors’ Remuneration
Report, starting on page 148
|
(5) |
Waiver of emoluments by
a Director
|
Not applicable |
(6) |
Waiver of future
emoluments by a
Director
|
Not applicable |
(7) |
Non pre-emptive issues
of equity for cash
|
Share Capital, starting on
page 134
|
(8) |
As item (7), in relation to
major subsidiary
undertakings
|
Not applicable |
(9) |
Parent participation in a
placing by a listed
subsidiary
|
Not applicable |
(10) |
Contracts of significance |
Material Contracts, starting on
page 238
|
(11) |
Provision of services by a
controlling shareholder
|
Not applicable |
(12) |
Shareholder waivers of
dividends
|
Not applicable |
(13) |
Shareholder waivers of
future dividends
|
Not applicable |
(14) |
Agreements with
controlling shareholders
|
Not applicable |
Directors’ Interest in Shares
The Directors’ beneficial interests in the Group’s share
capital, including family interests, on December 31, 2023 are
shown below. These interests are based on the issued share
capital at that time. As of March 1, 2024, there have been no
changes to the Directors’ interests. The Non-Executive
Directors will purchase shares after the release of this
Annual Report & Form 20-F pursuant to the Non-Executive
Director Share Purchase Program implemented in 2022.
Director |
Appointed |
Shares of £0.20 |
% of Issued Share Capital |
Rusty Hutson, Jr. |
July 31, 2014 |
1,207,645 |
2.54% |
Bradley G. Gray(a)
|
October 24, 2016 |
146,947 |
0.31% |
Martin K. Thomas |
January 1, 2015 |
112,250 |
0.24% |
David E. Johnson |
February 3, 2017 |
23,750 |
0.05% |
David J. Turner, Jr. |
May 27, 2019 |
26,923 |
0.06% |
Sandra M. Stash |
October 21, 2019 |
2,234 |
0.00% |
Kathryn Klaber |
January 1, 2023 |
1,050 |
0.00% |
Sylvia Kerrigan |
October 11, 2021 |
1,341 |
0.00% |
1,522,140 |
3.20% |
(a)Bradley G. Gray stepped down from the Board effective September 15, 2023.
Future Developments
The Directors continue to review and evaluate strategic
acquisition opportunities recommended by the Senior
Leadership Team, which align with the strategy and
requirements of the Group. Additional details are
& Form 20-F.
Share Capital
As of December 31, 2023, the Group’s issued share capital
consisted of 47,923,726 shares with a par value of £0.20
each, with ~31% of record holders in the U.S. and ~57% of
record holders in the UK. The Group has only one class of
share and each share carries the right to one vote at the
Group’s AGM. No person has any special rights of control
over the Group’s share capital and all issued shares are fully
paid. There are no specific restrictions on the size of a
holding nor on the transfer of shares, which are both
governed by the general provisions of the Group’s Articles
of Association and prevailing legislation. The Directors are
not aware of any agreements between holders of the
Group’s shares that may result in restrictions on the transfer
of securities or on voting rights. The amount of interest
capitalized by the Group during the period under review is
immaterial.
The Group was authorized by shareholders at the 2023
AGM held on May 2, 2023 to purchase in the market up to
10% of its issued shares (excluding any treasury shares),
subject to certain conditions laid out in the authorizing
resolution. The standard authority is renewable annually;
the Directors will seek to renew this authority at the
upcoming AGM. Details of shares issued and repurchased
by the Group during the period are set out in Note 16 in the
Notes to the Group Financial Statements.
In February 2023, the Group placed 6,422,200 new shares
at $25.34 per share (£21.00) (stated on an adjusted basis
post the share consolidation) at a 5.2% discount to raise
gross proceeds of $163 million (approximately £135 million).
The new shares placed represented 13.4% of the Group’s
existing share capital at the date of placement. The Group
used the proceeds to fund the Tanos II transaction,
discussed in Note 5.
Employee Benefit Trust
An Employee Benefit Trust (“EBT”) was established in 2022
to purchase shares already in the market and is operated
through a third-party trustee. The objective of the EBT is to
benefit the Group’s employees and in particular, to provide
a mechanism to satisfy rights to shares arising on the
exercise or vesting of awards under the Group’s share-
based incentive plans and reduce dilution for shareholders.
As of March 1, 2024, the EBT holds 354,441 shares and has
distributed 435,072 shares under the Group’s share-based
incentive plans.
Financial Instruments
Details of the Group’s principal risks and uncertainties
relating to financial instruments are detailed below and in
Note 25 in the Notes to the Group Financial Statements.
Risk Management
Risk management is integral to all of the Group’s activities.
Each member of executive management is responsible for
continuously monitoring and managing risk within the
relevant business areas. Every material decision is preceded
by an evaluation of applicable business risks. Reports
on the Group’s risk exposure and reviews of its risk
management are regularly undertaken and presented to
the Board. Additional details regarding the Group’s risk
management can be found in Principal Risks and
Report & Form 20-F.
Securities Dealing Code
The Group adopted a Securities Dealing Code for share
dealings appropriate for a company listed on the Premium
Listing Segment of the Official List of the FCA and admitted
to the Main Market of the LSE and NYSE-listed company.
The code applies to the Directors, members of the Senior
Leadership Team and other relevant employees of the
Group and is monitored by the Group’s compliance-
focused employees.
Other Corporate
Governance Policies
The Board reviewed and reaffirmed several key governance
policies in 2023, including the following:
—Compliance Hotline and Whistleblowing Policy - aims to
provide guidance as to how individuals may raise their
concerns and to ensure that they may do so confidently
and confidentially.
—Anti-Bribery & Corruption Policy - acknowledges the
Group’s commitment to right and ethical practices and
addresses bribery and corruption risk as a part of the
Group’s overall risk management strategy.
—Socio-Economic Policy - affirms the Group’s
commitment to being recognized as a leader in the field
of corporate responsibility and recognizes the added
value for our shareholders.
—Modern Slavery Policy - recognizes that modern slavery
is a significant global human rights issue and has many
forms including human trafficking, forced labor, child
labor, domestic servitude, people trafficking and
workplace abuse. The Group is committed to respecting
internationally recognized human rights, including
ensuring that we are in no way involved or associated
with the issue of forced or involuntary labor and that
modern slavery and human trafficking are not taking
place in any part of our business.
—EHS Policy - guides activities to protect employees,
contractors, the public and the environment.
—Climate Change Policy - recognizes that climate
change is a complex global issue and that the Group is
committed to playing its part in supporting the global
transition to a lower carbon world by reducing the
impact of the Group’s operations through
advancements and investments in our processes,
equipment and capabilities.
—Employee Relations Policy - acknowledges the value of
the Group’s employees and highlights the Group’s
commitments to promote employee safety, health and
well-being.
—Human Rights Policy - recognizes the Group’s
commitment and responsibility to ensure that human
rights are upheld in every of its business operations
and to promote human rights where it can make a
positive contribution.
—Business Partners Policy - provides the standards the
Group expects from its consultants, outsourced
providers, subcontractors, vendors and suppliers to
adhere to in their business activities with the Group.
The Board also reviewed and adopted the following new
governance policies in 2023:
—Biodiversity Policy - outlines the Group’s commitment to
promote a net positive impact on the environment and
its natural biodiversity.
—Code of Business Conduct and Ethics - provides the
standards the Group expects from its Directors, officers
and employees, including honest and ethical conduct,
compliance with applicable laws and prompt internal
reporting and accountability for adherence to the code.
—Tax Policy - outlines the Group’s tax objections and the
foundation of the Group’s tax approach.
These corporate governance policies can be viewed on the
Group’s website at www.div.energy.
Subsequent Events
Refer to Note 28 in the Notes to the Group
Financial Statements.
Director Attendance at Board and Committee Meetings
Directors are expected to attend and participate in all Board meetings and meetings of committees on which they serve and
are expected to be available for consultation with management as requested from time to time. Regular Board and committee
meetings are held at such times as the Board and committees, respectively, may determine. Special meetings may be called
upon appropriate notice at any time.
The following table shows the number of Board and committee meetings required to be held and actually held in 2023:
Type of Meeting |
Number of Meetings
Required to be Held
|
Number of
Meetings Held
|
Board of Directors |
0 |
11 |
Audit & Risk Committee |
3 |
6 |
Nomination & Governance Committee |
2 |
2 |
Remuneration Committee |
2 |
7 |
Sustainability & Safety Committee |
2 |
5 |
Members of the Board attended Board and committee meetings (to the extent they were members of such committee in
2023) as summarized in the following table.
Director |
Committee Seats
(during 2023)
|
Board |
Audit & Risk
Committee
|
Nomination &
Governance
Committee
|
Safety &
Sustainability
Committee
|
Remuneration
Committee
|
Rusty Hutson, Jr. |
None |
11 |
0 |
0 |
0 |
0 |
Bradley G. Gray(a)
|
None |
11 |
0 |
0 |
3 |
0 |
David E. Johnson |
 |
11 |
0 |
2 |
5 |
7 |
Martin K. Thomas(b)
|
 |
11 |
4 |
2 |
0 |
0 |
Kathryn Z. Klaber(c)
|
 |
11 |
2 |
2 |
5 |
0 |
Sandra M. Stash |
 |
11 |
6 |
0 |
5 |
7 |
David J. Turner, Jr. |
 |
11 |
6 |
- |
0 |
7 |
Sylvia Kerrigan |
 |
9 |
0 |
2 |
0 |
7 |
(a)Left the Sustainability & Safety Committee concurrent with his departure from the Board on September 15, 2023, and thus was not required
to attend the last two committee meetings held in 2023.
(b)Left the Audit & Risk Committee on September 15, 2023 and thus was not required to attend the last two committee meetings held in 2023.
(c)Appointed to the Audit & Risk Committee on September 15, 2023 and thus was not required to attend the first four committee meetings held
in 2023.
DIRECTORS’ INDEMNITIES
As permitted by the Group’s Articles of Association, the
Directors have the benefit of an indemnity, which is a
qualifying third-party indemnity provision as defined by
Section 234 of the Companies Act 2006. The indemnity was
in force during the financial year and remains in force at the
date of this report. The Group also purchased and
maintained throughout the financial period Directors’ and
officers’ liability insurance in respect of itself and its
Directors. This confirmation is given and should be
interpreted in accordance with the provisions of Section 418
of the Companies Act 2006.
CONFLICT OF INTEREST
There are no potential conflicts of interest between any
duties owed by the Directors or members of the Senior
Leadership Team to the Group and their private interests
and/or other duties. In addition, there are no arrangements
or understandings with any of the shareholders of the
Group, customers, suppliers or others pursuant to which
any Director or member of the Senior Leadership Team was
selected to be a Director or Senior Manager. The Group
tests regularly to ensure awareness of any future potential
conflicts of interest and related party transactions.
Directors are required to declare any additional or changed
interests at the beginning of each Board meeting. In the
event a conflict should arise, the pertinent Director would
not take part in decision making related to the conflict.
Additionally, there are no family relationships among any of
our Directors or Senior Managers.
SUBSTANTIAL SHAREHOLDERS
As of March 1, 2024, the following shareholders hold greater than 3% of the Group’s issued shares with voting rights:
Shareholders(a)
|
Number of Shares |
% of Issued Share Capital |
NYSE Control Account |
3,160,498 |
6.64% |
Hargreaves Landsdown |
2,842,924 |
5.98% |
Interactive Investor |
2,480,602 |
5.21% |
Columbia Management Investment Advisers |
2,394,439 |
5.03% |
Vanguard Group |
2,326,236 |
4.89% |
JO Hambro Capital Management |
2,281,524 |
4.80% |
GLG Partners |
2,230,257 |
4.69% |
BlackRock |
2,054,151 |
4.32% |
M&G Investments |
1,998,712 |
4.20% |
abrdn |
1,929,927 |
4.06% |
(a)The Group derives the information from TR1 notifications, its third-party performed annual shareholder analysis to support its Foreign Private
Issuer status as a U.S. Corporation listed on the LSE, and from periodic third-party share register reports it receives.
INDEPENDENT AUDITORS
The independent auditors, PricewaterhouseCoopers LLP
(“PwC”), have expressed their willingness to continue in
office as auditors and a resolution to reappoint
PricewaterhouseCoopers LLP will be proposed at the
forthcoming AGM.
CORPORATE GOVERNANCE STATEMENT
The Directors recognize the importance of sound corporate
governance and their associated report is set out in the
Report & Form 20-F. The Group reports against the UK
Corporate Governance Code.
As further described in the UK Corporate Governance
Report & Form 20-F, the Group is currently in compliance
with the Corporate Governance Code other than as set on
ENGAGEMENT WITH EMPLOYEES’
STATEMENT
The Group is exempted from some reporting requirements,
as it did not employ more than 250 employees in the UK
during the year under review. As of December 31, 2023, the
Group had 1,603 full-time employees, with 1,214 production
employees and 389 production support employees located
in ten states in the U.S.
In line with industry standards in the country of
employment, our employees maintain a range of
relationships with union groups. The Group has not
previously experienced labor-related work stoppages or
strikes and believe that our relations with union groups and
our employees are satisfactory.
As per Section 54(1) of the Modern Slavery Act 2015, our
Modern Slavery Policy is reviewed and approved by the
Board annually and published on ourwebsite at
www.div.energy. The statement covers the activities of the
Group and details policies, processes and actions we have
taken to ensure that slavery and human trafficking are not
taking place in our supply chains or any part of our
business. More information on our Modern Slavery Policy
can be found on our website at www.div.energy.
Pursuant to the Group’s Employee Handbook, the Group
will endeavour to make reasonable accommodation to the
known physical or mental limitations of qualified employees
with disabilities.
ENGAGEMENT WITH
STAKEHOLDERS’ STATEMENT
The Group adheres to best-in-class operating standards,
with a strong focus on EHS to ensure the safety of its
employees, local communities and the environment in
which the Group operates. This element of reporting is
Form 20-F. Furthermore, the Director designated to engage
with the workforce as required under the Corporate
Governance Code is currently Sandra M. Stash.
RELATIONS WITH SHAREHOLDERS
The Group aims to maintain its committed approach to
long-term sustainability, which, alongside its strict fiscal
discipline and stewardship, maximizes returns to its
shareholders. The Directors attach great importance to
maintaining good relationships with shareholders. Extensive
information about the Group’s activities is included in its
annual and interim reports and accounts and related
presentations. The Group also issues regular updates
to shareholders.
Persons possessing market sensitive information are
notified in accordance with the Market Abuse Regulation.
The Group is active in communicating with both its
institutional and private shareholders. The AGM provides an
opportunity for all shareholders to communicate with and
to question the Board on any aspect of the Group’s
activities. The Group maintains a corporate website at
www.div.energy where information on the Group is
regularly updated, including Annual and Interim Reports
and all announcements.
The Directors are available for communication with
shareholders and all shareholders have the opportunity, and
are encouraged, to attend and vote at the AGM of the
Group during which the Board will be available to discuss
issues affecting the Group. The Board stays informed of
shareholders’ views via regular meetings and other
communications they may have with shareholders.
Following the Group's 2023 AGM and as part of its
engagement related to items on which shareholders voted
at that meeting (including Resolution 14 concerning the
Directors’ Remuneration Report which passed with 62% of
votes in favor), the Group consulted and engaged with a
number of shareholders who voted against the resolutions
to better understand their concerns. The Directors are
thankful to the shareholders for sharing their views. They
understand that the negative voting results for Resolution
14 were principally related to the specific, one-off issue of
the grant price used for the 2020 LTIP awards and the
resulting remuneration outcomes. The dialogue with the
shareholders has highlighted that there remains strong
support for the Group's remuneration policy, which was
approved by shareholders at the 2022 AGM.
The Group's Remuneration Committee has discussed the
feedback received in detail with the Board and will
maintain dialogue with shareholders on matters related to
executive remuneration.
ENVIRONMENTAL INFORMATION
The Group adheres to best-in-class operating standards,
with a strong focus on EHS to ensure the safety of its
employees. There is extensive coverage of these issues
within the Group’s 2023 Sustainability Report which will be
available on its website at www.div.energy and in the
Annual Report & Form 20-F.
DIVERSITY
We believe that an inclusive culture and diverse workforce
are healthy for a successful and sustainable business. We
value the rich diversity, skills, abilities and creativity that
people from different backgrounds and experiences bring
to the Group.
The Group is committed to encouraging diversity amongst
its workforce. Decisions related to recruitment selection,
development or promotion are based upon merit and ability
to adequately meet the requirements of the job, and are not
influenced by factors such as race, colour, religion, alienage
or national origin, ancestry, citizens, age, disability, gender,
marital status, pregnancy, veteran status, sexual orientation,
gender identity, genetic information, or any other
characteristic protected by applicable law. The Group aims
to ensure that applications for employment are given full
and fair consideration. We will continue to develop our
diversity metrics to promote equality of opportunity, pay
and reward on a non-discriminatory basis. The Group seeks
to ensure that all employees are given access to training,
development and career opportunities. In addition, every
effort is made to retrain and support employees who
become disabled while working within the Group.
CHARITABLE AND POLITICAL DONATIONS
The Group did not make any political donations or incur any
political expenditures to candidates or political campaigns
or candidates during the period.
During the year, the Group contributed nearly $2.1 million to
approximately 120 different community organizations.
section of this Annual Report & Form 20-F.
GOING CONCERN
The Directors have given careful consideration to the
appropriateness of the going concern basis in the
preparation of the financial statements. The validity of the
going concern concept is dependent on funding being
available for the working capital requirements of the Group
in order to finance the continuing development of its
existing projects for at least the next 12 months. Sufficient
funds are available in the short-term to fund the working
capital requirements of the Group. The Directors believe
that this will enable the Group to continue in operational
existence for the foreseeable future and to continue to
meet obligations as they fall due. Please refer to the
& Form 20-F for a summary of the Directors’ assessment.
ANNUAL GENERAL MEETING
The AGM of the Group will be held in London in mid-May of
2024. Full details of these proposals will be set out in a
separate Notice of AGM sent to all shareholders.
Shareholders are invited to complete the proxy form
received either by post or vote electronically in CREST in
accordance with the Notes contained in the Notice of the
AGM. The Notice of the AGM and Proxy Form are available
on the Group’s website at www.div.energy.
ADDITIONAL DISCLOSURES
Supporting information that is relevant to the Directors’
report, which is incorporated by reference into this
report, can be found throughout this Annual Report & Form
20-F.
For considerations of post balance sheet events please
refer to Note 28 in the Notes to the Group Financial
Statements within this Annual Report & Form 20-F.
The Nomination & Governance
Committee’s Report
 |
||||||
 |
 |
 |
 |
 |
||
Kathryn Z. Klaber
(58)
Independent
Non-Executive
Director
(Chair as of 9/15/23)
Strength:
Regulatory,
Sustainability
Independence from:
Management & Other
interests
|
Martin K. Thomas
(59)
Non-Executive
Director (Chair until
9/15/23; independent
from 1/1/23 to
12/31/23)
Strength:
Legal
Independence from:
Other interests
|
Sylvia Kerrigan
(58)
Senior Independent
Non-Executive
Director
Strength:
Industry, Governance
Independence from:
Management & Other
interests
|
David E. Johnson
(63)
Non-Executive
Director, Independent
upon appointment
(until 9/15/23)
Strength:
Finance
Independence from:
Management & Other
interests
|
David J.
Turner, Jr.
(60)
Independent
Non-Executive
Director
(committee member
until 1/1/23)
Strength:
Finance
Independence from:
Management &
Other interests
|
||
Key Objective
The Nomination & Governance Committee assists the Board
in (i) discharging its responsibilities related to reviewing its
structure, size and composition, (ii) recommending to the
Board any changes required for succession planning and
monitoring governance trends and best practices, and (iii)
identifying and nominating for approval Board candidates
to fill vacancies as and when they arise. The Nomination &
Governance Committee is responsible for leading the
process for appointments, ensuring plans are in place for
orderly succession for both the Board and senior
management positions, and overseeing the development of
a diverse pipeline for succession.
The committee is responsible for reviewing the results of
the Board’s Performance Review process and for making
recommendations to the Board concerning suitable
candidates for the role of Senior Independent Director, the
membership of the Board’s committees and the election or
re-election of Directors at each AGM.
The committee also oversees the Group’s governance
structure and monitors trends and compliance with
governance best practices.
Key Matters Discussed by the
Committee
During the past year the Nomination &
Governance Committee:
—Led the annual Board Performance Review process,
using Leadership Advisor Group as an outside resource,
over the course of the year, which included (i) an
evaluation of the structure, agendas and outcomes of
Board and Board committee meetings and (ii) a
comprehensive report and roundtable exercise with the
entire Board;
—Took steps with senior management to develop a
training regime for the entire Board for the 2023 year
and beyond, with training from internal personnel and
external resources on topical subjects such as
governance, oversight and Director responsibilities;
—Assessed the member composition of each Board
committee and recommended changes in connection
with Mr. Gray’s departure as an Executive Director of the
Board concurrent with his appointment as the Group’s
President and Chief Financial Officer with effect from
September 15, 2023 to ensure alignment with best
practices for Board and committee independence.
—Assisted with the transition of responsibilities in
connection with Ms. Klaber’s appointment as the
Nomination & Governance Committee Chair as of
September 15, 2023.
—Conducted (together with senior management) a
committee-by-committee assessment process to
evaluate and provide feedback to each committee chair;
—Worked with the Senior Independent Director and senior
management to facilitate the Senior Independent
Director’s review of the Chairman;
—Worked with the Chairman and senior management to
facilitate the review of the CEO;
—Worked with the Chief Human Resources Officer and
Chief Legal & Risk Officer to formulate succession
planning procedures and plans around key-roles
in management;
—Reviewed management’s stakeholder engagement
efforts and advised on strategy and best practices;
—Together with management, encouraged and maintained
oversight of the process to ensure appropriate and
proactive engagement with proxy firms;
—Monitored the gender and racial diversity statistics for
the Group’s application, interview and hiring process;
—Focused on the Group’s diversity objectives and
strategies and encouraged employee-wide diversity
training and other diversity initiatives;
—Reviewed and updated the committee’s Terms of
Reference to reflect best practices;
—Worked with management to ensure that filings
submitted to the SEC in connection with the Group’s
NYSE listing followed best recommended practices for
governance and oversight;
—Worked with external advisors and senior management
to analyze, assess and implement an enhanced
governance framework related to the Group’s NYSE
listing, including, among other things, a review and
update of the Group’s committee charters and
governance policies; and
—Encouraged and maintained oversight of employee
outreach and training regarding the Group’s Compliance
Hotline and Whistleblowing Policy and was satisfied by
measures taken, including the placement of awareness
posters with hotline details in all major offices.
Committee Effectiveness
The committee performed a critical analysis internal review
and evaluation on itself, as part of its annual self-review
process. No significant areas of concern were raised.
Membership
The committee is currently comprised of three Non-
Executive Directors, two of whom are considered
independent: Ms. Klaber (independent), the Nomination &
Governance Committee Chair, Mr. Thomas and Ms. Kerrigan
(independent). Ms. Klaber was appointed to the committee
as of January 1, 2023 and was appointed as the Nomination
& Governance Committee Chair as of September 15, 2023.
Additionally, Mr. Turner and Mr. Johnson stepped down
from the committee on January 1, 2023 and September 15,
2023, respectively. Benjamin Sullivan, Senior Executive
Vice President, Chief Legal & Risk Officer and Corporate
Secretary acts as Secretary to the committee.
Meetings and Attendance
The Nomination & Governance Committee met twice in
2023 and has met once thus far in 2024. At the end of each
committee meeting, the committee typically meets in
private executive session without management present to
ensure that points of common concern are identified and
that priorities for future attention by the committee are
agreed upon. The Chair of the committee keeps in close
contact with the Chief Executive Officer and Chief Legal &
Risk Officer between committee meetings. For committee
meeting attendance for each Director see the Directors’
Responsibilities and Terms
of Reference
The committee’s main duties are:
—Reviewing the structure, size and composition of the
Board (including the skills, knowledge, experience and
diversity of its members) and making recommendations
to the Board with regard to any changes required;
—Identifying and nominating, for Board approval,
candidates to fill Board vacancies as and when
they arise;
—Succession planning for Directors and other
senior managers;
—Reviewing annually the time commitment required of
Non-Executive Directors; and
—Overseeing the Group’s governance structure as well as
trends and compliance in governance best practices.
The committee has formal terms of reference which can be
viewed on the Group’s website at www.div.energy.
Corporate Responsibility in
Hiring
The committee and Board are proud of the progress made
to date on diversity within the Group, including achieving
the UK Listing Rules’ targets of (i) more than 40% female
representation on the Board, with 43% female Board
members, and (ii) a female holding a senior Board position,
with Ms. Kerrigan serving as the Senior Independent
Director.
The Group improved in gender balance in 2023. Evidencing
this improvement, the FTSE Women Leaders Review 2023
indicated Diversified ranks in 76th place among the FTSE
250. It also recognized 43% female representation at Board
level and 34% in the executive committee and direct
reports category (which is comprised of 35 females and 69
males). Within the energy sector, the Group is in 4th place.
The FTSE Women Leaders Review is an independent
framework supported by the Government that builds on the
excellent work of both the Hampton-Alexander and Davies
Reviews which ensures that talented women at the top of
business are recognized, promoted and rewarded.
The committee also acknowledges the UK Listing Rule
ethnic diversity targets, and the important role played by
the Parker Review, which the Group intends to continue to
closely examine and evaluate in 2024 in terms of Board
membership, additions, recruitment and retention.
The Group has a strong commitment to increasing its
gender and ethnic diversity and believes that a diverse and
engaged workforce and Board is an important goal. In
particular, the Group has taken steps to increase support
for and communication with underrepresented groups in
the communities in which it operates. It is the committee’s
hope that these efforts will increase interest in our industry
and assist in the development of an ethnically diverse
pipeline of candidates.
Board Performance Review
Consistent with last year, the Nomination & Governance
Committee selected Leadership Advisor Group as an
independent consultant to assist with the Board
Performance Review process based on the positive
experience the committee had in prior years. Leadership
Advisor Group does not have any other connection with the
Group. The Board Performance Review focused on the
following topics, among other things:
—Strategy development and implementation;
—Risk awareness, monitoring and reporting;
—Cooperation with and evaluation process of the CEO and
Senior Leadership Team;
—Board composition and dynamics;
—Onboarding and induction programs;
—Meeting structure and operation;
—Meeting effectiveness;
—Shareholder and stakeholder relations;
—Committee, Senior Independent Director and Vice
Chairman value contribution; and
—Individual evaluation of the Chairman and all
Board members.
The Board Performance Review utilized a variety of
methods, including a bespoke, online questionnaire, analysis
of how time is spent during Board meetings, Board
composition mapping and Board composition
benchmarking. The evaluation, analysis and reporting took
place from May to November 2023 and confirmed that the
Board and its committee effectively perform their
respective roles. The review highlighted certain areas for
improvement such as restructuring meeting agendas to
enhance strategic discussions.

Kathryn Z. Klaber
Chair of the Nomination & Governance Committee
March 19, 2024
The Audit & Risk Committee’s Report
|
|||||
|
 |
|
|
||
David J. Turner, Jr.
(60)
Independent Non-Executive
Director (Chair)
Strength:
Finance
Independence from:
Management & Other
interests
|
Sandra M. Stash
(64)
Independent Non-Executive
Director
Strength:
Industry
Independence from:
Management & Other
interests
|
Kathryn Z. Klaber
(58)
Independent Non-Executive
Director
(as of 9/15/23)
Strength:
Regulatory, Sustainability
Independence from:
Management &
Other interests
|
Martin K. Thomas
(59)
Non-Executive Director
(until 9/15/23;
Independent from 1/1/23
to 12/31/23)
Strength:
Legal
Independence from:
Other interests
|
||
This report covers the activities of the Audit & Risk
Committee in 2023 and in the period up to the approval of
the Annual Report & Form 20-F for the year ended
December 31, 2023.
Key Objective
The Audit & Risk Committee acts on behalf of the Board
and the shareholders to ensure the integrity of the Group’s
financial reporting. The committee’s main functions include,
among other things, reviewing and monitoring internal
financial control systems and risk management systems on
which the Group is reliant, reviewing annual and interim
accounts and auditors’ reports; making recommendations
to the Board in relation to the appointment and
remuneration of the Group’s external auditors; and
monitoring and reviewing annually the external auditors’
independence, objectivity, effectiveness and qualifications.
Key Matters Discussed by
the Committee
MAIN ACTIVITIES
—Reviewed and challenged interim and annual
financial reporting;
—Reviewed and approved the Group’s Hedging Policy;
—Reviewed the Group’s system of internal controls and
assessed its effectiveness;
—Engaged with management on the U.S. listing efforts,
including assessments of the related risks and post-
listing integration of the applicable NYSE Rules and SEC
Rules into the Group’s framework;
—Reviewed and assessed the Group’s approach to its asset
retirement obligations and overall liquidity;
—Reviewed and updated the committee’s Terms of
Reference to reflect best practices;
—Reviewed the Enterprise Risk Management control
strategy and function;
—Reviewed the Group’s procedures for detecting fraud,
prevention of bribery, and anti-money laundering
systems and controls;
—Reviewed the adequacy and security of processes for
employees and contractors to raise concerns
confidentially about possible wrongdoing in financial
reporting or other matters;
—Engaged with management regarding internal
investigations and compliance reviews;
—Oversaw the promotion of Joyce Collins to Vice
President of Internal Audit to further enhance the
Group’s internal audit function and engaged with Ms.
Collins during private executive sessions;
—Approved the external audit plan presented by PwC,
reviewed the effectiveness of the external audit and held
independent discussions with the lead audit partner as
well as private confirmatory meetings with members of
the PwC audit team; and
—Reviewed correspondence with the Financial Reporting
Council (the “FRC”) related to financial reporting.
INDEPENDENCE
—The committee regards independence of the External
Auditor as crucial in safeguarding the integrity of the
audit process and takes responsibility for ensuring an
effective three-way relationship between the committee,
the External Auditor and management. The committee
confirmed that the external auditors, PwC, remain
independent and that non-audit fees remain appropriate
and reasonable.
COMMITTEE EFFECTIVENESS
—The committee completed a critical review of its
operations and effectiveness during 2023 as part of its
annual self-review process. An independent third-party
conducted interviews with members of the committee to
obtain feedback. No significant areas of concern
were raised.
AREAS OF FOCUS IN 2024
—Review the Group’s procedures in relation to maintaining
high standards across all ethics and compliance
matters;
—Ensure that all risks are appropriately identified,
prioritized, addressed, and are managed by the
respective risk owner; and
—Enhance our internal control procedures and financial
reporting mechanisms to ensure the Group’s ability to
achieve compliance with the Sarbanes-Oxley Act.
Membership
In line with the recommendations set by the UK Corporate
Governance Code, the Audit & Risk Committee is comprised
of three Independent Non-Executive Directors members:
David J. Turner, Jr., the Audit & Risk Committee Chair and
Financial Expert, Sandra M. Stash and Kathryn Z. Klaber.
Martin K. Thomas was appointed to the committee as a
Non-Executive Director as of January 1, 2023 and stepped
down from the committee on September 15, 2023
concurrent with Ms. Klaber’s appointment to the
committee. Benjamin Sullivan, Senior Executive Vice
President, Chief Legal & Risk Officer and Corporate
Secretary acts as Secretary to the committee.
The committee has recent and relevant financial experience
through the leadership of Mr. Turner, who is presently the
Chief Financial Officer at Regions Financial Corporation, a
publicly traded U.S. bank that is a member of the S&P 500
Index. Each committee member has been selected to
provide a wide range of financial and commercial expertise
necessary to fulfil the committee’s responsibilities.
No members of the Audit & Risk Committee have outside
connections with the Group’s external auditors.
Meetings and Attendance
The Audit & Risk Committee met six times in 2023 and has
met once thus far in 2024. Before each meeting, the
committee Chair met with the members of the finance team
to ensure there was a shared understanding of the key
issues to be discussed. Committee meetings are held in
advance of Board meetings to facilitate an effective and
timely reporting process. The committee Chair provided a
report to the Board following each meeting. For committee
meeting attendance for each Director see the Directors’
The committee regularly meets in private executive
sessions without management present, one with the Vice
President of Internal Audit and one with committee
members only, to ensure that points of common concern
are identified and that priorities for future attention by the
committee are agreed upon. It also conducts private
discussions with PwC as appropriate to ensure that the
committee has a clear and unobstructed line of
communication with its external auditors. The Chair of the
committee keeps in close contact with the Chief Legal &
Risk Officer, the Vice President of Internal Audit, the
President and Chief Financial Officer, Corporate Controller,
the finance team and the external auditors between
committee meetings.
Detailed below are the members of the Senior Leadership
Team who were invited to attend meetings as appropriate
during the calendar year. In addition, PwC attended certain
of the meetings by invitation as auditors to the Group.
—Rusty Hutson, Jr., Chief Executive Officer
—Bradley G. Gray, President and Chief Financial Officer
—Benjamin Sullivan, Senior Executive Vice President, Chief
Legal & Risk Officer, and Corporate Secretary
—Martin K. Thomas, Vice Chairman of the Board
—David E. Johnson, Chairman of the Board
—Michael Garrett, Senior Vice President of Accounting and
Corporate Controller
—Joyce Collins, Vice President of Internal Audit
—Representatives from PwC UK and PwC U.S.
Responsibilities and Terms
of Reference
The main responsibilities of the committee are:
—Reviewing accounting policies and the integrity and
content of the financial statements, including focusing on
significant judgments and estimates used in
the accounts;
—Monitoring disclosure controls and procedures and the
adequacy and effectiveness of the Group’s internal
financial controls and risk management systems;
—Monitoring the integrity of the financial statements of the
Group to assist the Board in ensuring that the Annual
Report & Form 20-F, when taken as a whole, are fair,
balanced and understandable;
—Considering the adequacy and scope of external audits
and overseeing the relationship with the external
auditors, including appraising the effectiveness of their
work prior to considering their reappointment and
considering whether to put the external audit contract
out to tender;
—Reviewing and approving the statements to be included
in annual reports on internal control and risk
management; and
—Reviewing and reporting on the significant issues
considered in relation to the financial statements and
how they are addressed.
In 2023, the Board undertook a formal assessment of the
Group’s primary financial service vendors, including its
external auditors’, PwC, independence and will continue to
do so as part of the annual audit process and prior to
making a recommendation to the Board for the auditors’ re-
appointment. This assessment in 2023 included:
—Reviewing PwC’s non-audit services provided to the
Group, including Audit Related Assurance Services
provided and the related fees;
—Reviewing PwC’s procedures for ensuring the
independence of the audit firm, and parties and staff
involved in the audit; and
—Obtaining confirmation from the auditors that, in their
professional judgment, they are independent.
The committee has formal terms of reference which can be
viewed on the Group’s website at www.div.energy.
Actions Undertaken During
the Year
The key activities for the committee for the period under
review are set out below.
REVIEW OF THE FINANCIAL STATEMENTS
The Audit & Risk Committee monitored the integrity of the
annual financial statements and reviewed the significant
financial reporting matters and accounting policies and
disclosures in the financial reports. The external auditors
attended an Audit & Risk Committee meeting as part of the
full-year accounts approval process. The process included
the consideration of reports from the external auditors in
respect of the audit approach, and their findings in respect
of the audit of the 2023 financial statements.
“ |
|||
The committee reviewed
the presentation of the Group’s
audited results for the year ended
December 31, 2023 and the unaudited
results for the six months ended June
30, 2023 to ensure they were fair,
balanced and understandable, when
taken as a whole.
|
FINANCIAL STATEMENTS AND
PRESENTATION OF RESULTS
The committee reviewed the presentation of the Group’s
audited results for the year ended December 31, 2023 and
the unaudited results for the six months ended June 30,
2023 to ensure they were fair, balanced and
understandable, when taken as a whole. The results were
assessed to ensure they provide sufficient information for
shareholders and other users of the accounts to assess the
Group’s position and performance, business model and
strategy. In conducting this review, particular focus was
given to the disclosures included in the basis of preparation
in Note 2 in the Notes to the Group Financial Statements in
relation to the Group’s funding position and the suitability
of the going concern assumption.
The committee reviewed the significant judgments
associated with the 2023 financial statements, including
“key audit matters”, and also reviewed the supporting
evidence for the Group’s going concern assessment.
The Board is required to provide its opinion on whether it
considers that the Group’s 2023 Annual Report & Form 20-
F, taken as a whole, are fair, balanced and understandable,
and provide the information necessary for shareholders to
assess the Group’s position and performance, business
model and strategy. The committee discussed the
preparation of the Group’s 2023 Annual Report & Form 20-
F with the Board. To support the Board in providing its
opinion, the committee considered the content and overall
cohesion and clarity of the Annual Report & Form 20-F and
assessed the quality of reporting through discussion with
management and the external auditors. This included
ensuring that feedback from stakeholders and other
individuals had been addressed and that examples of best
practice had carefully been considered in the context of the
Group. The process included considering each of the
elements (fair, balanced and understandable) on an
individual basis to ensure the Group’s reporting was
comprehensive in a clear and consistent way, and in
compliance with accounting standards and regulatory and
legal requirements and guidelines. The reviews carried out
by internal functions within the Group and independent
reviewers were undertaken with a view to ensuring that all
material matters have been correctly reflected in the
Group’s 2023 Annual Report & Form 20-F. In summary, the
committee is comfortable that the overall disclosures in the
2023 Annual Report & Form 20-F are fair, balanced and
understandable, when taken as a whole.
Attention continues to be paid to the presentation of the
results and financial position in the Annual Report & Form
20-F as well as APMs as indicators of performance. The
Board considers current treatment, which retains reference
to “adjusted EBITDA” and “EBITDA” to remain appropriate.
The Board regards these measures as an appropriate way
to present the underlying performance and development of
the business since it reflects the continuing investment
being made by the Group, particularly in relation to recent
and future acquisition activity. Additionally, this is how the
Board monitors the progress of the existing Group
businesses. Accordingly, the committee believes that
adjusted EBITDA provides useful information to investors
and the market generally in understanding and evaluating
the Group’s performance.
VALUATION OF NATURAL GAS AND OIL
PROPERTIES AND RELATED ASSETS
The committee considered the carrying value of the
Group’s assets and any potential impairment triggers. It
reviewed management’s recommendations, which were
also reviewed by the external auditors, including an
evaluation of the appropriateness of the identification of
cash-generating units and the assumptions applied in
determining asset carrying values. The committee was
satisfied with the assumptions and judgments applied by
management as well as the triggering event assessment,
which concluded that depressed commodity prices
represented an impairment trigger. Upon completing the
impairment analysis, the Group determined that the
carrying amounts of certain proved properties were not
recoverable from future cash flows, and therefore,
recognized an impairment charge of $42 million. Refer to
Note 10 in the Notes to the Group Financial Statements.
The committee also considered management’s
determination of the fair values of the acquisitions made
during 2023 and challenged management on such
determination. It reviewed management’s assumptions and
judgements, which were also reviewed by the external
auditors. The committee was satisfied with the fair
values calculated.
VIABILITY AND GOING CONCERN
Management presented to the committee an assessment of
the Group’s future cash flow forecasts and profit
projections, available facilities, facility headroom, banking
covenants and the results of its sensitivity analysis. Detailed
discussions were held with management concerning the
2 in the Notes to the Group Financial Statements within this
Annual Report & Form 20-F. The committee discussed the
assessment with management and was satisfied that the
going concern basis of preparation, including the change in
the viability period, continues to be appropriate for the
Group and advised the Board accordingly. In addition, the
committee reviewed the going concern assumptions with
PwC, including PwC’s review of management’s assessment
of the Group’s ability to continue as a going concern. The
financial statements of Diversified Energy Company PLC
have been prepared on a going concern basis.
The committee reviewed and challenged management’s
process and assessment of viability by considering various
scenarios on forecasted cash flows, including a base case
and downside scenario analysis which reflects the more
severe impact of the principal risks and includes future
climate change impacts. In reaching its view, the committee
also considered: (i) financial forecasts and the appropriate
period for the viability outlook; (ii) the Group’s financing
facilities including covenant tests and future funding plans,
(iii) the updated assessment period of 2 years and (iv) the
external auditors’ findings and conclusions on this matter.
The committee also considered the adequacy and accuracy
of the disclosures in the 2023 Annual Report & Form 20-F in
respect of the Group’s future viability. Following this
thorough assessment, the committee considered the extent
of the assessment made by management to be appropriate
and recommended the viability statement, including the
change to the viability period, and related disclosures (for
inclusion in the 2023 Annual Report & Form 20-F) for
approval by the Board.
RISK MANAGEMENT
Effective risk management and controls are key to
executing the Group’s business strategy and objectives.
Risk management and control processes are designed to
identify, assess, mitigate and monitor significant risks, and
can only provide reasonable and not absolute assurance
that the Group will be successful in delivering its objectives.
The Board is responsible for the oversight of how the
Group’s strategic, operational, financial, human and
personnel, legal and regulatory risks are managed and for
assessing the effectiveness of the risk management and
internal control framework.
Embedding the enterprise risk management framework and
assessing management’s response to the Group’s material
risks continues to be an area of focus with the committee
providing challenge and direction as appropriate. During
2023, the committee continued to consider the process for
identifying and managing risk within the business and
assisted the Board in relation to compliance with the UK
Corporate Governance Code and FRC guidance.
Recognizing the evolving nature of the risk landscape, due
to the increasing pace of change in the industry, the
continued impact of the macroeconomic environment and
global instability, more than ever, the Group needs to
manage risks smartly to achieve its vision, deliver strategy
and create sustainable shareholder value.
The Group maintains a risk management program to
identify principal risks and risk mitigation activities that
includes reviewing the impact, likelihood, velocity,
mitigation measures and residual risk. A description of the
Group’s risk management program, principal risks, and risk
mitigation activities is provided in the Principal Risks and
Annual Report & Form 20-F.
In addition to the risks that management identifies through
the ongoing processes of reporting and performance
analysis, the Audit & Risk Committee has additional risk
identification processes, which include:
—A risk and control process for identifying, evaluating and
managing major business risks;
—External experts, who comment on controls to manage
identified risks; and
—A confidential and externally managed whistleblowing
hotline and a compliance reporting website for
employees to contact the Chair of the Audit & Risk
Committee, Chief Legal & Risk Officer and Head of
Human Resources in confidence.
INTERNAL AUDIT
The work performed by the Internal Audit team in 2023 and
the results of testing the risk framework continue to
support a favorable outcome on the adequacy and
effectiveness of the Group’s internal controls. The Internal
Audit team leveraged both audit work previously
completed and knowledge of the Group to arrive at that
conclusion. Internal testing was performed (and continues
to take place) on the key controls identified throughout the
business processes that impact the financial statements.
There was additional focus around the completeness and
accuracy element of support, updating process
documentation, and completing walkthroughs of the
processes with the Group’s external auditors.
At each committee meeting, an update on Internal Audit is
provided covering an overview of the work undertaken in
the period, actions arising from audits conducted, the
tracking of remedial actions, and progress against the
Internal Audit Plan. The team continues to be led by the
Vice President of Internal Audit who has significant prior
experience in leading natural gas and oil industry internal
audits and has a straight line of communication available
with the Audit & Risk Committee. The team also consists of
a highly experienced audit manager as well as two
additional staff auditors, all of whom have years of industry
experience. Collectively, this team works under the
oversight of the Corporate Controller and reports to the
Chief Financial Officer who is responsible for the Group’s
ERM and internal controls framework.
The Group’s internal controls over financial reporting and
the preparation of consolidated financial information
include policies and procedures that provide reasonable
assurance that transactions have been recorded and
presented accurately. Management regularly conducts
reviews of the internal controls in place in order to provide
a sufficient level of assurance over the reliability of the
financial statements.
INTERNAL CONTROL SYSTEMS
The committee is responsible for overseeing management’s
establishment and maintenance of the Group’s system of
internal control and reviewing its effectiveness. Internal
control systems are designed to meet the particular needs
of the Group and the particular risks to which it is exposed.
The Board has reviewed the Group’s risk management and
control systems noting they were in place for the year
under review and up to the date of approval of the 2023
Annual Report & Form 20-F and believes that the controls
are satisfactory, given the nature and size of the Group.
The internal controls, which provide assurance to the Audit
& Risk Committee of effective and efficient operations,
internal financial controls and compliance with laws and
regulations include:
—A formal authorization process for investments;
—An organizational structure where authorities and
responsibilities for financial management and the
maintenance of financial controls are clearly defined;
—Anti-bribery and corruption policies and procedures and
a dedicated telephone number and website designed to
address the specific areas of corruption risk faced by the
Group; and
—A comprehensive financial review cycle where annual
budgets are formally approved by the Board and
monthly variances are reviewed against detailed financial
and operating plans.
The committee considered the inherent risk of
management override of internal controls as defined by
Auditing Standards and performed the following actions
during 2023:
—Reviewed management’s report on the Group’s fraud
prevention framework and the key controls in place in its
operations designed to prevent and detect fraud, as well
as future plans for enhancement of the relevant controls;
—Discussed the on-going assessment of application
controls and the impact on the Group’s fraud framework.
Once complete, this assessment will help identify the
information technology controls that already exist within
certain financial processes and provide further
confidence in the strength of fraud prevention;
—Discussed the steps management had taken, including
designing a fraud detection process for the specific fraud
risks identified;
—Financial processes identified with critical fraud risk
potential were reviewed at an elevated level and controls
adjusted accordingly per discussion with management;
—Assessed the measures in place, including segregation of
duties ensuring independent review, to mitigate against
the risk of management override of controls;
—Discussed PwC’s audit procedures, including the results
of their conclusions relating to the fraud risk in revenue
recognition with a particular focus on ensuring the
existence of revenue transactions;
—The Committee challenged management on the
robustness of the controls; and
—Reviewed the overall robustness of the control
environment, including consideration of the Group’s
whistleblowing and compliance arrangements.
The committee agreed with management’s assessment that
the overall control framework remained effective and, with
a focus on high-risk and material areas, additional controls
introduced had mitigated risk.
SAFEGUARDS AND EFFECTIVENESS OF THE
EXTERNAL AUDITORS
The committee is responsible for oversight and for
managing the relationship with our external auditors. The
committee recognizes the importance of safeguarding the
independence and objectivity of the external auditors. The
following safeguards are in place to ensure that the
independence of the auditors is not compromised.
—The Audit & Risk Committee carries out an annual review
of the external auditors regarding their independence
from the Group and that they are adequately resourced
and technically capable to deliver an objective audit to
shareholders. Based on this review, the Audit & Risk
Committee recommends to the Board the continuation,
or removal and replacement, of the external auditors;
—The external auditors may only provide non-audit
services permitted by the FRC’s Revised Ethical
Standard 2019 (the “Ethical Standard”) which was issued
in December 2019. These services include audit-related
services such as regulatory and statutory reporting as
well as other items relating to shareholder and
other circulars;
—The committee reviews all fees paid for audit and audit-
related services on a regular basis to assess the
reasonableness of fees, value of delivery and any
independence issues that may have arisen or may
potentially arise in the future;
—The external auditors report to the Directors and the
Audit & Risk Committee regarding their independence in
accordance with relevant standards;
—Non-audit services carried out by the external auditors
are limited to work that is closely related to the annual
audit or where the work is of such a nature that a
detailed understanding of the business is beneficial, and
utilizes subject matter experts not conducting
audit services;
—The committee monitors costs for non-audit services in
absolute terms and in the context of the audit fee for the
year to ensure that the potential to affect the
independence and objectivity of the auditors does not
arise. During 2023, non-audit services included work
around the Group’s half-year review and acquisitions
which did not affect the independence and objectivity of
the auditors; and
—Information related to audit fees for 2023 is
detailed in Note 7 in the Notes to the Group
Financial Statements.
This is the external auditor’s fourth year as the Group’s
external auditor following a formal tender process during
2020 and subsequent appointment at the 2020 AGM.
Tim McAllister has fulfilled the role of lead audit partner for
a fourth year.
The committee confirms that the Group has complied with
the requirements of the Statutory Audit Services for Large
Companies Market Investigation (Mandatory Use of
Competitive Tender Processes and Audit Committee
Responsibilities) Order 2014 for the financial year
under review.
The committee is cognizant of the fact that assessing
external audit quality is a key responsibility within its remit
which stakeholders look to the committee to discharge. The
Audit & Risk Committee continually monitors the
effectiveness of the external audit. To comply with this
requirement, the committee reviewed and commented on
PwC’s detailed audit plans and strategy, including the
intended scope of the audit, identification of significant and
elevated audit risks, the level of materiality proposed and
the principles of PwC’s centrally directed audit approach.
Many elements of the audit plan approach remained
consistent with the 2022 audit, and the committee
welcomed the plan to enhance the focus on utilizing
data‑enabled auditing approaches to maximize efficiencies
and insight from the auditors’ testing. Following discussion
and challenge, the committee agreed on the methodology
adopted for determining materiality and the scope of
the audit.
It then considered progress during the year by assessing
the major findings of its work, the perceptiveness of
observations, the implementation of recommendations and
the management of feedback. At the request of the Board,
the committee also monitors the integrity of the financial
information in the Annual Report & Form 20-F, half-year
results statements, and the significant financial reporting
judgments contained in them. Further details of the
committee’s procedures to review the effectiveness of the
Group’s systems of internal control during the year can be
found in the section on effective risk management and
internal control above.
The committee recognizes that all financial statements
include estimates and judgments by management. The key
audit areas are agreed upon with management and the
external auditors as part of the year-end audit planning
process. This includes an assessment by management of
the significant areas requiring management judgment and
the committee challenging management’s judgments. These
areas are reviewed with the auditors to ensure that
appropriate levels of audit work are completed, and the
committee reviews the results of this work. The numerous
interactions with the auditor provided the committee with
an insight into the quality of the audit process and the audit
leadership team, and with the opportunity to assess the
auditor’s challenge of management’s views.
ASSURANCE MEASURES
On behalf of the Board, the Audit & Risk Committee
examines the effectiveness of:
—The systems of internal control, primarily through
reviews of the financial controls for financial reporting of
the annual, preliminary and half-yearly
financial statements;
—The management of risk by reviewing evidence of risk
assessment and management; and
—Any action taken to manage critical risks or to remedy
any control failings or weaknesses identified, ensuring
these are managed through to closure.
Where appropriate, the Audit & Risk Committee ensures
that necessary actions have or are being taken to remedy
or mitigate significant failings or weaknesses identified
during the year either from internal review or from
recommendations raised by the external auditors. In 2023,
the committee did not identify any significant failings or
weaknesses in the system of risk management and internal
control. The Group’s internal controls over the financial
reporting and consolidation processes are designed under
the supervision of the Group’s President and Chief Financial
Officer to provide reasonable assurance regarding the
reliability of financial reporting and the preparation and fair
presentation of the Group’s published financial statements
for external reporting purposes, in accordance with IFRS as
issued by the International Accounting Standards Board.
Because of its inherent limitations, internal control over
financial reporting cannot provide absolute assurance and
may not prevent or detect all misstatements whether
caused by error or fraud. The Group’s internal controls over
financial reporting and the preparation of consolidated
financial information include policies and procedures that
provide reasonable assurance that transactions have been
recorded and presented accurately.
Management regularly conducts reviews of the internal
controls in place in respect of the processes of preparing
consolidated financial information and financial reporting.
During the year, there has been a significant investment in
resources, processes and personnel relating to the internal
controls of these processes to reflect the growth of the
Group. This is in order to provide a sufficient level of
assurance over the reliability of the financial statements.
OTHER FINANCIAL REPORTING MATTERS
In October 2023, the Group received a letter from the FRC
in relation to its regular review and assessment of the
quality of corporate reporting. The letter focused on the
2022 Annual Report with inquiries on the following
main areas:
—The nature of the restrictions placed on the restricted
cash balances and their classification within the
Statement of Financial Position and the Statement of
Cash Flows;
—The nature of royalty payments, how they are
determined and the extent to which they are recognized
in revenue or expenses.
The Group responded to the FRC with responses to their
inquiries and noted certain clarifying enhancements would
be made to relevant disclosures, following which the review
was closed. These enhancements have been included within
the 2023 Annual Report & Form 20-F.
An FRC review provides no assurance that the Group’s
2022 Annual Report was correct in all material respects.
The FRC’s role was not to verify the information provided,
but to consider compliance with reporting requirements. Its
letters are written on the basis that the FRC accepts no
liability for reliance on them by the Group or any third
party, including but not limited to investors
and shareholders.
Summary
For the year under review, and beyond, the Audit & Risk
Committee will continue its monitoring of financial
reporting and of internal controls and risk management, as
these evolve in response to the Group’s continuing growth
and new opportunities as they arise.

David J. Turner, Jr.
Chair of the Audit & Risk Committee
March 19, 2024
The Remuneration Committee’s
Report
|
|||||
|
|
|
|
||
Sylvia Kerrigan
(58)
Independent Non-Executive
Director (Chair)
Strength:
Industry, Governance
Independence from:
Management & Other
interests
|
David E. Johnson
(63)
Non-Executive Director,
Independent upon
Appointment
Strength:
Finance
Independence from:
Management & Other
interests
|
Sandra M. Stash
(64)
Independent Non-Executive
Director Strength:
Industry
Independence from:
Management & Other
interests
|
David J. Turner, Jr.
(60)
Independent Non-
Executive Director (as
of 1/1/23)
Strength:
Finance
Independence from:
Management & Other
interests
|
||
Letter from Chair of the
Remuneration Committee
I am pleased to present our 2023 Directors’ Remuneration
Report on behalf of the Board. Included within this report
is the Annual Report on Remuneration, which sets out
payments and awards made to the Directors for the year
ended 2023 and how the Directors’ Remuneration Policy
will operate for the year ended December 31, 2024 and a
summary of the Directors’ Remuneration Policy for which
shareholder approval was obtained at the 2022 Annual
General Meeting and which will continue to apply without
amendment for the forthcoming year. The Director’s
Remuneration Report will be presented to shareholders for
approval at the 2024 Annual General Meeting.
Key Objective
The Remuneration Committee oversees the remuneration
program of Executive Directors and the Senior Leadership
Team (“executives”) on behalf of the Board. The
Remuneration Committee is focused on ensuring that
remuneration is designed to emphasize "pay for
performance” by:
—Providing performance-driven remuneration
opportunities that attract, retain and motivate executives
to achieve optimal results for the Group and
its shareholders;
—Aligning remuneration with the Group’s short- and
long-term business objectives while providing sufficient
flexibility to address the unique dynamics of the Group’s
business model; and
—Emphasizing the use of equity-based remuneration to
motivate the long-term retention of the Group’s
executives and align their interests with those
of shareholders.
As an executive's seniority increases, and the scope, duties
and responsibilities of the executive's position expand, the
Remuneration Committee believes a greater portion of total
remuneration should be performance driven and be based
on a longer time horizon. Fixed remuneration should
therefore be a relatively smaller portion of senior executive
total remuneration with the majority of an executive’s
realized remuneration being driven by the performance of
the Group.
DEC’S PERFORMANCE IN 2023
2023 was a year of continued execution and transition. The
Group brought a focused execution on increased cash flow
generation, capital discipline, and balance sheet
management. The year also marked a transition as the
Group closed the accretive Tanos II acquisition, which
expanded Central Region upstream and midstream assets,
established a dual listing on the New York Stock Exchange,
and completed its seventh Asset-Backed Securitization that
further enhanced the Group’s liquidity.
Through its continual, daily focus on SAM and its zero
tolerance policy for fugitive emissions, the Group made
significant progress in its emissions reduction goals,
including through its handheld and aerial leak detection
and repair programs and methane-driven pneumatic device
conversions to compressed air. Further, the Group
expanded asset retirement operations, deploying 17 rigs
across Appalachia to retire a combined 383 wells –
including 182 state and federal owned orphan wells and
other third-party owned wells and 201
Diversified-owned wells.
The Group’s formal Community Giving and Engagement
Program also made meaningful contributions to
surrounding communities, with more than $2 million
contributed to various charitable, education related, and
community and stakeholder engagement and outreach
groups, and community organizations, including to food
pantries, arts and educational programs, health and
wellness organizations, and municipal services.
These achievements combined with the year’s equity
performance has impacted the performance-related pay
outcomes for the Executive team. With respect to the 2023
annual bonus, as reported elsewhere in this Annual Report
& Form 20-F, DEC’s adjusted EBITDA for 2023 was $543
million. This equated to adjusted EBITDA per basic share of
$11.51, or $11.57 per diluted share, after making certain
adjustments for acquisitions and share dilution as described
$10.60, $11.64 and $12.60 per share, respectively, Metrics
were established using the 2023 budget, with the stretch
metric achievable from over-performing in production,
management of costs, and/or executing on acquisitions.
Due to adjusted EBITDA per share being between the
threshold and target levels the committee awarded 36% for
this metric out of a potential 50%.
Under the cash cost metric the Group achieved $1.26 per
Mcfe, which is similar to the Group’s KPI for adjusted
operating cost per Mcfe, yet excludes certain adjustments
for acquisitions and production taxes. The threshold, target
and stretch metric was $1.27, $1.21 and $1.18 per Mcfe,
respectively. As such, the committee awarded 7% for this
metric out of a potential 20%.
In relation to the non-financial elements which account for
the remainder of the annual award, the two Executive
Directors (CEO and COO) were determined to have
performed towards the top end of the objectives (20% of
potential 30%). The Group’s overall performance resulted in
awards of 110.1% of salary out of a maximum of 175% of
salary being awarded to the CEO and awards of 94.4% of
salary out of a maximum of 150% of salary being awarded
to the COO under the annual bonus plan.
The 2023 financial year was the end of the three-year
performance period for the Performance Share Award
granted in 2021. The performance conditions are a mix of
Return on Equity (“ROE”) (40%), Absolute TSR (40%) and
Relative TSR (20%) targets measured over three years. The
overall payout for the award is 40% of maximum.
The 2023 financial year was also the end of the
performance period for one tranche of stock options
(“Options”) for the Executive Directors. The 3rd tranche of
the Options granted in 2019 vested at 0%. These Options
vested in three tranches based on performance ending
2021, 2022, 2023 and were subject to an Adjusted EPS
condition and Absolute TSR condition.
The committee considers that the Remuneration Policy
operated as intended during 2023 and that the
remuneration outcomes described above reflect the overall
performance by the Group. The committee determined that
no discretion needed to be applied for the above
remuneration outcomes.
Key Matters Discussed by
the Committee
The key activities carried out by the committee in 2023
with the support of key management team individuals
including the President and Chief Financial Officer,
Chief Legal & Risk Officer, and Chief Human Resources
Officer, included:
—Determining 2023 annual bonus outcomes for an
Executive Director;
—Determining base salaries of the Executive Director for
the period starting January 2024;
—Reviewing the annual total remuneration of the
Group’s executives;
—Reviewing the Group’s overall workforce remuneration
and benefits plans, ensuring alignment of incentives and
rewards with culture;
—Reviewing and approving the 2024 Executive Director
Bonus Plan and Performance Share Award targets;
—Discussed the voting results of the 2023 AGM;
—Determination that the remuneration policy for 2023
operated as intended;
—Preparing the Directors’ Remuneration Report; and
—Reviewing and updating the committee’s Terms of
Reference to reflect best practices.
DIRECTORS’ REMUNERATION POLICY
APPROVED AT THE 2022 AGM
The current policy was approved by shareholders in a
binding vote at the 2022 AGM with just under 83% of votes
cast in favor. The main features of the current package are
as follow:
—Base salaries which are broadly in-line with UK norms;
—A standard package of benefits but no pension provision;
—Annual bonus opportunity of 175% of base salary for the
CEO and 150% of salary for an Executive Director COO of
which any bonus in excess of 100% of salary is deferred
for one year;
—From 2023, Performance Share Awards with a maximum
of 325% of salary for the CEO and 275% of salary for an
Executive Director COO; and
—A shareholding requirement set at 300% of salary for the
CEO and 250% of salary for the COO whilst in
employment and a two-year post cessation
shareholding guideline.
Implementation of Directors’
Remuneration Policy for 2024
The committee has ensured that the executive
remuneration policy and practices, as well as the
committee’s charter, are consistent with the six factors set
out in Provision 40 of the Corporate Governance Code.
Matters to be Approved at our
Annual General Meeting
As no changes are proposed to the existing Policy, only one
remuneration resolution will be tabled at the 2024 AGM,
namely the advisory shareholder vote on the Directors'
Remuneration Report.
Our approach to executive pay is designed to address the
challenge of balancing a U.S. based management team with
the expectations of a UK and U.S. listed company. I hope
that our shareholders will remain supportive of the
approach and that you will vote in favor of the
remuneration resolution at the 2024 AGM.

Sylvia Kerrigan
Chair of the Remuneration Committee
March 19, 2024
Membership
The committee is currently comprised of the Non-Executive
Chairman and three Independent Non-Executive Directors:
Sylvia Kerrigan, the Remuneration Committee Chair, Sandra
M. Stash, David J. Turner, Jr., and David E. Johnson.
Benjamin Sullivan, Senior Executive Vice President, Chief
Legal & Risk Officer and Corporate Secretary acts as
Secretary to the committee.
Meetings and Attendance
The Remuneration Committee met formally seven times
during the year and has met twice thus far in 2024. The
committee regularly meets in private executive session at
the end of its committee meetings, without management
present to ensure that points of common concern are
identified and that priorities for future attention by the
committee are agreed upon. The Chair of the committee
keeps in close contact with the Chief Legal & Risk Officer
and Human Resources team between committee meetings.
For committee meeting attendance for each Director
20-F.
COMMITTEE EFFECTIVENESS
—The committee performed a critical analysis internal
review and evaluation on itself, as part of its annual self-
review process. No significant areas of concern
were raised.
Responsibilities and Terms
of Reference
A key objective of the committee is to help attract, retain
and motivate talented executives by ensuring competitive
remuneration and motivating incentives. The incentives are
linked to the overall performance of the Group and, in turn,
to the interests of all shareholders.
The Remuneration Committee is responsible for:
—Discussing and determining the Group’s framework for
executive remuneration;
—Determining the remuneration for the Executive Director;
—Reviewing remuneration for other members of the Senior
Leadership Team;
—Reviewing and recommending to the Board the
remuneration of the Non-Executive Directors; and
—Overseeing and reviewing the structure and operation of
the remuneration policy.
The committee has formal terms of reference which can be
viewed on the Group’s website at www.div.energy.
Role of Management
The Group’s Human Resources Department assists
the Remuneration Committee and its independent
compensation consultant (as applicable) in gathering the
information needed for their respective reviews of the
Group’s compensation program with respect to the Senior
Leadership Team. This assistance includes assembling
requested compensation data. The CEO develops pay
recommendations for members of the Senior Leadership
Team for review and discussion by the committee. The
committee, in private session and without executive officers
present, approves the CEO’s pay levels.
Committee Considerations
Consistent with the six factors set out in Provision 40 of
the UK Corporate Governance Code, when determining
the Directors’ Remuneration Policy and practices, the
committee has determined there are no significant
changes from the prior year and has continued to address
the following:
Clarity – the Directors’ Remuneration Policy is well
understood by our executives and has been clearly
articulated to Shareholders;
Simplicity – the committee believes the remuneration
structure is simple and well understood. The design has
avoided any complex structures which have the potential to
deliver unintended outcomes;
Risk – the Directors’ Remuneration Policy and approach to
target setting seek to discourage inappropriate risk-taking.
Malus and clawback provisions apply;
Predictability – executives’ incentive arrangements are
subject to individual participation caps. An indication of the
range of values in packages is provided in the remuneration
scenario charts. The final value of any share awards is based
on achieving performance criteria and for shares issued
their final values will depend on share price at the time
of vesting;
Proportionality – there is a clear link between individual
awards, delivery of strategy and our long-term
performance; and
Alignment to Culture – pay and policies cascade down the
organization and are fully aligned to the Group’s culture
and specifically to “pay for performance”.
External Advisors
During the year, FIT Remuneration Consultants LLP (“FIT”),
signatories to the Remuneration Consultants Group’s Code
of Conduct, provided advice to the committee on all
matters relating to remuneration, including best practice.
FIT provided no other services to the Group or its Directors
and does not have any other connection with the Group or
its Directors. Accordingly, the committee was satisfied that
the advice provided by FIT was objective and independent.
The committee selected and appointed FIT based on the
positive experience with FIT in prior years, among other
factors. FIT’s fees in respect of 2023 were $35,702 (GBP:
£28,006), plus value added tax. FIT’s fees were charged on
the basis of the firm’s standard terms of business for
advice provided.
Our approach to
executive pay is
designed to address
the challenge of
balancing a U.S.
based management
team with the
expectations of a
UK and U.S. listed
company.
Remuneration at a Glance
REMUNERATION POLICY AND IMPLEMENTATION
Stated Objective |
Overview of Policy |
Implementation for 2024
|
|||||
Base salary |
—Reviewed annually.
—Consideration given to the performance of the
Group, the individual’s performance, the
individual responsibilities or scope of the role,
and pay practices in relevant comparator
companies in both the UK and U.S.
|
Executive Director(a):
—CEO: Rusty Hutson, Jr.: $779,834
|
|||||
Pension and
benefits
|
—The current Executive Director does not receive
a pension contribution and any future provision
will be aligned to the wider workforce.
|
—The current Executive Director does not
receive a pension contribution.
—In line with the approach taken for all
employees, the Group offers a retirement plan
in accordance with subsection 401(k) of the
Internal Revenue Code in which the Executive
Director may make voluntary pre-tax
contributions towards his own retirement.
The Group matches the Executive Director’s
contributions up to $26 thousand per annum.
—Benefits consist of standard car and health/
insurance related benefits.
|
|||||
Annual bonus |
—Maximum of 175% of salary for Rusty Hutson, Jr.
—Paid in cash up to 100% of base salary;
Outcomes above this level deferred as either
shares or cash (at the individual’s discretion)
for one year provided continued service.
—Subject to the achievement of relevant
performance conditions, both qualitative
and quantitative.
—Subject to malus and clawback provisions.
|
Potential awards for 2024 performance period:
—Rusty Hutson, Jr.: 175% of salary
—Performance conditions, which will have
defined Threshold, Target, and Stretch
payout criteria:
|
|||||
 |
50% adjusted
EBITDA per
share
|
||||||
 |
20% cash cost
per Mcfe
|
 |
30% ESG/EHS
|
||||
Long-term
incentives
|
—Performance Share Awards, subject to service
and performance over a three-year period, and
eligible for payment of applicable Dividend
Equivalent Rights during the vesting period.
—Maximum award of 325% of salary for
Rusty Hutson, Jr.
—Subject to malus and clawback provisions.
|
Potential awards for 2024:
—Rusty Hutson, Jr.: 325% of salary
—Performance conditions:
|
|||||
 |
40% return
on equity
|
 |
10% relative
TSR
|
||||
 |
30% absolute
TSR
|
 |
20% emissions
|
||||
Share ownership
requirements
|
—Rusty Hutson, Jr.: 300% of salary
—Continues to apply for first year post-
employment, reducing to 200% of salary for the
second year.
|
—Rusty Hutson, Jr. meets the requirement.
|
|||||
(a)Effective January 1, 2024 and represents a 4% increase for Rusty Hutson, Jr. over 2023. This compares to increases across the Group ranging
from 0% to 10% based on performance, with an average of 4%.
INTRODUCTION
Part A: Summarizes the Director’s Remuneration Policy which was approved by shareholders at the AGM held on April 26,
2022 (the “Directors’ Remuneration Policy”).
Part B: Constitutes the Annual Report on Remuneration sections of the Executive Directors’ Remuneration Report.
PART A: DIRECTORS’ REMUNERATION POLICY
A summary of the main sections of the Directors’ Remuneration Policy, which was approved by shareholders at the 2022 AGM,
is shown below. Certain details have been updated to reflect the implementation of the policy for the year ended December 31,
2024. The policy as approved by the Group’s shareholders can be found within our 2021 Annual Report and Accounts which
are available on our website at https://ir.div.energy/reports-announcements.
The following table summarizes the Group’s policies in respect of the key elements of our Directors’ remuneration:
Element and
Purpose
|
Policy and Operation |
Maximum |
Performance Measures |
|||
Base salary
This is the core
element of pay
and reflects the
individual’s role
and position
within the Group
with some
adjustment to
reflect their
capability and
contribution.
|
—Base salaries will typically be
reviewed annually, with
consideration given to the
performance of the Group and the
individual, any changes in
responsibilities or scope of the
role and pay practices in relevant
U.S. and UK comparator
companies of a broadly similar
size and complexity, with due
account taken of both market
capitalization and turnover.
—The committee does not strictly
follow benchmark pay data, but
instead uses it as one of a number
of reference points when
considering, in its judgment, the
appropriate level of salary. Base
salary is paid monthly in cash.
|
—It is anticipated that salary
increases will generally be
in line with those awarded
to the general workforce.
That said, in certain
circumstances (including,
but not limited to, changes
in role and responsibilities,
market levels, individual and
Group performance), the
committee may make larger
salary increases to ensure
they are market
competitive. The rationale
for any such increase will be
disclosed in the relevant
Annual Report.
|
n/a |
|||
Benefits
To provide
benefits valued
by recipients.
|
—The Executive Director currently
receives standard car and health/
insurance related benefits.
—Where appropriate, the Group will
meet certain costs relating to
Executive Director relocations.
—In line with the approach taken for
all employees, the Group offers a
retirement plan in accordance
with subsection 401(k) of the
Internal Revenue Code in which
the Executive Director may make
voluntary pre-tax contributions
towards his own retirement. The
Group matches the Executive
Director’s contributions up to $26
thousand per annum.
—The committee reserves the
discretion to introduce new
benefits where it concludes that
it is appropriate to do so, having
regard to the particular
circumstances and to
market practice.
|
—It is not possible to
prescribe the likely change
in the cost of insured
benefits or the cost of some
of the other reported
benefits year to year.
—Relocation expenses are
subject to a maximum limit
of 100% of base salary,
provided that such
expenses may be paid only
in the year of appointment
and for a further two
financial years.
—With limited exceptions, the
U.S. Section 401(k) defined
contribution plan currently
provides company
matching contributions up
to a maximum of $26
thousand per annum.
—The committee will monitor
the costs of benefits in
practice and will ensure that
the overall costs do not
increase by more than what
the committee considers
appropriate in all the
circumstances.
|
n/a |
Element and
Purpose
|
Policy and Operation |
Maximum |
Performance Measures |
||||
Pension
To provide
retirement
benefits.
|
—Currently, no element of the
Directors’ remuneration is
pensionable, and the Group does
not operate any pension scheme
or other scheme providing
retirement or similar benefits.
—The committee reserves the
discretion to introduce new
benefits where it concludes that it
is appropriate to do so, having
regard to the particular
circumstances and to
market practice.
|
—The current Executive
Director does not receive a
pension contribution.
—Any future pension
provision will be limited to
levels aligned to the
contribution levels for the
majority of the workforce.
|
n/a |
||||
Annual bonus
plan
To motivate the
Executive
Director and
incentivize the
delivery of
performance
over a one-year
operating cycle,
focusing on the
short- to
medium-term
elements of our
strategic aims.
|
—Annual bonus plan levels and the
appropriateness of measures are
reviewed annually at the
commencement of each financial
year to ensure they continue to
support our strategy.
—Once set, performance measures
and targets will generally remain
unchanged for the year, except to
reflect events such as corporate
acquisitions or other major
transactions where the committee
considers it to be necessary in its
opinion to make appropriate
adjustments.
—Annual bonus plan outcomes can
be paid in cash up to 100% of
base salary. Outcomes above this
level will be deferred as either
cash or shares (at the individual’s
discretion) for one year provided
continued service. During the
deferral period, the value of any
dividends (if deferred as shares)
will be paid in cash or shares.
—Clawback provisions apply to the
annual bonus plan, and malus and
clawback will apply to deferred
shares in accordance with the
Group’s clawback and
malus policies.
|
—The maximum level of
annual bonus plan
outcomes is 175% of base
salary for the CEO.
|
—The performance measures
applied may be financial or
non-financial; quantitative and
qualitative; and corporate,
divisional or individual and
with such weightings as the
committee considers
appropriate. The metrics and
weightings applicable in 2024
are as follows:
|
||||
|
50% adjusted EBITDA
per share
|
||||||
|
20% cash cost per Mcfe
|
||||||
|
30% ESG/EHS
|
||||||
—Where a sliding scale of
targets is used, attaining the
threshold level of performance
for any measure will not
typically produce a payout of
more than 25% of the
maximum portion of the
overall annual bonus
attributable to that measure,
with a sliding scale to full
payout for maximum
performance.
—However, the annual bonus
plan remains a discretionary
arrangement and the
committee retains a standard
power to apply its discretion
to adjust the outcome of the
annual bonus plan for any
performance measure (from
zero to any cap), should it
consider that to
be appropriate.
|
|||||||
Element and
Purpose
|
Policy and Operation |
Maximum |
Performance Measures |
||||
Long-term
incentives
To motivate and
incentivize the
delivery of
sustained
performance
over the long-
term, and to
promote
alignment with
shareholders’
interests, the
Group grants
Performance
Share Awards.
|
—Performance Share Awards vest
over a period of three years, with
awards vesting to the extent
that performance conditions
are satisfied.
—Vested awards for the Executive
Director will be subject to a
further two-year holding period
during which time awards may
not normally be exercised or
released but are no longer
contingent on performance
conditions or future employment.
—After the vesting period, the value
of any dividends accrued during
the vesting period on
Performance Share Awards will be
paid in shares and will be subject
to a further two-year holding
period, or paid in cash at the
end of a further two-year
holding period.
—Clawback and malus provisions
apply to Performance
Share Awards.
|
—Performance Share Awards
may be granted with a
maximum value of 325% of
base salary per financial
year to the CEO.
—In determining the number
of shares subject to an
award, the market value of
a share shall, unless the
committee determines
otherwise, be assumed to
be the average share price
for the five days following
the announcement of the
Group’s results for the
previous financial year.
|
—The committee may set such
performance conditions on
Performance Share Awards as
it considers appropriate,
whether financial or non-
financial and whether
corporate, divisional or
individual. Performance
periods may be over such
periods as the committee
selects at grant, which will not
be less than, but may be
longer than, three years.
—The metrics and weightings
applicable in 2024 are
as follows:
|
||||
|
40% Return on Equity
|
||||||
|
30% Absolute TSR
|
||||||
|
10% Relative TSR
|
||||||
|
20% Emissions
|
||||||
—No more than 15% of awards
vest for attaining the threshold
level of performance
conditions. The committee
also has a standard power to
apply its judgment to adjust
the formulaic outcome of all
performance measures to take
account of any circumstances
(including the performance of
the Group, any individual or
business) should it consider
that to be appropriate.
| |||||||
Element and
Purpose
|
Policy and Operation |
Maximum |
Performance
Measures
|
|||
Share ownership
guidelines
To further align
the interests of
the Executive
Director with
those of
shareholders.
|
—The Executive Director is expected to build up a
prescribed level of shareholding.
—Minimum shareholding is 300% of base salary
for the CEO. The committee reserves the power
to amend, but not reduce, these levels in
future years.
—To the extent that the prescribed level has not
been reached, the Executive Director will be
expected to retain a proportion of the shares
vesting under the Group’s share plans until the
guideline is met.
—Any vested Performance Share Award shares
subject to a holding period and any shares
awarded in connection with annual bonus
deferral will be included for the purpose of the
guidelines (discounted for anticipated
tax liabilities).
—A post-employment shareholding requirement
normally applies to Performance Share Award
shares vesting after the effective date of the
Directors’ Remuneration Policy for 2022. The
policy requires the Executive Director to hold
the shares equivalent to his share ownership
guideline at that date, for a period of one year
post-employment and reducing to 200% of
salary for the second year post-employment.
|
n/a |
n/a |
|||
Chairman’s and
Non-Executive
Directors’ fees
To enable the
Group to recruit
and retain a
Chairman of the
Board and Non-
Executive
Directors of the
highest caliber.
|
—The fees paid to the Chairman and Non-
Executive Directors aim to be competitive with
other U.S. and UK listed peers of equivalent size
and complexity.
—The fees payable are determined by the Board,
and will include incremental committee Chair
and additional responsibility fees (as
applicable). Directors do not participate in
decisions regarding their own fees.
—Non-Executive Directors are reimbursed all
necessary and reasonable expenses incurred in
connection with the performance of their duties
and any tax thereon in accordance with the
Group’s Non-Executive Director Expense
Reimbursement Policy.
—No other benefits are envisaged for the
Chairman and Non-Executive Directors, but the
Group reserves the right to provide benefits,
including company related travel and
office support.
|
—Fees are paid monthly in cash.
—A proportion of each Non-
Executive Directors’ fees may be
required to be used for the
acquisition of Group shares which
must then be held until they
cease to be a Director.
—The aggregate fees and any
benefits of the Chairman and
Non-Executive Directors will not
exceed the limit from time to
time prescribed within the
Group’s Articles of Association
for such fees.
—Any increases actually made will
be appropriately disclosed.
|
n/a |
SERVICE CONTRACTS AND LETTERS OF APPOINTMENT
The following table summaries key dates for the service contracts of Rusty Hutson, Jr. and Bradley G. Gray effective as of
December 31, 2023. Note that concurrent with Mr. Gray’s appointment as the Group’s President and Chief Financial Officer, he
resigned from the Board and is no longer an Executive Director effective as of September 15, 2023.
Name |
Date of Service Contract |
Duration |
Rusty Hutson, Jr. |
January 30, 2017 |
Each Executive Director’s service agreement should be of
indefinite duration, subject to termination by the Group or
the individual on six months’ notice. The service agreements
of all current Executive Directors comply with that policy.
|
Bradley G. Gray(a)
|
January 30, 2017 |
|
The contract of the current Executive Director, which is available for inspection at the Group’s registered office, contains a
payment in lieu of notice clause which is limited to base salary only. In line with U.S. practice, depending on the circumstances
of their severance from service, the Executive Director may be entitled to certain payments, including previously accrued
salary plus 12 months salary. For each Non-Executive Director, the effective date of their latest letter of appointment is:
Name |
Date of Letter of Appointment |
Duration |
David E. Johnson |
February 3, 2017 |
|
Martin K. Thomas |
January 1, 2015 |
Initial period of 12 months, subject to re-election at each
AGM of the Group and are terminable on three months’
notice given by either party.
|
David J. Turner, Jr. |
May 27, 2019 |
|
Sandra M. Stash |
October 21, 2019 |
|
Kathryn Klaber |
January 1, 2023 |
|
Sylvia Kerrigan |
October 11, 2021 |
The full policy included in the Group’s 2021 Annual Report also includes further information on the following:
—Malus and Clawback
—Travel and Hospitality
—Differences Between the Policy on Remuneration for Directors from the Policy on Remuneration of Other Staff
—Committee Discretions
—Recruitment Remuneration Policy
—Remuneration Policy on Termination
—External Appointments
—Committee Discretion
ILLUSTRATIONS OF APPLICATION OF EXECUTIVE DIRECTOR REMUNERATION POLICY
The following charts show how the remuneration policy for the Executive Director will be applied in 2024 using the
assumptions shown overleaf:
Minimum |
—Consists of base salary, benefits and pension.
—Base salary is the salary to be paid in 2024.
—Benefits are the value received in 2023.
—No pension is provided, only 401(k) match to the extent applicable.
|
Target |
Based on what the Executive Director would receive if performance was on-target (excluding share
price appreciation and dividends):
—Annual bonus: Consists of the target bonus (50% of maximum opportunity used for
illustrative purposes).
—Long-Term Incentives (“LTI”): Consists of the target level of vesting (50% vesting) of Performance
Share Awards (at 325% of salary for Rusty Hutson, Jr.).
|
Maximum |
Based on the maximum remuneration receivable (excluding share price appreciation and dividends):
—Annual bonus: Consists of maximum bonus of 175% of base salary for Rusty Hutson, Jr.
—LTI: Consists of full vesting of Performance Share Awards (at 325% of salary for Rusty Hutson, Jr.).
|
Maximum with
share price growth
|
Based on the Maximum scenario set out above but with a 50% share price increase applied to the value
of Long-Term Incentive Plan (“LTIP”) awards.
|
($ thousands) |
Base Salary |
Benefits |
Benefit Plan(a)
|
Total Fixed |
Rusty Hutson, Jr. |
$780 |
$12 |
$31 |
$823 |
(a)Reflects amounts received under the Group’s 401(k) contribution plan and health insurance benefits.
ROBERT R. (RUSTY) HUTSON JR.
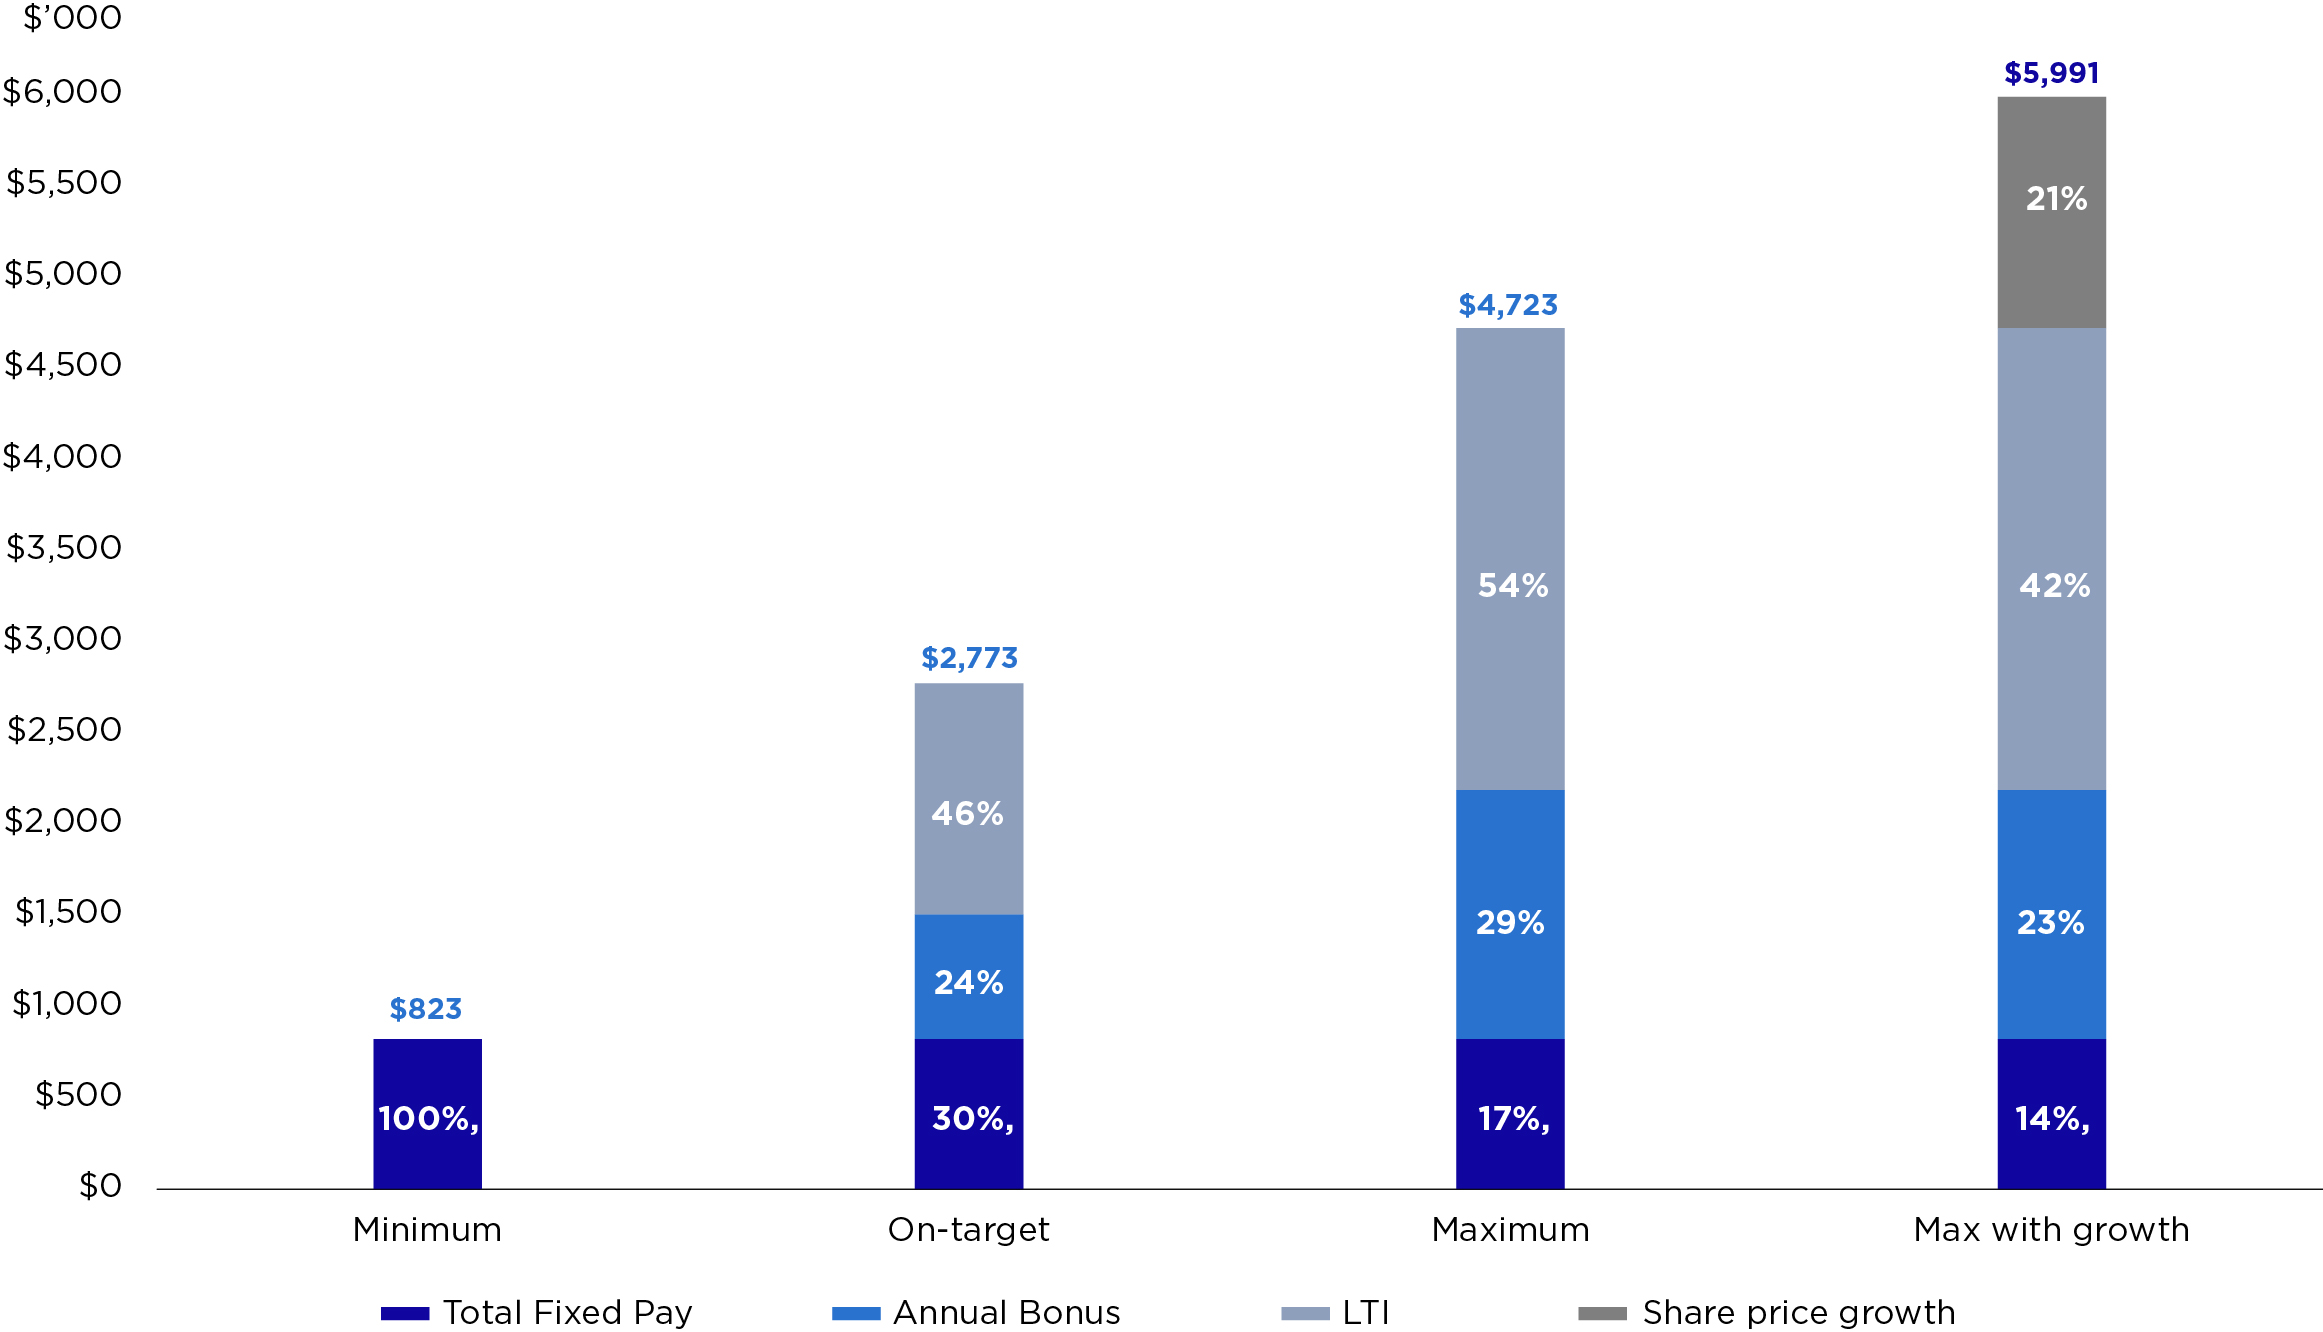
PART B: ANNUAL REPORT ON
REMUNERATION
The remuneration for the Executive and Non-Executive
Directors of the Group who performed qualifying services
during the year is detailed below. For the year ended
December 31, 2023, the aggregate compensation paid to
the members of our board of directors and our executive
officers for services in all capacities was approximately $4
million.
Executive officers are entitled to matching contributions
from the Group of up to $26 thousand per annum into their
401(k) retirement plans. They also receive a range of core
benefits such as life insurance, private medical coverage
and annual health screens.
The Non-Executive Directors received no remuneration
other than their annual fee. The aggregate fees and any
benefits of the Chairman of the Board and non-executive
directors will not exceed the limit from time to time
prescribed within the Group’s Articles of Association for
such fees which is currently £1,055,000 per annum. In
addition, non-executive directors are reimbursed all
necessary and reasonable expenses incurred in connection
with the performance of their duties and any tax thereon in
accordance with the Group’s Non-Executive Director
Expense Reimbursement Policy.
Directors’ remuneration for the years ended December 31, 2023 and 2022:
Executive Directors |
Rusty Hutson, Jr. |
Bradley G. Gray(a)
|
|||
(In thousands) |
December 31, 2023 |
December 31, 2022 |
December 31, 2023 |
December 31, 2022 |
|
Salary/Fees |
$750 |
$720 |
$323 |
$437 |
|
Taxable Benefits(b)
|
12 |
12 |
8 |
12 |
|
Benefit Plan(c)
|
31 |
37 |
15 |
36 |
|
Pension(d)
|
— |
— |
— |
— |
|
Total Fixed Pay |
793 |
769 |
346 |
485 |
|
Bonus(e)
|
825 |
1,072 |
305 |
558 |
|
Long-Term Incentives(f)
|
442 |
4,030 |
272 |
2,378 |
|
Total Variable Pay |
1,267 |
5,102 |
577 |
2,936 |
|
Total Remuneration |
$2,060 |
$5,871 |
$923 |
$3,421 |
|
Non-Executive Directors - Total Remuneration (In thousands) |
December 31, 2023 |
December 31, 2022 |
|||
David E. Johnson |
$216 |
$200 |
|||
Martin K. Thomas |
155 |
145 |
|||
David J. Turner, Jr. |
168 |
156 |
|||
Sandra M. Stash |
156 |
145 |
|||
Kathryn Z. Klaber(g)
|
139 |
— |
|||
Sylvia Kerrigan |
160 |
120 |
|||
(a)Mr. Gray ceased to be a Director on September 15, 2023. The fixed pay figures represent the period Mr. Gray was a Director for the year
ended December 31, 2023.
(b)Taxable benefits were comprised of Group paid life insurance premiums and automobile reimbursements.
(c)Reflects matching contributions under the Group’s 401(k) plan and health insurance benefits.
(d)The Executive Directors do not receive a pension provision.
(e)Further details of the bonus outcome for 2023 can be found in the 2023 Annual Bonus for Executive Directors section within this Annual
Report & Form 20-F. For 2023, the bonus totals for Rusty Hutson, Jr., and Bradley G. Gray represent 110.1% and 94.4% of approved base
salary, respectively. The amounts above 100% of salary will be deferred compulsorily into either cash or shares for one year provided
continued service, without additional performance conditions. For 2022, the bonus totals for Rusty Hutson, Jr., and Bradley G. Gray
represent 148.75% and 127.5% of base salary, respectively. The amounts above 100% of salary were deferred into cash for one year provided
continued service, without additional performance conditions.
(f)For 2023, the value of the Performance Share Award granted in 2021, including dividend equivalent units (“DEUs”) accrued to date, has been
based on the number of shares and DEUs that will vest and the three-month average share price for the period to December 31, 2023
(£13.615 per share) using an exchange rate of £1:$1.24055. The overall payout for the Performance Share Award was 40% and the grant share
price for the awards was £23.96 and, accordingly, the relevant figures are reflective of a decrease of more than 43% in the Group’s share
price over the three year period.
(g)Appointed to the Board on January 1, 2023.
2023 ANNUAL BONUS FOR EXECUTIVE DIRECTORS
For 2023 the overall bonus plan for Executive Directors was a maximum of 175% of base salary for Mr. Hutson and 150% of
salary for Mr. Gray with an actual achieved formulaic bonus of 110.1% and 94.4%, respectively. The Group delivered a strong
operational performance in 2023. The following table summarizes the performance targets and outcomes which led to the
committee’s decisions as to the payout percentages.
The targets were as follows:
Measure |
Threshold |
Target(a)
|
Maximum
(100%
Payout)
|
Actual |
% of Total
Bonus
|
Payout % |
Adjusted EBITDA per share(b)
|
$10.60 |
$11.64 |
$12.60 |
$11.57 |
50% |
35.9% |
Cash cost per Mcfe(c)
|
$1.27 |
$1.21 |
$1.18 |
$1.26 |
20% |
7.0% |
ESG and EHS |
(See below) |
30% |
20.0% |
|||
Total % of maximum |
62.9% |
|||||
Total % of salary - Rusty Hutson, Jr. |
110.1% |
|||||
Total % of salary - Bradley G. Gray |
94.4% |
|||||
(a)Target was 75% for the adjusted EBITDA per share and cash cost per Mcfe measures and 50% for the ESG and EHS measures, but for all
measures stretch allowed inclusion of acquisitions.
(b)Actual results for the adjusted EBITDA per share measure utilized fully diluted weighted average shares outstanding.
(c)Actual results for the cash cost per Mcfe measure excluded 2023 acquisitions and irregular G&A expense.
In respect of the non-financial performance targets set for the Executive Directors, these were set against a range of strategic
targets at the start of the year. The targets set were aligned to the Group’s corporate objectives and strategy. Details of the
measures, to the extent they are not commercially sensitive are shown below.
% of Total
Bonus
|
Payout
%
|
||
ESG - ENVIRONMENTAL |
|||
Target |
Performance |
15.00% |
15.00% |
Reduce methane intensity
Threshold: 6%
Target: 8%
Stretch: 10%
|
Achieved: 10%
|
10.00% |
10.00% |
Central emissions surveys
Threshold: N/A
Target: N/A
Stretch: 100%
|
Achieved: 100%
|
5.00% |
5.00% |
ESG - SOCIAL |
|||
Target |
Performance |
10.00% |
5.00% |
Reduce TRIR Rate:
Threshold: 1.12
Target: 1.03
Stretch: 0.97
|
Achieved: 1.28
|
5.00% |
0.00% |
Reduce MVA:
Threshold: 0.85
Target: 0.80
Stretch: 0.75
|
Achieved: 0.55
|
5.00% |
5.00% |
ESG - GOVERNANCE |
|||
Target |
Performance |
5.00% |
0.00% |
Diversity advisory team/Diversity training |
Achieved: 0%
|
5.00% |
0.00% |
LONG-TERM INCENTIVES OUTCOME
2021 LTIP Awards
The performance period in respect of the Performance Share Award granted in 2021 came to an end on December 31, 2023.
Performance conditions were Return on Equity (40%), Absolute TSR (40%) and Relative TSR (20%) targets measured over
three years. The targets and outcomes are set out below:
% of Total
Award
|
Threshold |
Maximum |
Achieved |
Vesting % of
Component
|
Payout %(a)
|
|
Three-Year Average ROE(b)
|
40% |
15% |
25% |
25% |
100% |
40% |
Absolute TSR (per annum) |
40% |
10% |
20% |
(7%) |
0% |
0% |
Three-Year TSR v FTSE 250 |
20% |
Median |
Upper Quartile |
Below Median |
0% |
0% |
(a)Calculated as % of total award multiplied by vesting % of component.
(b)Calculated as (adjusted EBITDA - recurring capital expenditures - interest expense) / invested equity.
Based on the vesting percentages above, the number of shares expected to vest in March 2024 and their estimated value
(based on the three-month average share price to December 31, 2023 of £13.615 per share ($16.89 per share based upon a
GBP:USD exchange rate of £1:$1.24055) are as follows:
Maximum
number of
shares(a)
|
Number of
shares to
lapse(b)
|
Number of
Shares to
vest(c)
|
Estimated
value at
vesting(d)
|
Face value of
awards
vesting(e)
|
Impact of
share price on
vesting(f)
|
|
Rusty Hutson, Jr. |
65,359 |
39,213 |
26,146 |
$441,606 |
$870,662 |
$(429,056) |
Bradley G. Gray |
40,183 |
24,108 |
16,075 |
271,507 |
535,298 |
(263,791) |
(a)Includes 23,727 and 14,587 dividend equivalent units accrued over the performance period to date in the maximum number of shares that
will vest in March 2024 for Rusty Hutson Jr. and Bradley G. Gray, respectively.
(b)Includes 14,234 and 8,751 dividend equivalent units accrued over the performance period to date in the number of shares to lapse in March
2024 for Rusty Hutson Jr. and Bradley G. Gray, respectively.
(c)Includes 9,493 and 5,836 dividend equivalent units accrued over the performance period to date in the number of shares to vest in March
2024 for Rusty Hutson Jr. and Bradley G. Gray, respectively.
(d)Based on the three-month average share price to December 31, 2023.
(e)Based on the number of shares vesting multiplied by the share price at the date of grant of £23.96 ($33.30 based upon a GBP:USD exchange
rate of £1:$1.3899).
(f)The grant share price for the award was £23.96 and accordingly the relevant figures are reflective of a decrease of 43% in the Group’s share
price comparing the award price to the estimated vesting price.
The award also received the value of dividend equivalent rights.
2019 Options
The performance period in respect of the third tranche of the Options granted in 2019 came to an end on December 31, 2023.
Performance conditions were Adjusted EPS and Annualized TSR on an equally weighted basis. The targets and outcomes are
set out below:
Threshold |
Maximum |
Achieved |
Vesting % of
Component
|
|
Adjusted EPS |
£3.80 |
£4.40 |
£2.20 |
0% |
Annualized TSR |
10% |
20% |
3% |
0% |
The number of shares expected to vest in March 2024 is shown below:
Exercise Price |
Number of
Shares in
Tranche
|
Vesting % |
Number of
Shares Vesting
|
|
Rusty Hutson, Jr. |
£24.00 |
40,000 |
0% |
0 |
Bradley G. Gray |
£24.00 |
18,333 |
0% |
0 |
SHARE AWARDS GRANTED IN 2023
2023 LTIP Awards
During the year, the Executive Directors received a Performance Share Award (conditional shares), which may vest after a
three-year performance period which will end on December 31, 2025, based on the achievement of stretching performance
conditions.
Value of Award as
a % of Base Salary
|
Face Value of
Award ($)
|
Number of Shares |
|
Rusty Hutson, Jr. |
300% |
$2,250,000 |
98,045 |
Bradley G. Gray |
250% |
1,137,500 |
49,567 |
In line with the ongoing policy, the share price used to
calculate the award was £18.694, being the average share
price over the five-day period commencing on March 21,
2023, the date that the Group issued its final 2022 results.
The awards are based upon a GBP:USD exchange rate of £1:
$1.2276, which was the exchange rate at the date of grant.
The date of grant was March 21, 2023. The LTIP Awards will
vest following completion of the performance period
(January 1, 2023 - December 31, 2025), and no later than
March 31, 2026, and vested shares will also be subject to a
further two-year holding period.
The performance conditions are a weighted mix of Return
on Equity (40%), Absolute TSR (30%), Relative TSR (10%)
and Emissions (20%) targets measured over three years as
described below. These measures encourage the generation
of sustainable long-term returns to shareholders. In
determining the level of vesting, the Remuneration
Committee will consider that the outcome of the
measurement reflects the underlying performance or
financial health of the Group.
RETURN ON EQUITY (40% OF TOTAL AWARD)
|
ABSOLUTE TSR (30% OF TOTAL AWARD)
|
|||
Three-Year Average
ROE(a)
|
% of that Part of the Award
that Vests
|
Three-Year TSR |
% of that Part of the Award
that Vests
|
|
Below 15% per annum |
0% |
Below 10% per annum |
0% |
|
15% per annum |
15% |
10% per annum |
15% |
|
25% per annum or above |
100% |
20% per annum or above |
100% |
|
15% to 25% per annum |
Pro rata straight-line between
15% and 100%
|
10% to 20% per annum |
Pro rata straight-line between
15% and 100%
|
|
RELATIVE TSR (10% OF TOTAL AWARD)
|
EMISSIONS (20% OF TOTAL AWARD)
|
|||
Three-Year TSR v FTSE
250
|
% of that Part of the Award
that Vests
|
Emissions over
Three Years
|
% of that Part of the Award
that Vests
|
|
Below median |
0% |
Below 8% Methane
Intensity Reduction
|
0% |
|
Median |
15% |
8% Methane Intensity
Reduction
|
15% |
|
Upper quartile or above |
100% |
20% Methane Intensity
Reduction
|
100% |
|
Median to upper quartile |
Pro rata straight-line between 15%
and 100%
|
8% to 20% Methane
Intensity Reduction
|
Pro rata straight-line between 15%
and 100%
|
|
(a)Calculated as adjusted EBITDA - recurring capital expenditures - interest expense) / invested equity.
OUTSTANDING EXECUTIVE DIRECTOR SHARE PLAN AWARDS
Details of all outstanding share awards as of December 31, 2023 made to Executive Directors are set out below:
Rusty Hutson, Jr. |
||||||||||
Award
Type
|
Exercise
Price
(£)
|
Grant Date |
Interest at
January 1,
2023
|
Awards
Granted
in the
Year
|
Accrued
Dividend
Equivalents
|
Awards
Exercised
in the
Year
|
Awards
Lapsed
in the
Year
|
Interest at
December
31, 2023(a)
|
Exercise/Vesting
Period
|
|
PSU |
March 21, 2023 |
— |
98,045 |
26,006 |
— |
— |
124,051 |
March 2026 |
(b) |
|
PSU |
March 15, 2022 |
81,275 |
— |
17,994 |
— |
— |
99,269 |
March 2025 |
(c) |
|
PSU |
March 15, 2021 |
53,512 |
— |
11,847 |
— |
39,213 |
26,146 |
March 2024 |
(d) |
|
Options |
£24.00 |
May 9, 2019 |
46,600 |
— |
— |
— |
40,000 |
6,600 |
May 2022
- May 2029
|
(f) |
Options |
£16.80 |
April 14, 2018 |
64,333 |
— |
— |
— |
— |
64,333 |
May 2021
- May 2028
|
(g) |
Bradley G. Gray |
||||||||||
Award
Type
|
Exercise
Price
(£)
|
Grant Date |
Interest at
January 1,
2023
|
Awards
Granted
in the
Year
|
Accrued
Dividend
Equivalents
|
Awards
Exercised
in the
Year
|
Awards
Lapsed
in the
Year
|
Interest at
December
31, 2023(a)
|
Exercise/Vesting
Period
|
|
PSU |
March 21, 2023 |
— |
49,567 |
13,146 |
— |
— |
62,713 |
March 2026 |
(b) |
|
PSU |
March 15, 2022 |
41,640 |
— |
9,218 |
— |
— |
50,858 |
March 2025 |
(c) |
|
PSU |
March 15, 2021 |
32,899 |
— |
7,284 |
— |
24,108 |
16,075 |
March 2024 |
(d) |
|
Options |
£24.00 |
May 9, 2019 |
21,358 |
— |
— |
— |
18,333 |
3,025 |
May 2022
- May 2029
|
(e) |
Options |
£16.80 |
April 14, 2018 |
29,485 |
— |
— |
— |
— |
29,485 |
May 2021
- May 2028
|
(f) |
(a)A performance factor of 40.0% was applied to 41,632 of the awards granted to Mr. Hutson and 25,596 of the awards granted to Mr. Gray in
March 2021, and 23,727 and 14,587 dividend equivalent units accrued over the performance period to date, respectively, resulting in
remaining interest of 26,146 and 16,075 total units vesting in March 2024, respectively. A performance factor of 0% was applied to 40,000 of
the awards granted to Mr. Hutson and 18,333 of the awards granted to Mr. Gray in May 2019, resulting in no options vesting in March 2024
and remaining interest of 6,600 and 3,025, respectively, which consists entirely of vested but unexercised options.
(c)Refer to the Group's 2022 Annual Report and Accounts for details of performance conditions.
(d)Refer to the Group's 2021 Annual Report and Accounts for details of performance conditions.
(e)Options granted on May 9, 2019 with an exercise price of £24.00 per share with a three-year ratable vesting period. 100% of the Options are
subject to performance conditions.
(f)Options granted on April 14, 2018 with an exercise price of £16.80 per share with a three-year ratable vesting period. Two-thirds of the
Options are subject to performance conditions.
During the year ended December 31, 2023, the highest closing price of the Group’s shares was £23.72 and the lowest closing
price was £10.78. At December 31, 2023 the closing share price was £11.15.
STATEMENT OF DIRECTORS’ SHAREHOLDING AND SHARE INTERESTS
The table below details, for each Director, the total number of Directors’ interests in shares at December 31, 2023:
Shareholding |
Shareholding
Required (% of
Salary)
|
Compliance With
Share Ownership
Guidelines
|
Share Interests |
||
Rusty Hutson, Jr. |
1,207,645 |
300% |
ü |
320,399 |
(a) |
Bradley G. Gray |
146,947 |
– |
N/A |
162,156 |
(b) |
David E. Johnson |
23,750 |
– |
(c) |
— |
|
Martin K. Thomas |
112,250 |
– |
(c) |
— |
|
David J. Turner, Jr. |
26,923 |
– |
(c) |
— |
|
Sandra M. Stash |
2,234 |
– |
(c) |
— |
|
Kathryn Z. Klaber |
1,050 |
– |
(c) |
— |
|
Sylvia Kerrigan |
1,341 |
– |
(c) |
— |
|
(a)A performance factor of 40.0% was applied to 41,632 of the awards granted to Mr. Hutson in March 2021 and 23,727 dividend equivalent
units accrued over the performance period to date, resulting in remaining interest of 26,146 total units vesting in March 2024. A performance
factor of 0% was applied to 40,000 of the awards granted to Mr. Hutson in May 2019, resulting in no options vesting in 2023. As of
December 31, 2023, 70,933 vested options remained unexercised. All other awards were unvested as of December 31, 2023.
(b)A performance factor of 40.0% was applied to 25,596 of the awards granted to Mr. Gray in March 2021 and 14,587 dividend equivalent units
accrued over the performance period to date, resulting in remaining interest of 16,075 total units vesting in March 2024. A performance
factor of 0% was applied to 18,333 of the awards granted to Mr. Gray in May 2019, resulting in no options vesting in 2023. As of December 31,
2023, 32,510 vested options remained unexercised. All other awards were unvested as of December 31, 2023.
(c)The Non-Executive Directors purchase shares twice annually pursuant to the Non-Executive Director Share Purchase Program implemented
in 2022. Shares purchased under the Non-Executive Director Share Purchase Program must be held until retirement from the Board. While
this is not part of the Share Ownership Guidelines, each Non-Executive Director is in compliance with the parameters of the Non-Executive
Director Share Purchase Program.
PAYMENTS TO PAST DIRECTORS
Robert Post retired as a Board member in April 2020.
Mr. Post continued to provide advice to the Board post-
retirement as a consultant, receiving fees in 2023 of
$97,500.
PAYMENTS FOR LOSS OF OFFICE
Bradley G. Gray resigned from the Board effective as of
September 15, 2023 and received no payment for loss
of office. Mr. Gray continues to be employed by the Group
as its President & Chief Financial Officer.
No payments for loss of office were made during the year.
EXECUTIVE DIRECTORS SERVING AS
NON-EXECUTIVE DIRECTORS OF
OTHER COMPANIES
During the year none of the Executive Directors served as a
Non-Executive Director of any other company in respect of
which any Board-related remuneration was received.
PERFORMANCE GRAPH AND CEO REMUNERATION TABLE
The Directors’ Remuneration Report Regulations 2002 require a line graph showing the TSR on a holding of shares in the
Group since admission to the Premium Segment of the Main Market of the LSE to the most recent financial year end following
such admission, as well as the TSR for a hypothetical holding of shares in a broad equity market index for the same period. The
Group was admitted to the Main Market on May 18, 2020 and the graph below covers that period, comparing the Group’s TSR
to that of the FTSE 250 (excluding Investment Trusts), an index of which the Group is a constituent. The committee is satisfied
that the CEO’s remuneration is supported by the TSR performance data presented below.
TOTAL SHAREHOLDER RETURN
Rebased at 100 on May 18, 2020
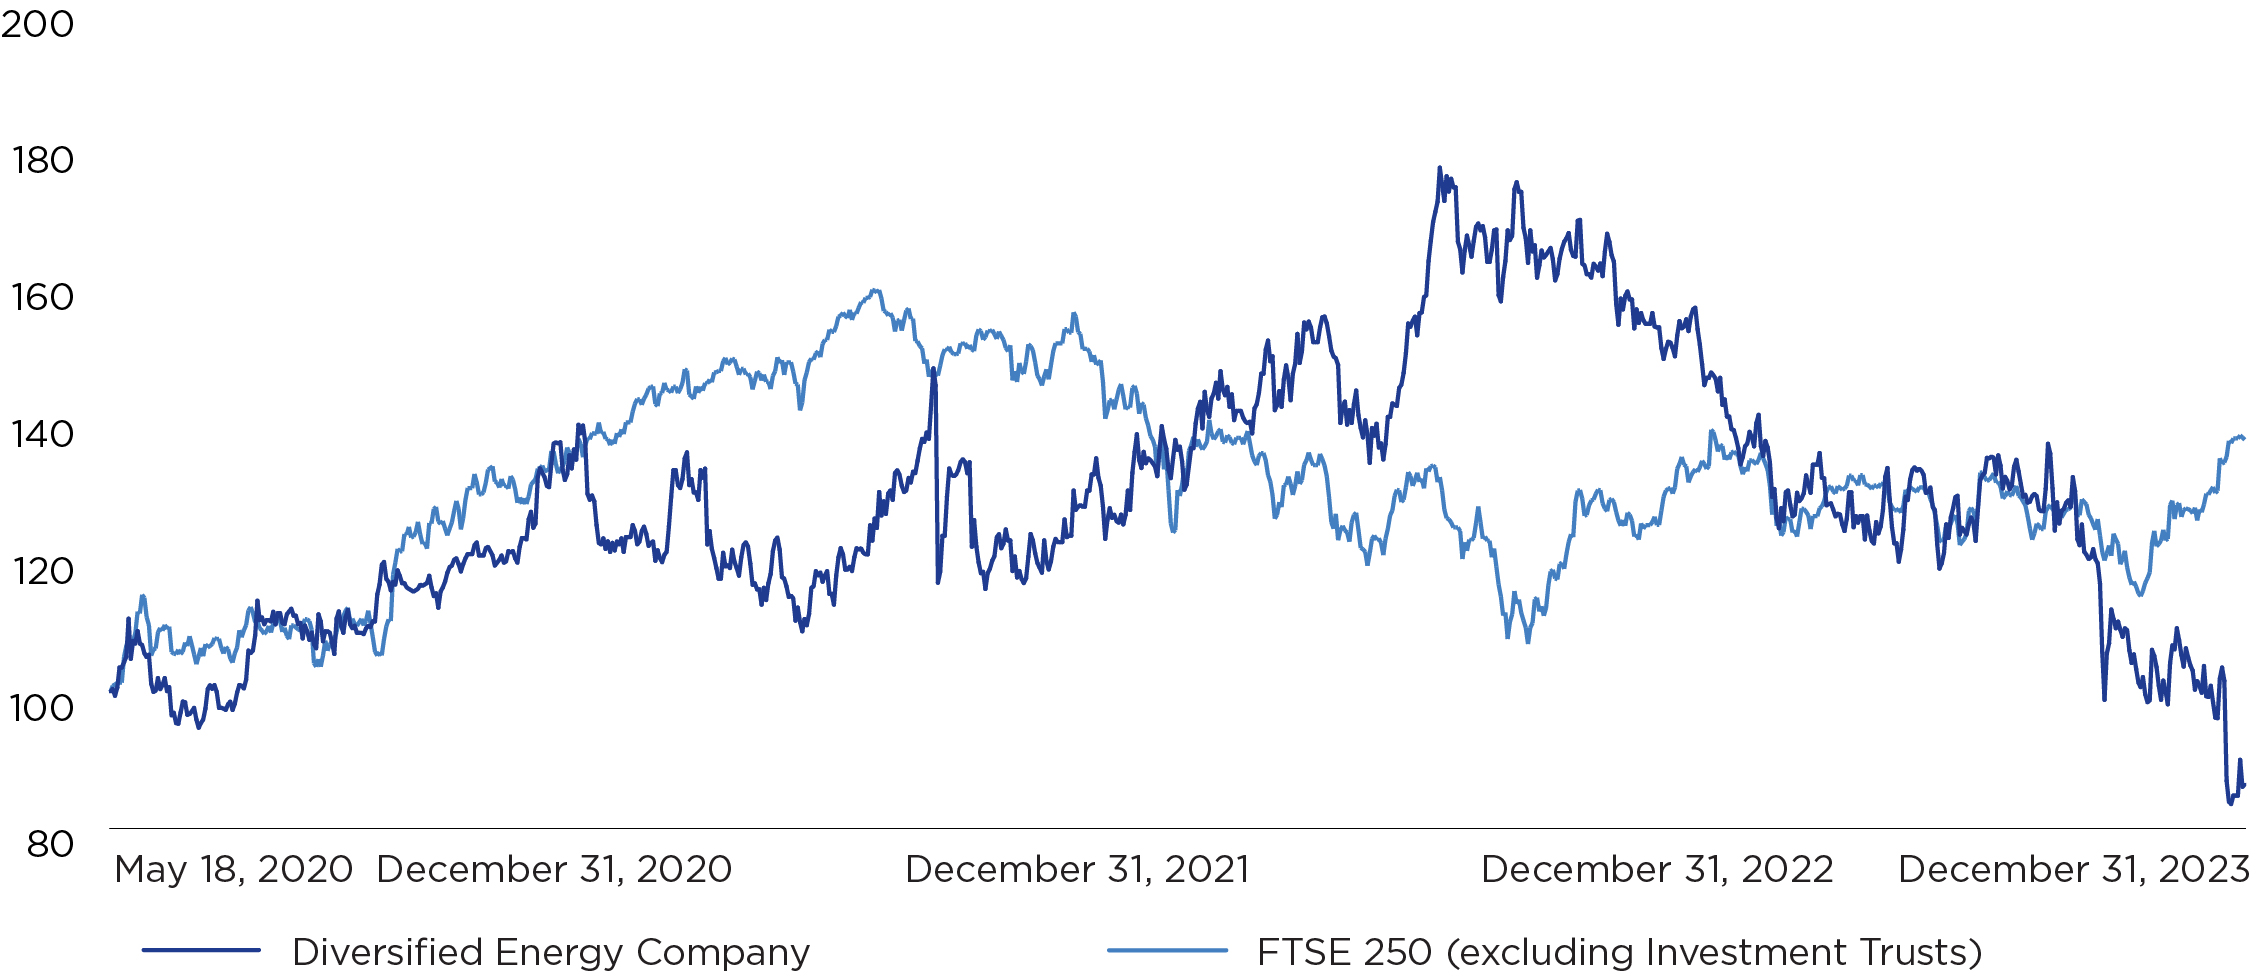
Source: Datastream (a Refintiv product)
The table below details certain elements of the CEO’s remuneration over the same period as presented in the TSR Index graph:
(In Thousands) |
||||
Year |
CEO |
Single Figure of Total
Remuneration
|
Annual Bonus Pay-Out
Against Maximum %
|
Long-Term Incentive
Vesting Rates Against
Maximum Opportunity %
|
2023 |
Rusty Hutson, Jr. |
$2,060 |
63% |
40% |
2022 |
Rusty Hutson, Jr. |
$5,871 |
85% |
71% |
2021 |
Rusty Hutson, Jr. |
$2,195 |
85% |
45% |
2020 |
Rusty Hutson, Jr. |
$2,307 |
94% |
100% |
ANNUAL CHANGE IN REMUNERATION OF EACH DIRECTOR COMPARED TO EMPLOYEES
The table below presents the year-on-year (2021-2023) percentage change in remuneration for each Director and all
employees of the Group and its subsidiaries.
% Change from 2022 to
2023
|
% Change from 2021 to
2022
|
% Change from 2020 to
2021
|
% Change from 2019 to
2020
|
||||||||||||
Name |
Salary/
Fee
|
Annual
Bonus
|
Taxable
Benefits
|
Salary/
Fee
|
Annual
Bonus
|
Taxable
Benefits
|
Salary/
Fee
|
Annual
Bonus
|
Taxable
Benefits
|
Salary/
Fee
|
Annual
Bonus
|
Taxable
Benefits
|
|||
Rusty Hutson, Jr. |
4% |
(23%) |
—% |
4% |
21% |
20% |
3% |
(7%) |
400% |
59% |
55% |
—% |
|||
Bradley G. Gray(a)
|
4% |
(45%) |
(8%) |
3% |
3% |
—% |
3% |
(7%) |
(14%) |
19% |
15% |
56% |
|||
David E. Johnson |
8% |
—% |
—% |
19% |
—% |
—% |
3% |
—% |
—% |
66% |
—% |
—% |
|||
Martin K. Thomas |
7% |
—% |
—% |
14% |
—% |
—% |
2% |
—% |
—% |
27% |
—% |
—% |
|||
David J. Turner, Jr.(b)
|
8% |
—% |
—% |
16% |
—% |
—% |
3% |
—% |
—% |
132% |
—% |
—% |
|||
Sandra M. Stash(c)
|
8% |
—% |
—% |
14% |
—% |
—% |
2% |
—% |
—% |
520% |
—% |
—% |
|||
Kathryn Z. Klaber(d)
|
100% |
—% |
—% |
—% |
—% |
—% |
2% |
—% |
—% |
—% |
—% |
—% |
|||
Sylvia Kerrigan(e)
|
33% |
—% |
—% |
445% |
—% |
—% |
100% |
—% |
—% |
—% |
—% |
—% |
|||
All employees,
excluding Directors
|
4% |
4% |
—% |
5% |
5% |
—% |
11% |
(2%) |
—% |
4% |
4% |
—% |
|||
(a)Mr. Gray was a Director until September 15, 2023. Mr. Gray’s fixed pay compensation for the year ended December 31, 2023 is for the period
he was a Director.
(b)David J. Turner, Jr. was appointed to the Board on May 27, 2019.
(c)Sandra M. Stash was appointed to the Board on October 21, 2019.
(d)Kathryn Z. Klaber was appointed to the Board on January 1, 2023.
(e)Sylvia Kerrigan was appointed to the Board on October 11, 2021.
CEO TO EMPLOYEE PAY RATIO
Although the Group does not have 250 full time equivalent UK employees, the Group provides a CEO to employee pay ratio on
a voluntary basis below. The average CEO to employee pay ratio improved this year. The committee is satisfied that the CEO
to employee pay ratio is consistent with the Group’s overall aim to ensure its employees are rewarded fairly and competitively
for their contributions.
Year |
Method |
25th Percentile Pay Ratio |
Average Pay Ratio |
75th Percentile Pay Ratio |
2023 |
Option A |
25:1 |
17:1 |
16:1 |
2022 |
Option A |
28:1 |
19:1 |
17:1 |
2021 |
Option A |
44:1 |
30:1 |
28:1 |
Notes to the CEO to employee pay ratio:
1.We have used Option A with figures as of December 31, 2023, following guidance that this is the preferred approach of
some proxy advisors and institutional shareholders. Option A captures all relevant pay and benefits for all employees.
2.The ratios shown are representative of the 25th percentile, median and 75th percentile pay for all employees within the
Group during the 2023 calendar year.
3.The CEO pay ratio is based on the taxable income for all employees employed for the duration of calendar year 2023 as
reported on U.S. IRS Form W-2, Wage and Tax Statement.
RELATIVE IMPORTANCE OF SPEND ON PAY
The table below details the change in total employee pay between 2022 and 2023, compared with distributions to
shareholders by way of dividend or share buybacks.
(In thousands) |
2023 |
2022 |
% Change |
Total gross employee pay |
$124,834 |
$113,267 |
10% |
Dividends/share buybacks |
179,089 |
178,146 |
1% |
The number of employees as of December 31, 2023 was 1,603, as compared to 1,582 employees as of December 31, 2022.
Statement of Voting at General Meeting
The following table shows the results of the binding Remuneration Policy vote at the April 26, 2022 AGM and the advisory
Directors’ Remuneration Report vote at the May 2, 2023 AGM.
(Binding Vote) |
(Advisory Vote) |
||||
Approval of the Directors’
Remuneration Policy
|
Director Remuneration Report |
||||
Total number of
votes
|
% of votes cast |
Total number of
votes
|
% of votes cast |
||
For |
27,783,031 |
83% |
21,839,879 |
62% |
|
Against |
5,793,079 |
17% |
13,566,740 |
38% |
|
Votes withheld |
1,164,541 |
910,347 |
|||
Shareholder Engagement
At the 2023 AGM, the committee was disappointed that the
Directors’ remuneration report was passed with 62%
support from shareholders. Following the AGM, the Group
consulted and engaged with a number of shareholders
including those who voted against the resolutions to better
understand their concerns. The Board is thankful to the
shareholders for sharing their views and understand that
the negative vote was principally related to the specific,
one-off issue of the grant price used for the 2020 LTIP
awards and the resulting remuneration outcomes.
The longstanding approach to the calculation of the share
price used to set the number of shares subject to an LTIP
award is included in the shareholder approved Directors’
Remuneration Policy as the average share price for the five
days following the announcement of the Group’s results for
the previous financial year. This was the approach followed
for the 2020 LTIP awards and all other recent awards.
The committee did not consider it appropriate to apply a
reduction to the vesting outcome as this was assessed to
be commensurate with the performance over the period,
which included the ROE and relative TSR targets being met
in full. The committee was mindful that any downward
adjustment could have risked damaging the integrity of the
LTIP and was also conscious that no reciprocal upward
adjustment would be made in a year when the share price
peaked at the time of grant, resulting in a reduced number
of shares being awarded. The vested awards are also
subject to a two-year holding period, so the value
subsequently realised by the executive directors will be
subject to market movements over this period.
The dialogue with the shareholders highlighted that there
remains strong support for the Group's remuneration policy
which was approved by shareholders at the 2022 AGM. The
Group's Remuneration Committee has discussed the
feedback received in detail with the Board and will maintain
dialogue with shareholders on matters related to executive
remuneration. The committee will review with shareholders
the evolving needs of the business in advance of the
cyclical renewal of our Directors’ Remuneration Policy
in 2025.
IMPLEMENTATION OF POLICY FOR 2024
Base Salary
The Executive Director’s base salary for 2024 will be
as follows:
—Rusty Hutson, Jr: $779,834
For 2024, the committee approved an increase to the
CEO’s salary by 4%. This compares to increases across the
Group ranging from 0% to 10% based on performance, with
an average of 4%. It is anticipated that increases for the
remainder of the life of the policy will be in-line with the
range of the workforce.
Pension
The Executive Director does not receive a
pension provision.
Benefits
The Executive Director receives life insurance and
automobile benefits, and matching contributions under the
Group’s 401(k) plan. There is no current intention to
introduce additional benefits in 2024.
Annual Bonus
The overall 2024 bonus plan maximum will be 175% of base
salary for Rusty Hutson, Jr.
The bonus will be based on a range of targets relating to
adjusted EBITDA per share (50%), cash cost per Mcfe
(20%), and ESG/EHS (30%).
Due to issues of commercial sensitivity, we do not believe it
is in shareholders’ interests to disclose any further details of
these targets on a prospective basis. However, the
committee is committed to adhering to principles of
transparency in terms of retrospective annual bonus target
disclosure and will, therefore, provide appropriate and
relevant levels of disclosure for the bonus targets applied to
the 2024 bonus (and performance against these targets) in
next year’s Director’s Remuneration Report.
Bonuses are payable in cash for outcomes up to 100% of
base salary, with any outcomes above this level made as
awards of deferred shares or cash which vests after
one year.
Long-Term Incentives
Performance Share Awards will be made in 2024 to Rusty Hutson, Jr. with shares worth 325% of salary. The share price used
to calculate the number of shares subject to the award will be based on the average share price over the five-day period
commencing on the date that the Group issues its final 2023 results. These awards will vest three years after grant, and will
also be subject to a further two-year holding period after the initial three-year period to vesting.
The performance conditions for the Performance Share Award will be a mix of Return on Equity (40%), Absolute TSR (30%),
Relative TSR (10%) and Emissions (20%) targets measured over three years as described below. These are measures which
encourage the generation of sustainable long-term returns to shareholders. When determining the level of vesting the
committee will also consider that the outcome of the measurement reflects the underlying performance or financial health of
the Group.
RETURN ON EQUITY (40% OF TOTAL AWARD)
|
ABSOLUTE TSR (30% OF TOTAL AWARD)
|
|||
Three-Year Average ROE |
% of that Part of the Award
that Vests
|
Three-Year Absolute TSR |
% of that Part of the Award
that Vests
|
|
Below 15% per annum |
—% |
Below 10% per annum |
—% |
|
15% per annum |
15% |
10% per annum |
15% |
|
25% per annum or above |
100% |
20% per annum or above |
100% |
|
15% to 25% per annum |
Pro rata straight-line between
15% and 100%
|
10% to 20% per annum |
Pro rata straight-line between
15% and 100%
|
|
RELATIVE TSR (10% OF TOTAL AWARD)
|
EMISSIONS (20% OF TOTAL AWARD)
|
|||
Three-Year TSR v FTSE
250
|
% of that Part of the Award
that Vests
|
Emissions over Three Years |
% of that Part of the Award
that Vests
|
|
Below median |
—% |
Below 5% Methane Intensity
Reduction
|
—% |
|
Median |
15% |
5% Methane Intensity
Reduction
|
15% |
|
Upper quartile or above |
100% |
15% Methane Intensity
Reduction
|
100% |
|
Median to upper quartile |
Pro rata straight-line between
15% and 100%
|
5% to 15% Methane Intensity
Reduction
|
Pro rata straight-line between
15% and 100%
|
|
NON-EXECUTIVE DIRECTORS’ FEES
David E. Johnson will receive an annual fee of £174,000 (or $215,760) as Chairman. Each Non-Executive Director receives a
base annual fee of £105,000 (or $133,350), with additional fees as noted below (table in thousands, except rates).
GBP |
Exchange Rate |
USD |
|
David J. Turner, Jr.(a)
|
£135 |
1.24 |
$167 |
Sandra M. Stash(b)
|
125 |
1.24 |
155 |
Sylvia Kerrigan(c)
|
135 |
1.24 |
167 |
David E. Johnson |
174 |
1.24 |
216 |
Martin K. Thomas(d)
|
125 |
1.24 |
155 |
Kathryn Z. Klaber(e)
|
125 |
1.24 |
155 |
Total |
£819 |
$1,015 |
(a)Includes Audit & Risk Committee Chair fee of £30,000 (or $37,200).
(b)Includes Sustainability & Safety Committee Chair fee of £20,000 (or $24,800).
(c)Includes Senior Independent Director fee of £10,000 (or $12,400) and Remuneration Committee Chair fee of £20,000 (or $24,800).
(d)Includes Vice Chair fee of £20,000 (or $24,800).
(e)Includes Nomination & Governance Committee Chair fee of £20,000 (or $24,800).

Sylvia Kerrigan
Chair of the Remuneration Committee
March 19, 2024
“ |
|||
The Remuneration Committee is focused on ensuring that remuneration is
designed to emphasize "pay for performance”
|
|||
The Sustainability & Safety
Committee’s Report
|
||||||
|
 |
|
 |
|||
Sandra M. Stash
(64)
Independent Non-Executive
Director (Chair)
Strength:
Industry
Independence from:
Management & Other
interests
|
David E. Johnson
(63)
Non-Executive Chairman,
Independent upon
Appointment
Strength:
Finance
Independence from:
Management & Other
interests
|
Kathryn Z. Klaber
(58)
Independent Non-
Executive Director (as of
1/1/23)
Strength:
Regulatory,
Sustainability
Independence from:
Management
& Other Interests
|
Bradley G. Gray
(55)
President
& Chief Financial Officer
(Executive Director and
committee member until
9/15/23)
Strength:
Industry, Finance
Independence from:
Other Interests
|
|||
Key Objective
The Sustainability & Safety Committee acts on behalf of the
Board and the shareholders to oversee the practices and
performance of the Group with respect to health and
safety, business ethics, conduct and responsibility, social
affairs, the environment (including climate) and broader
sustainability issues. As part of the Group’s overall
sustainability actions, the committee oversees the Group’s
climate scenario analysis planning and performance against
goals and ensures adherence to the recommended TCFD
disclosures for use by investors, lenders, insurers and
other stakeholders.
Overview
The committee assesses the Group’s overall sustainability
performance and provides input into the Annual Report &
Form 20-F, the Sustainability Report and other disclosures
on sustainability. It also advises the Remuneration
Committee on metrics relating to sustainable development,
GHG and other emissions, regulatory compliance, diversity
and inclusion, community engagement and other
social goals, as well as health and safety that apply to
executive remuneration.
The committee reviews the Group’s Sustainability and
Safety plans and reviews execution of the plan and audit
outcomes. In addition, the committee reviews and considers
external stakeholder perspectives in relation to the Group’s
business, and reviews how the Group addresses issues of
stakeholder concern that could affect its reputation and
license to operate.
The overall accountability for sustainability and safety is
with the President and Chief Financial Officer and the
Senior Leadership Team, including the Executive Vice
President of Operations, Chief Human Resources Officer,
the Senior Vice President of EHS and the Senior Vice
President of Sustainability, who are assisted by the
EHS team.
Key Matters Discussed by
the Committee
MAIN ACCOMPLISHMENTS OVER THE
COURSE OF 2023
—Established and reviewed the Group’s sustainability and
safety strategies and assessed the Group’s performance;
—Engaged with the leadership of the Group and monitored
progress against the Group’s methane emission intensity
reduction targets and accelerated commitment to
achieve net zero absolute Scope 1 and 2 GHG emissions
by 2040;
—Continued the review program to align executive
management remuneration with key safety and
sustainability performance indicators and metrics,
including factoring GHG reductions into long-term
incentives, that has been communicated to the
Remuneration Committee;
—Engaged with the leadership of the Group to understand
the diversity profile of the Group’s workforce;
—Engaged with a consortium of advisers, comprising
leading global environmental consultancies and other
strategic advisers, and continued to implement the
recommendations set forth by the TCFD with the
exception of reporting on Scope 3; and
—Reviewed the Group’s sustainability related
communications, including the composition and
approval of the Group’s 2022 Sustainability Report
and preparation for issuance of the 2023
Sustainability Report.
Committee Activities by
Focus Area
During 2023, the committee met regularly to review and
discuss a range of prioritized topics. These topics included
(i) the safe and responsible operation of the Group’s
upstream and midstream assets; (ii) environmental
protection and conservation activities; (iii) the Group’s
approach to diversity and inclusion; (iv) the Group’s
approach to managing climate risk, (v) the Group’s
emissions reduction capital programs; and (vi) the Group’s
plugging business. The committee also focused on
the following:
PROCESS SAFETY
—The Executive Vice President of Operations presented an
overview of the Group’s process safety approach and
identification of high-risk facility performance, as well as
comparable performance benchmarking against
industry peers.
CORPORATE SCORECARD
METRICS OVERSIGHT
—The committee reviewed the quantitative and qualitative
drivers impacting the Group’s personnel safety,
emissions management, environmental performance,
and asset retirement metrics that support
performance analysis.
—The committee reviewed and discussed the Group’s
increased incident rate for the year, which were
attributable in part to short service employees with less
than one year of service under Diversified’s safety
culture. The Group is seeking to address this increase
through a new Safety Strategy Committee which was
created to identify and advance specific areas for
improvement and accountability.
SUSTAINABILITY RATING AGENCY
SCORECARD
—The committee reviewed the Group’s various third-party
sustainability rating scores, including analysis of the
process and review of scorecards to determine targeted
areas of improvement.
CLIMATE RISK
—The committee engaged the support of industry and
internationally recognized consultants and advisers to
help the Group update its climate scenario analysis and
advance its work on climate governance, strategy, risk
management and metrics as set forth under the TCFD.
The committee oversaw the Group’s engagement with
the GHG emissions inventory and associated scenario
analyses and remains actively engaged in setting targets
in accordance with the recommendations. The
committee has considered the relevance of material
climate-related matters, including the physical and
transition risks of climate change, when preparing this
Annual Report & Form 20-F. Further information can be
within this Annual Report & Form 20-F.
ACQUISITION DUE DILIGENCE
—Adding emphasis to its oversight of the Group’s
investment activities, the committee stayed apprised of
the progress and assessment of the Group’s emissions
screening efforts to aid in its assessment that proposed
acquisitions and other capital investments have on its
consolidated GHG emissions profile and associated
publicly stated targets.
EMISSION REDUCTION INITIATIVES
—The committee engaged in strategic discussions with
senior management regarding its capital program for
emissions reductions, including regular updates on the
deployment and success of handheld detection
equipment and aerial LiDAR surveys, as well as the
replacement of pneumatic valves. The Group also
advanced its Marginal Abatement Cost Curve (MACC)
analysis that will help to inform reduction emissions
planning in future years.
OIL & GAS METHANE PARTNERSHIP
RECOGNITION
—The committee supported the Group’s efforts in
achieving the OGMP 2.0 Gold Standard Pathway
designation in recognition of the Group’s demonstrated
commitment to set aggressive and achievable multi-year
plans designed to accurately measure and transparently
report its efforts to reduce methane emissions.
AREAS OF FOCUS FOR 2024 AND BEYOND
—Support the Group in meeting increasing sustainability
oversight, reporting and disclosure expectations of the
Group’s stakeholders, including short, medium and
long-term quantitative metrics and qualitative objectives
tied to executive compensation for reducing GHG
emissions (including formalizing a roadmap to be net
zero absolute Scope 1 and 2 GHG emissions by 2040);
—Support the Group in its diversity and
inclusion aspirations;
—Support management with effective oversight and
advice as the Group executes and reports on the
recommendations of the TCFD work and MACC analysis,
serving to further integrate climate considerations into
business planning and strategies; and
—Provide advice and guidance on potential further EHS
enhancements and reporting metrics, including an
increased focus on safety, well abandonment, water
management and biodiversity; and
COMMITTEE EFFECTIVENESS
—The committee performed a critical analysis internal
review and evaluation on itself, as part of its annual
self-review process. No significant areas of concern
were raised.
Membership
The formation of a Sustainability & Safety Committee is not
a recommendation under the current UK Corporate
Governance Code. The Group and the Board, however,
consider such a committee to be an imperative given the
operational footprint of the business and the evolving
operational, regulatory, social and investment markets
within which the Group operates.
The committee is currently comprised of the Non-Executive
Chairman and two Independent Non-Executive Directors:
Sandra M. Stash, the Sustainability & Safety Committee
Chair, David E. Johnson and Kathryn Z. Klaber. Ms. Klaber
was appointed to the committee as an Independent Non-
Executive Director as of January 1, 2023. Additionally,
Bradley G. Gray stepped down from the committee on
September 15, 2023 concurrent with his departure from the
Board and appointment as the Group’s President and Chief
Financial Officer. Benjamin Sullivan, Senior Executive
Vice President, Chief Legal & Risk Officer and Corporate
Secretary acts as Secretary to the committee.
The committee has extensive and relevant experience in
EHS and social matters through their other business
activities. For one example, Ms. Stash formerly served as
Executive Vice President — Safety, Operations, Engineering,
and External Affairs for Tullow Oil until her retirement.
Meetings and Attendance
The Sustainability & Safety Committee met five times
during 2023 and one time thus far in 2024. The committee
also regularly meets in private executive session at the end
of its committee meetings, without management present, to
ensure that points of common concern are identified and
that priorities for future attention by the committee are
agreed upon. The Chair of the committee keeps in close
contact with the Chief Legal & Risk Officer, the Senior Vice
President of Sustainability, the Senior Vice President of EHS
and the EHS team and external consultants between
meetings of the committee. For committee meeting
within this Annual Report & Form 20-F.
The list below details the members of the Senior Leadership
Team who were invited to attend meetings as appropriate
during the calendar year.
—Bradley G. Gray (President and Chief Financial Officer)
—Benjamin Sullivan (Senior Executive Vice President, Chief
Legal & Risk Officer, and Corporate Secretary)
—Maverick Bentley (Executive Vice President of
Operations)
—Paul Espenan (Senior Vice President of Environmental,
Health and Safety)
—Teresa Odom (Senior Vice President of Sustainability)
—Mark Kirkendall (Executive Vice President, Chief Human
Resources Officer)
Responsibilities and Terms
of Reference
The committee’s main duties are:
—Overseeing the development and implementation by
management of policies, compliance systems,
and monitoring processes to ensure compliance by the
Group with applicable legislation, rules and regulations;
—Establishing with management long-term climate,
environmental and social sustainability and, EHS goals
and evaluating the Group’s progress against those goals;
—Advising management on implementing, maintaining and
improving environmental and social sustainability and
EHS strategies, implementation of which creates value
consistent with long-term preservation and enhancement
of shareholder value;
—Considering and advising management of emerging
environmental and social sustainability issues that may
affect the business, performance or reputation of the
Group and makes recommendations, as appropriate, on
how management can address such issues;
—Monitoring the Group’s risk management processes
related to environmental and social sustainability and
EHS with particular attention to managing and reducing
environmental risks and impacts; and
—Reviewing handling of incident reports, results of
investigations into material events, findings from
environmental and social sustainability and EHS audits
and the action plans proposed pursuant to
those findings.
The committee has formal terms of reference which can be
viewed on the Group’s website at www.div.energy.

Sandra M. Stash
Chair of the Sustainability & Safety Committee
March 19, 2024
“ |
|||
The committee has extensive
and relevant experience in EHS
matters through their other
business activities.
|
|||

Report of Independent Registered Public Accounting Firm
To the Board of Directors and Shareholders of Diversified Energy Company Plc
Opinion on the Financial Statements
We have audited the accompanying consolidated statement of financial position of Diversified Energy Company
Plc and its subsidiaries (the "Company") as of December 31, 2023 and 2022, and the related consolidated
statements of comprehensive income, of changes in equity, and of cash flows for each of the three years in the
period ended December 31, 2023, including the related notes (collectively referred to as the "consolidated financial
statements"). In our opinion, the consolidated financial statements present fairly, in all material respects, the
financial position of the Company as of December 31, 2023 and 2022, and the results of its operations and its cash
flows for each of the three years in the period ended December 31, 2023 in conformity with International Financial
Reporting Standards as issued by the International Accounting Standards Board.
Basis for Opinion
These consolidated financial statements are the responsibility of the Company's management. Our responsibility is
to express an opinion on the Company's consolidated financial statements based on our audits. We are a public
accounting firm registered with the Public Company Accounting Oversight Board (United States) (PCAOB) and are
required to be independent with respect to the Company in accordance with the U.S. federal securities laws and
the applicable rules and regulations of the Securities and Exchange Commission and the PCAOB.
We conducted our audits of these consolidated financial statements in accordance with the standards of the
PCAOB. Those standards require that we plan and perform the audit to obtain reasonable assurance about
whether the consolidated financial statements are free of material misstatement, whether due to error or fraud.
Our audits included performing procedures to assess the risks of material misstatement of the consolidated
financial statements, whether due to error or fraud, and performing procedures that respond to those risks. Such
procedures included examining, on a test basis, evidence regarding the amounts and disclosures in the
consolidated financial statements. Our audits also included evaluating the accounting principles used and
significant estimates made by management, as well as evaluating the overall presentation of the consolidated
financial statements. We believe that our audits provide a reasonable basis for our opinion.
Critical Audit Matters
The critical audit matter communicated below is a matter arising from the current period audit of the consolidated
financial statements that was communicated or required to be communicated to the audit committee and that (i)
relates to accounts or disclosures that are material to the consolidated financial statements and (ii) involved our
especially challenging, subjective, or complex judgments. The communication of critical audit matters does not
alter in any way our opinion on the consolidated financial statements, taken as a whole, and we are not, by
communicating the critical audit matter below, providing a separate opinion on the critical audit matter or on the
accounts or disclosures to which it relates.
The Impact of Proved Natural Gas, Oil, and Natural Gas Liquids (NGL) Reserves on Natural Gas and Oil
Properties, Net
As described in Notes 3, 4 and 10 to the consolidated financial statements, the Company's natural gas and oil
properties, net balance was $2.50 billion as of December 31, 2023, and the related depletion expense for the year
ended December 31, 2023 was $168 million. Natural gas and oil activities are accounted for using the principles of
the successful efforts method of accounting. Costs incurred to purchase, lease, or otherwise acquire a property are
capitalized when incurred. Proved natural gas, oil and NGL reserve volumes are used as the basis to calculate unit-
of-production depletion rates. For the year ended December 31, 2023, pre-tax impairment charges of $42 million
were recognized. In estimating proved natural gas, oil and NGL reserves, management relies on interpretations
and judgment of available geological, geophysical, engineering and production data, as well as the use of certain
economic assumptions such as commodity pricing. Additional assumptions include operating expenses, capital
expenditures, and taxes. As disclosed by management, the Company's internal staff of petroleum engineers and
geoscience professionals work closely with the independent reserve engineers (together referred to as
"management's specialists").
The principal considerations for our determination that performing procedures relating to the impact of proved
natural gas, oil and NGL reserves on proved natural gas and oil properties, net is a critical audit matter are (i.) the
significant judgment by management, including the use of management's specialists, when developing the
estimates of proved natural gas, oil and NGL reserve volumes, as the reserve volumes are based on engineering
assumptions and methods and (ii) a high degree of auditor judgment, subjectivity, and effort in performing
procedures and evaluating audit evidence obtained related to the data, methods, and assumptions used by
management and its specialists in developing the estimates of proved natural gas, oil and NGL reserve volumes
and the assumptions applied to commodity pricing and operating expenses applied to the impairment assessment.
Addressing the matter involved performing procedures and evaluating audit evidence in connection with forming
our overall opinion on the consolidated financial statements. The work of management's specialists was used in
performing the procedures to evaluate the reasonableness of the proved natural gas, oil and NGL reserve volumes
and the impairment assessment. As a basis for using this work, the specialists' qualifications were understood and
the Company's relationship with the specialists was assessed. The procedures performed also included evaluating
the methods and assumptions used by the specialists, testing the completeness and accuracy of the data used by
the specialists, and evaluating the specialists' findings. These procedures also included, among others, testing the
completeness and accuracy of the underlying data related to commodity pricing and operating expenses applied to
the impairment assessment. Additionally, these procedures included evaluating whether the assumptions applied
to the data related to commodity pricing and operating expenses that were used in developing the estimate of
proved natural gas, oil and NGL reserve volumes were reasonable considering the past performance of the
Company.
/s/ PricewaterhouseCoopers LLP
March 19, 2024
We have served as the Company’s auditor since 2020.
Consolidated Statement of
Comprehensive Income
(AMOUNTS IN THOUSANDS, EXCEPT PER SHARE AND PER UNIT DATA)
Year Ended |
||||
Notes |
December 31, 2023 |
December 31, 2022 |
December 31, 2021 |
|
Revenue |
6 |
$ |
$ |
$ |
Operating expenses |
7 |
( |
( |
( |
Depreciation, depletion and amortization |
7 |
( |
( |
( |
Gross profit |
$ |
$ |
$ |
|
General and administrative expenses |
7 |
( |
( |
( |
Allowance for expected credit losses |
( |
|||
Gain (loss) on natural gas and oil properties and
equipment
|
10,11
|
( |
||
Gain (loss) on sale of equity interest |
5 |
|||
Unrealized gain (loss) on investment |
5 |
|||
Gain (loss) on derivative financial instruments |
13 |
( |
( |
|
Gain on bargain purchases |
5 |
|||
Impairment of proved properties |
10 |
( |
||
Operating profit (loss) |
$ |
$( |
$( |
|
Finance costs |
21 |
( |
( |
( |
Accretion of asset retirement obligation |
19 |
( |
( |
( |
Other income (expense) |
( |
|||
Income (loss) before taxation |
$ |
$( |
$( |
|
Income tax benefit (expenses) |
8 |
( |
||
Net income (loss) |
$ |
$( |
$( |
|
Other comprehensive income (loss) |
( |
|||
Total comprehensive income (loss) |
$ |
$( |
$( |
|
Net income (loss) attributable to: |
||||
Diversified Energy Company PLC |
$ |
$( |
$( |
|
Non-controlling interest |
||||
Net income (loss) |
$ |
$( |
$( |
|
Earnings (loss) per share attributable to Diversified
Energy Company PLC
|
||||
Weighted average shares outstanding - basic |
9 |
|||
Weighted average shares outstanding - diluted |
9 |
|||
Earnings (loss) per share - basic |
9 |
$ |
$( |
$( |
Earnings (loss) per share - diluted |
9 |
$ |
$( |
$( |
Consolidated Statement of
Financial Position
(AMOUNTS IN THOUSANDS, EXCEPT PER SHARE AND PER UNIT DATA)
Notes |
December 31, 2023 |
December 31, 2022 |
|
ASSETS |
|||
Non-current assets: |
|||
Natural gas and oil properties, net |
10 |
$ |
$ |
Property, plant and equipment, net |
11 |
||
Intangible assets |
12 |
||
Restricted cash |
3 |
||
Derivative financial instruments |
13 |
||
Deferred tax assets |
8 |
||
Other non-current assets |
15 |
||
Total non-current assets |
$ |
$ |
|
Current assets: |
|||
Trade receivables, net |
14 |
||
Cash and cash equivalents |
3 |
||
Restricted cash |
3 |
||
Derivative financial instruments |
13 |
||
Other current assets |
15 |
||
Total current assets |
$ |
$ |
|
Total assets |
$ |
$ |
|
EQUITY AND LIABILITIES |
|||
Shareholders' equity: |
|||
Share capital |
16 |
$ |
$ |
Share premium |
16 |
||
Treasury reserve |
( |
( |
|
Share based payment and other reserves |
|||
Retained earnings (accumulated deficit) |
( |
( |
|
Equity attributable to owners of the parent: |
( |
||
Non-controlling interests |
5 |
||
Total equity |
$ |
$( |
|
Non-current liabilities: |
|||
Asset retirement obligations |
19 |
$ |
$ |
Leases |
20 |
||
Borrowings |
21 |
||
Deferred tax liability |
8 |
||
Derivative financial instruments |
13 |
||
Other non-current liabilities |
23 |
||
Total non-current liabilities |
$ |
$ |
|
Current liabilities: |
|||
Trade and other payables |
22 |
$ |
$ |
Taxes payable |
|||
Leases |
20 |
||
Borrowings |
21 |
||
Derivative financial instruments |
13 |
||
Other current liabilities |
23 |
||
Total current liabilities |
$ |
$ |
|
Total liabilities |
$ |
$ |
|
Total equity and liabilities |
$ |
$ |

Consolidated Statement of
Changes in Equity
(AMOUNTS IN THOUSANDS, EXCEPT PER SHARE AND PER UNIT DATA)
Notes |
Share
Capital
|
Share
Premium
|
Treasury
Reserve
|
Share
Based
Payment
and Other
Reserves
|
Retained
Earnings
(Accumulated
Deficit)
|
Equity
Attributable
to Owners of
the Parent
|
Non-
Controlling
Interest
|
Total Equity |
|
Balance as of January 1, 2021 |
$ |
$ |
$( |
$ |
$ |
$ |
$ |
$ |
|
Net income (loss) |
— |
— |
— |
— |
( |
( |
( |
||
Other comprehensive income
(loss)
|
— |
— |
— |
— |
— |
||||
Total comprehensive income
(loss)
|
$— |
$— |
$— |
$— |
$( |
$( |
$ |
$( |
|
Non-controlling interest in
acquired assets
|
5 |
— |
— |
— |
— |
— |
— |
||
Issuance of share capital
(equity placement)
|
16 |
— |
— |
— |
— |
||||
Issuance of share capital
(equity compensation)
|
— |
— |
( |
— |
|||||
Dividends |
18 |
— |
— |
— |
— |
( |
( |
— |
( |
Cancellation of warrants |
16 |
— |
— |
— |
( |
— |
( |
— |
( |
Transactions with shareholders |
$ |
$ |
$— |
$ |
$( |
$ |
$ |
$ |
|
Balance as of December 31,
2021
|
$ |
$ |
$( |
$ |
$( |
$ |
$ |
$ |
|
Net income (loss) |
— |
— |
— |
— |
( |
( |
( |
||
Other comprehensive income
(loss)
|
— |
— |
— |
— |
— |
||||
Total comprehensive income
(loss)
|
$— |
$— |
$— |
$— |
$( |
$( |
$ |
$( |
|
Issuance of share capital
(settlement of warrants)
|
16 |
— |
— |
— |
— |
||||
Issuance of share capital
(equity compensation)
|
— |
— |
( |
— |
|||||
Issuance of EBT shares
(equity compensation)
|
16 |
— |
— |
( |
— |
— |
— |
||
Repurchase of shares (EBT) |
16 |
— |
— |
( |
— |
— |
( |
— |
( |
Repurchase of shares (share
buyback program)
|
16 |
( |
— |
( |
— |
( |
— |
( |
|
Dividends |
18 |
— |
— |
— |
— |
( |
( |
— |
( |
Distributions to non-
controlling interest owners
|
— |
— |
— |
— |
— |
— |
( |
( |
|
Cancellation of warrants |
16 |
— |
— |
— |
( |
— |
( |
— |
( |
Transactions with shareholders |
$( |
$— |
$( |
$ |
$( |
$( |
$( |
$( |
|
Balance as of December 31,
2022
|
$ |
$ |
$( |
$ |
$( |
$( |
$ |
$( |
|
Net Income (loss) |
— |
— |
— |
— |
|||||
Other comprehensive income
(loss)
|
— |
— |
— |
— |
( |
( |
— |
( |
|
Total comprehensive income
(loss)
|
$— |
$— |
$— |
$— |
$ |
$ |
$ |
$ |
|
Issuance of share capital
(equity placement)
|
16 |
— |
— |
— |
— |
||||
Issuance of share capital
(equity compensation)
|
— |
— |
— |
( |
— |
||||
Issuance of EBT shares
(equity compensation)
|
16 |
— |
— |
( |
— |
— |
— |
||
Repurchase of shares (share
buyback program)
|
16 |
( |
— |
( |
— |
( |
— |
( |
|
Dividends |
18 |
— |
— |
— |
— |
( |
( |
— |
( |
Distributions to non-
controlling interest owners
|
— |
— |
— |
— |
— |
— |
( |
( |
|
Transactions with shareholders |
$ |
$ |
$( |
$( |
$( |
$( |
$( |
$( |
|
Balance as of December 31,
2023
|
$ |
$ |
$( |
$ |
$( |
$ |
$ |
$ |
Consolidated Statement of Cash Flows
(AMOUNTS IN THOUSANDS, EXCEPT PER SHARE AND PER UNIT DATA)
Year Ended |
||||
Notes |
December 31, 2023 |
December 31, 2022 |
December 31, 2021 |
|
Cash flows from operating activities: |
||||
Income (loss) after taxation |
$ |
$( |
$( |
|
Cash flows from operations reconciliation: |
||||
Depreciation, depletion and amortization |
7 |
|||
Accretion of asset retirement obligations |
19 |
|||
Impairment of proved properties |
10 |
|||
Income tax (benefit) expense |
8 |
( |
( |
|
(Gain) loss on fair value adjustments of unsettled financial
instruments
|
13 |
( |
||
Asset retirement costs |
19 |
( |
( |
( |
(Gain) loss on natural gas and oil properties and equipment |
5,10,11 |
( |
( |
|
(Gain) loss on sale of equity interest |
5 |
( |
||
Unrealized (gain) loss on investment |
5 |
( |
||
Gain on bargain purchases |
5 |
( |
( |
|
Finance costs |
21 |
|||
Revaluation of contingent consideration |
24 |
|||
Hedge modifications |
13 |
( |
( |
|
Non-cash equity compensation |
17 |
|||
Working capital adjustments: |
||||
Change in trade receivables and other current assets |
( |
|||
Change in other non-current assets |
( |
( |
||
Change in trade and other payables and other current liabilities |
( |
|||
Change in other non-current liabilities |
( |
( |
||
Cash generated from operations |
$ |
$ |
$ |
|
Cash paid for income taxes |
( |
( |
( |
|
Net cash provided by operating activities |
$ |
$ |
$ |
|
Cash flows from investing activities: |
||||
Consideration for business acquisitions, net of cash acquired |
5 |
$ |
$( |
$( |
Consideration for asset acquisitions |
5 |
( |
( |
( |
Proceeds from divestitures |
5 |
|||
Payments associated with potential acquisitions |
15 |
( |
||
Acquisition related debt and hedge extinguishments |
5, 13 |
( |
||
Expenditures on natural gas and oil properties and equipment |
10,11
|
( |
( |
( |
Proceeds on disposals of natural gas and oil properties and
equipment
|
10,11
|
|||
Deferred consideration payments |
( |
|||
Contingent consideration payments |
24 |
( |
( |
|
Net cash used in investing activities |
$( |
$( |
$( |
|
Cash flows from financing activities: |
||||
Repayment of borrowings |
21 |
$( |
$( |
$( |
Proceeds from borrowings |
21 |
|||
Cash paid for interest |
21 |
( |
( |
( |
Debt issuance costs |
21 |
( |
( |
( |
Decrease (increase) in restricted cash |
3 |
( |
||
Hedge modifications associated with ABS Notes |
13, 21 |
( |
( |
|
Proceeds from equity issuance, net |
16 |
|||
Principal element of lease payments |
20 |
( |
( |
( |
Cancellation (settlement) of warrants, net |
16 |
( |
||
Dividends to shareholders |
18 |
( |
( |
( |
Distributions to non-controlling interest owners |
( |
( |
||
Repurchase of shares by the EBT |
16 |
( |
||
Repurchase of shares |
16 |
( |
( |
|
Net cash provided by (used in) financing activities |
$( |
$( |
$ |
|
Net change in cash and cash equivalents |
( |
( |
||
Cash and cash equivalents, beginning of period |
||||
Cash and cash equivalents, end of period |
$ |
$ |
$ |
|
Notes to the Group Financial
Statements
(AMOUNTS IN THOUSANDS, EXCEPT PER SHARE AND PER UNIT DATA)
INDEX TO THE NOTES TO THE GROUP FINANCIAL STATEMENTS

(AMOUNTS IN THOUSANDS, EXCEPT PER SHARE AND PER UNIT DATA)
Diversified Energy Company PLC (the “Parent” or “Company”), formerly Diversified Gas & Oil PLC, and its wholly owned
subsidiaries (the “Group”) is an independent energy company engaged in the production, transportation and marketing of
primarily natural gas related to its synergistic U.S. onshore upstream and midstream assets. The Group’s assets are located
within the Appalachian and Central basins of the U.S.
The Company was incorporated on July 31, 2014 in the United Kingdom and is registered in England and Wales under the
Companies Act 2006 as a public limited company under company number 09156132. The Group‘s registered office is located
at 4th floor Phoenix House, 1 Station Hill, Reading, Berkshire, RG1 1NB, UK.
In May 2020, the Company’s shares were admitted to trading on the LSE’s Main Market for listed securities under the ticker
“DEC”. In December 2023, the Company’s shares were admitted to trading on the New York Stock Exchange (“NYSE”) under
the ticker “DEC.” As of December 31, 2023, the principal trading market for the Company’s ordinary shares was the LSE.
(AMOUNTS IN THOUSANDS, EXCEPT PER SHARE AND PER UNIT DATA)
The Group's consolidated financial statements (the “Group Financial Statements”) have been prepared in accordance with
International Financial Reporting Standards (“IFRS”) as issued by the International Accounting Standards Board (“IASB”). The
principal accounting policies set out below have been applied consistently throughout the year and are consistent with prior
functional currency and the currency of the primary economic environment in which the Group operates, and all values are
rounded to the nearest thousand dollars except per share and per unit amounts and where otherwise indicated.
Transactions in foreign currencies are translated into U.S. Dollars at the rate of exchange on the date of the transaction.
Monetary assets and liabilities denominated in foreign currencies are translated at the exchange rate at the date of the
Consolidated Statement of Financial Position. Where the Group’s subsidiaries have a different functional currency, their results
and financial position are translated into the presentation currency as follows:
—Assets and liabilities in the Consolidated Statement of Financial Position are translated at the closing rate
at the date of that Consolidated Statement of Financial Position;
—Income and expenses in the Consolidated Statement of Comprehensive Income are translated at average exchange rates
(unless this is not a reasonable approximation of the cumulative effect of the rates prevailing on the transaction dates, in
which case income and expenses are translated at the dates of the transactions); and
—All resulting exchange differences are reflected within other comprehensive income in the Consolidated Statement of
Comprehensive Income.
The Group Financial Statements have been prepared under the historical cost convention, as modified by the revaluation of
financial assets and liabilities (including derivative instruments) held at fair value through profit and loss or through other
comprehensive income.
The Group is an independent owner and operator of producing natural gas and oil wells with properties located in the states of
Tennessee, Kentucky, Virginia, West Virginia, Ohio, Pennsylvania, Oklahoma, Texas and Louisiana. The Group’s strategy is to
acquire long-life producing assets, efficiently operate those assets to generate free cash flow for shareholders and then to
retire assets safely and responsibly at the end of their useful life. The Group’s assets consist of natural gas and oil wells,
pipelines and a network of gathering lines and compression facilities which are complementary to the Group’s assets.
In accordance with IFRS the Group establishes segments on the basis on which those components of the Group are evaluated
regularly by the chief executive officer, DEC’s chief operating decision maker (“CODM”), when deciding how to allocate
resources and in assessing performance. When evaluating performance as well as when acquiring and managing assets the
CODM does so in a consolidated and complementary fashion to vertically integrate and improve margins. Accordingly, when
determining operating segments under IFRS 8, the Group has identified one reportable segment that produces and transports
natural gas, NGLs and oil in the U.S.
The Group Financial Statements have been prepared on the going concern basis, which contemplates the continuity of normal
business activity and the realization of assets and the settlement of liabilities in the normal course of business. The Directors
have reviewed the Group’s overall position and outlook and are of the opinion that the Group is sufficiently well funded to be
able to operate as a going concern for at least the next twelve months from the date of approval of this Annual Report & Form
20-F.
The Directors closely monitor and carefully manage the Group’s liquidity risk. Our financial outlook is assessed primarily
through the annual business planning process, however it is also carefully monitored on a monthly basis. This process includes
regular Board discussions, led by senior leadership, at which the current performance of, and outlook for, the Group are
assessed. The outputs from the business planning process include a set of key performance objectives, an assessment of the
Group’s primary risks, the anticipated operational outlook and a set of financial forecasts that consider the sources of funding
available to the Group (the “Base Plan”).
The Base Plan incorporates key assumptions which underpin the business planning process. These assumptions are as follows:
—Projected operating cash flows are calculated using a production profile which is consistent with current operating results
and decline rates;
—Assumes commodity prices are in line with the current forward curve which also considers basis differentials;
—Operating cost levels stay consistent with historical trends;
—The financial impact of our current hedging contracts in place for the assessment period, which represents approximately
—The scenario also includes the scheduled principal and interest payments on our current debt arrangements.
The Directors and management also consider various scenarios around the Base Plan that primarily reflect a more severe, but
plausible, downside impact of the principal risks, both individually and in the aggregate, as well as the additional capital
requirements that downside scenarios could place on us. These scenarios are as follows:
Scenario 1: Cyclically low gas prices for a year (Henry Hub prices of $1.50 per MMbtu before returning to strip pricing), which
have been historically observed in the market.
Scenario 2: Considered the impact of climate change by assuming a two week period of lost production in our East Texas/
Louisiana region, which is susceptible to hurricanes, due to a natural disaster (assumed to occur once in each year of the
assessment period).
Scenario 3: Considered the impact of climate change by assuming a two week period of lost production in our Appalachian
region (assumption of lost production in 25% of the total region), which is susceptible to flooding, due to a natural disaster
(assumed to occur once in each year of the assessment period).
Under these downside sensitivity scenarios, the Group continues to meet its working capital requirements, which primarily
consist of derivative liabilities that, when settled, will be funded utilizing the higher commodity revenues from which the
derivative liability was derived. The Group will also continue to meet the covenant requirements under its Credit Facility as well
as its other existing borrowing instruments.
The Directors and management consider the impact that these principal risks could, in certain circumstances, have on the
Group’s prospects within the assessment period, and accordingly appraise the opportunities to actively mitigate the risk of
these severe, but plausible, downside scenarios. In addition to its modelled downside going concern scenarios, the Board has
stress tested the model to determine the extent of downturn which would result in a breach of covenants. Assuming similar
levels of cash conversion as seen in 2023, a decline in production volume and pricing well in excess of that historically
experienced by the Group would need to persist throughout the going concern period for a covenant breach to occur, which is
considered very unlikely.
In addition to the scenarios above, the Directors also considered the current geopolitical environment and the inflationary
pressures that are currently impacting the U.S., which are being closely monitored by the Group. Notwithstanding the
modelling of specific hypothetical scenarios, the Group believes that the impact associated with these events will largely
continue to be reflected in commodity markets and will extend the volatility experienced in recent months. The Group
considers commodity price risk a principal risk and will continue to actively monitor and mitigate this risk through our hedging
program.
Based on the above, the Directors have reviewed the Group’s overall position and outlook and are of the opinion that the
Group is sufficiently funded to be able to operate as a going concern for the next twelve months from the date of approval of
the Group Financial Statements.
Reclassifications in the Consolidated Statement of Financial Position
The Group reclassified $41,907 to “taxes payable” from “other current liabilities” in the accompanying 2022 Consolidated
Statement of Financial Position to conform to current year presentation.
Reclassifications in the Consolidated Statement of Cash Flows
The Group reclassified certain amounts in it prior year Consolidated Statement of Cash Flows to conform to its current period
presentation. These changes in classification do not affect net cash provided by (used in) financing activities previously
reported in the Consolidated Statement of Cash Flows.
The Group reclassified $1,022 and $1,050 in “principal element of lease payments” to “cash paid for interest” for the years
ended December 31, 2022 and 2021, respectively.
The Group Financial Statements for the year ended December 31, 2023 reflect the following corporate structure of the Group,
and its wholly owned subsidiaries:
—Diversified Energy Company PLC
(“DEC”) as well as its wholly
owned subsidiaries
—Diversified Gas & Oil Corporation
—Diversified Production LLC
—Diversified ABS Holdings LLC
—Diversified ABS LLC
—Diversified ABS Phase II
Holdings LLC
—Diversified ABS Phase II LLC
—Diversified ABS Phase III
Holdings LLC
—Diversified ABS Phase
III LLC
—Diversified ABS III
Upstream LLC
—Diversified ABS Phase III
Midstream LLC
—Diversified ABS Phase IV
Holdings LLC
—Diversified ABS Phase
IV LLC
—Diversified ABS Phase V
Holdings LLC
—Diversified ABS Phase
V LLC
—Diversified ABS V
Upstream LLC
—DP Bluegrass Holdings LLC
—DP Bluegrass LLC
—Chesapeake Granite
Wash Trust(a)
—BlueStone Natural
Resources II LLC
—Sooner State Joint ABS
Holdings LLC(b)
—Diversified ABS Phase VI
Holdings LLC
—Diversified ABS Phase VI
LLC
—Diversified ABS VI
Upstream LLC
—Oaktree ABS VI
Upstream LLC
—DP Lion Equity Holdco LLC(c)
—DP Lion HoldCo LLC(c)
—DP Vandalia Equity Holdco
LLC
—DP Vandalia Holdco LLC
—DP RBL Co LLC
—DP Legacy Central LLC
—Diversified Energy
Marketing LLC
—DP Tapstone Energy
Holdings LLC
—DP Legacy Tapstone LLC
—TGG Cotton Valley Assets, LLC
—Giant Land, LLC(d)
—Link Land LLC(d)
—Old Faithful Land LLC(d)
—Riverside Land LLC(d)
—Splendid Land LLC(d)
—DP Production Holdings II LLC
—Diversified Midstream LLC
—Cranberry Pipeline Corporation
—Coalfield Pipeline Company
—DM Bluebonnet LLC
—Black Bear Midstream
Holdings LLC
—Black Bear Midstream LLC
—Black Bear Liquids LLC
—Black Bear Liquids
Marketing LLC
—DM Pennsylvania Holdco LLC
—DGOC Holdings Sub III LLC
—Diversified Energy Group
LLC
—Diversified Energy Company
LLC
—Next LVL Energy, LLC
(a)Diversified Production, LLC holds 50.8 % of the issued and outstanding common shares of Chesapeake Granite Wash Trust.
(b)Owned 51.25 % by Diversified Production LLC.
(c)Diversified Production, LLC holds 20 % of the issued and outstanding equity of DP Lion Equity Holdco LLC. This entity is not consolidated
within the Group’s financial statements as of December 31, 2023. Refer to Note 5 for additional information.
(d)Owned 55
(AMOUNTS IN THOUSANDS, EXCEPT PER SHARE AND PER UNIT DATA)
The preparation of the Group Financial Statements in compliance with IFRS as issued by the IASB requires management to
make estimates and exercise judgment in applying the Group’s accounting policies. In preparing the Group Financial
Statements, the significant judgments made by management in applying the Group’s accounting policies and the key sources
of estimation uncertainty are disclosed in Note 4.
The Group performs an assessment of each acquisition to determine whether the acquisition should be accounted for as an
asset acquisition or a business combination. For each transaction, the Group may elect to apply the concentration test to
determine if the fair value of assets acquired is substantially concentrated in a single asset (or a group of similar assets). If this
concentration test is met, the acquisition qualifies as an acquisition of a group of assets and liabilities, not of a business.
Accounting for business combinations under IFRS 3 is applied once it is determined that a business has been acquired. Under
IFRS 3, a business is defined as an integrated set of activities and assets conducted and managed for the purpose of providing
a return to investors. A business generally consists of inputs, processes applied to those inputs, and resulting outputs that are,
or will be, used to generate revenues.
When less than the entire interest of an entity is acquired, the choice of measurement of the non-controlling interest, either at
fair value or at the proportionate share of the acquiree’s identifiable net assets, is determined on a transaction by
transaction basis.
More information regarding the judgments and conclusions reached with respect to business combinations and asset
acquisitions is included in Notes 4 and 5.
Oaktree Capital Management, L.P. (“Oaktree”) Participation Agreement
In October 2020, the Group entered into a three-year definitive participation agreement with funds managed by Oaktree to
jointly identify and fund future proved developed producing acquisition opportunities (“PDP acquisitions”) that the Group
identified. The Oaktree Funding Commitment provided for up to $1,000,000 in aggregate over three years for mutually agreed
upon PDP acquisitions with transaction valuations typically greater than $250,000 . The Group and Oaktree each funded 50 %
of the net purchase price in exchange for proportionate working interests of 51.25 % and 48.75 % during Tranche I deals, or joint
acquisitions made during the first 18 months of the agreement, and 52.5 % and 47.5 % during Tranche II deals, or joint
acquisitions made during the second 18 months of the agreement, respectively. The Group's greater share reflected the
upfront promote it received from Oaktree which was intended to compensate the Group for the increase in general and
administrative expenses needed to operate an entity that increases with acquired growth.
Additionally, upon Oaktree achieving a 10 % unlevered internal rate of return, Oaktree would convey a back-end promote to
the Group which would increase the Group’s working interest to 59.625 % for both Tranche I and Tranche II deals. The Group
also maintains the right of first offer to acquire Oaktree’s interest if and when Oaktree decides to divest. The Group and
Oaktree each have the right to participate in a sale by the other party with a third-party upon comparable terms.
The Group accounts for the Oaktree Participation Agreement as a joint operation under IFRS 11, Joint Arrangements (“IFRS
11”). Accordingly, the Group includes its proportionate share of assets, liabilities, revenues and expenses within the
consolidated financial statements.
The Oaktree Participation Agreement ended in October 2023. While Oaktree continues to hold the working interests it
acquired, the agreement to participate in future acquisition opportunities has expired.
Natural gas inventory is stated at the lower of cost and net realizable value, cost being determined on a weighted average cost
basis. Inventory also consists of material and supplies used in connection with the Group’s maintenance, storage and handling.
Inventory is stated at the lower of cost or net realizable value.
Cash on the balance sheet comprises cash at banks. Balances held at banks, at times, exceed U.S. federally insured amounts. The
Group has not experienced any losses in such accounts and the Directors believe the Group is not exposed to any significant credit
Trade receivables are stated at the historical carrying amount, net of any provisions required. Trade receivables are due from
customers throughout the natural gas and oil industry. Although dispersed among several customers, collectability is
dependent on the financial condition of each individual customer as well as the general economic conditions of the industry.
The Directors review the financial condition of customers prior to extending credit and generally do not require collateral to
support the recoverability of the Group’s trade receivables. Any changes in the Group’s allowance for expected credit losses
during the year are recognized in the Consolidated Statement of Comprehensive Income. Trade receivables also include
certain receivables from third-party working interest owners as well as hedge settlement receivables. The Group consistently
working interest receivables uncollectable and recorded an allowance for credit losses in the amount of $16,529 and $8,941 ,
respectively. Refer to Note 14 for additional information.
IFRS 9 requires the application of an expected credit loss model in considering the impairment of financial assets. The
expected credit loss model requires the Group to account for expected credit losses and changes in those expected credit
losses at each reporting date to reflect changes in credit risk since initial recognition of the financial assets. The credit event
does not have to occur before credit losses are recognized. IFRS 9 allows for a simplified approach for measuring the loss
allowance at an amount equal to lifetime expected credit losses for trade receivables.
The Group applies the simplified approach to the expected credit loss model to trade receivables arising from:
—Sales of natural gas, NGLs and oil;
—Sales of gathering and transportation of third-party natural gas; and
—The provision of other services.
Borrowings are recognized initially at fair value, net of any applicable transaction costs incurred. Borrowings are subsequently
carried at amortized cost. Any difference between the proceeds (net of transaction costs) and the redemption value is
recognized in the Consolidated Statement of Comprehensive Income over the period of the borrowings using the effective
interest method.
Interest on borrowings is accrued as applicable to each class of borrowing.
Derivatives are used as part of the Group’s overall strategy to mitigate risk associated with the unpredictability of cash flows
due to volatility in commodity prices. Further details of the Group’s exposure to these risks are detailed in Note 25. The Group
has entered into financial instruments which are considered derivative contracts, such as swaps and collars, which result in net
cash settlements each month and do not result in physical deliveries. The derivative contracts are initially recognized at fair
value at the date the contract is entered into and remeasured to fair value every balance sheet date. The resulting gain or loss
is recognized in the Consolidated Statement of Comprehensive Income in the year incurred in the gain (loss) on derivative
financial instruments line item.
Cash held on deposit for bonding purposes is classified as restricted cash and recorded within current and non-current assets.
The cash (1) is restricted in use by state governmental agencies to be utilized and drawn upon if the operator should abandon
any wells, or (2) is being held as collateral by the Group’s surety bond providers.
Additionally, the Group is required to maintain certain reserves for interest payments related to its asset-backed
securitizations discussed in Note 21. These reserves approximate six to seven months of interest as well as any associated fees.
The Group classifies restricted cash as current or non-current based on the classification of the associated asset or liability to
which the restriction relates. This reserve cash is managed and held by an indenture trustee who monitors the reserve month
to month ensuring the proper quantum is maintained. This trustee is independent, and the conditions of the deposit prevent
December 31, 2023 |
December 31, 2022 |
|
Cash restricted by asset-backed securitizations |
$ |
$ |
Other restricted cash |
||
Total restricted cash |
$ |
$ |
Classified as: |
||
Current asset |
$ |
$ |
Non-current asset |
||
Total |
$ |
$ |
Natural gas and oil activities are accounted for using the principles of the successful efforts method of accounting as described below.
DEVELOPMENT AND ACQUISITION COSTS
Costs incurred to purchase, lease, or otherwise acquire a property are capitalized when incurred. Expenditures related to the
construction, installation or completion of infrastructure facilities, such as platforms, and the drilling of development wells,
including delineation wells, are capitalized within natural gas and oil properties. The initial cost of an asset comprises its
purchase price or construction cost, any costs directly attributable to bringing the asset into operation, and the initial estimate
of the asset retirement obligation.
DEPLETION
Proved natural gas, oil and NGL reserve volumes are used as the basis to calculate unit-of-production depletion rates.
Leasehold costs are depleted on the unit-of-production basis over the total proved reserves of the relevant area while
production and development wells are depleted over proved producing reserves.
SOFTWARE DEVELOPMENT
Development costs that are directly attributable to the design and testing of identifiable and unique software products
controlled by the Group are recognized as intangible assets where the following criteria are met:
—It is technically feasible to complete the software so that it will be available for use;
—The Directors intend to complete the software and use or sell it;
—There is an ability to use the software;
—It can be demonstrated how the software will generate probable future economic benefits;
—Adequate technical, financial and other resources to complete the development and to use the software are available; and
—The expenditure attributable to the software during its development can be reliably measured.
Directly attributable costs that are capitalized as part of the software include cost incurred by third parties, employee costs
and an appropriate portion of relevant overheads. Capitalized development costs are recorded as intangible assets and
amortized from the point at which the asset is ready for use. Costs associated with maintaining software programs are
recognized as an expense as incurred.
IMPAIRMENT OF INTANGIBLE ASSETS
Intangible assets are tested for impairment whenever events or changes in circumstances indicate that the carrying amount may not
be recoverable. An impairment loss is recognized for the amount by which the asset’s carrying amount exceeds its recoverable
amount. The recoverable amount is the higher of an asset’s fair value less costs of disposal and value in use. For the purposes of
assessing impairment, assets are grouped at the lowest levels for which there are separately identifiable cash inflows which are
largely independent of the cash inflows from other assets or groups of assets (cash-generating units). Intangible assets that suffer an
impairment are reviewed for possible reversal of the impairment at the end of each reporting period.
AMORTIZATION
Range in Years |
|
Software |
|
Other acquired intangibles(a)
|
(a)Represents intangible assets acquired in business combinations and asset acquisitions.
Property, plant and equipment are stated at cost less accumulated depreciation and impairment losses, if any. The cost of property,
plant and equipment initially recognized includes its purchase price and any cost that is directly attributable to bringing the asset to
the location and condition necessary for it to be capable of operating in the manner intended by the Directors.
Range in Years |
|
Buildings and leasehold improvements |
|
Equipment |
|
Motor vehicles |
|
Midstream assets |
|
Other property and equipment |
Property, plant and equipment held under leases are depreciated over the shorter of the lease term or estimated useful life.
At each reporting date, the Directors assess whether indications exist that an asset may be impaired. If indications exist, or
when annual impairment testing for an asset is required, the Directors estimate the asset’s recoverable amount. An asset’s
recoverable amount is the higher of an asset’s, or cash generating unit’s, fair value less costs to sell and its value-in-use, and is
determined for an individual asset, unless the asset does not generate cash inflows that are largely independent of those from
other assets or groups of assets. Where the carrying amount of an asset or cash-generating unit exceeds its recoverable
amount, the Directors consider the asset impaired and write the asset down to its recoverable amount. In assessing value-in-
use, the Directors discount the estimated future cash flows to their present value using a discount rate that reflects current
market assessments of the time value of money and the risks specific to the asset. In determining fair value less costs to sell,
the Directors consider recent market transactions, if available. If no such transactions can be identified, the Directors will utilize
an appropriate valuation model.
Non-controlling interests represent the equity in subsidiaries that is not attributable to the Group’s shareholders. The
acquisition of a non-controlling interest in a subsidiary and the sale of an interest while retaining control are accounted for as
transactions within equity and are reported within non-controlling interests in the consolidated financial statements.
During the years ended December 31, 2023, 2022 and 2021, the Group recorded $1,683 , $4,812 and $303 , respectively, of net
income attributable to non-controlling interests. As of December 31, 2023 and 2022, the Group had a non-controlling interests
balance of $12,604 and $14,964 , respectively. During the years ended December 31, 2023, 2022 and 2021, the Group paid
$4,043 , $6,389 and $0 , respectively, in distributions to non-controlling interest owners.
Refer to Note 5 for information regarding the Group’s non-controlling interests in the Chesapeake Granite Wash Trust (“the
GWT”), acquired in connection with the Tapstone Acquisition in December 2021.
The Group recognizes a right-of-use asset and a lease liability at the commencement date of contracts (or separate
components of a contract) which convey to the Group the right to control the use of an identified asset for a period of time in
exchange for consideration, when such contracts meet the definition of a lease as determined by IFRS 16, Leases (“IFRS 16”).
The determination of whether an arrangement is, or contains, a lease is based on the substance of the arrangement at
inception date.
The Group initially measures the lease liability at the present value of the future lease payments. The lease payments are
discounted using the interest rate implicit in the lease. When this rate can not be readily determined, the Group uses its
incremental borrowing rate. After the commencement date, the lease liability is reduced for payments made by the lessee and
increased for interest on the lease liability.
Right-of-use assets are initially measured at cost, which comprises:
—The amount of the initial measurement of the lease liability;
—Any lease payments made at or before the commencement date, less any lease incentives received, any initial direct costs
incurred by the lessee; and
—An estimate of costs to be incurred by the lessee in dismantling and removing the underlying asset, restoring the site on
which it is located or restoring the underlying asset to the condition required by the terms and conditions of the lease
unless those costs are incurred to produce inventories.
Subsequent to the measurement date, the right-of-use asset is depreciated on a straight line basis for a period of time that
reflects the life of the underlying asset, and also adjusted for the remeasurement of any lease liability.
Where a liability for the retirement of a well, removal of production equipment and site restoration at the end of the
production life of a well exists, the Group recognizes a liability for asset retirement. The amount recognized is the present
value of estimated future net expenditures determined in accordance with our anticipated retirement plans as well as with
local conditions and requirements. The unwinding of the discount on the decommissioning liability is included as accretion of
the decommissioning provision. The cost of the relevant property, plant and equipment asset is increased with an amount
equivalent to the liability and depreciated on a unit of production basis. The Group recognizes changes in estimates
prospectively, with corresponding adjustments to the liability and the associated non-current asset.
As of December 31, 2023 and 2022, the Group had no midstream asset retirement obligations.
DEFERRED TAXATION
Deferred tax assets and liabilities arise from temporary differences between the tax bases of assets and liabilities and their
carrying amounts in the Group Financial Statements. Deferred tax is determined using tax rates (and laws) that have been
enacted or substantially enacted by the balance sheet date and are expected to apply when the related deferred tax asset is
realized or the deferred liability is settled.
Deferred tax assets are recognized to the extent that it is probable that the future taxable profit will be available against which
the temporary differences can be utilized.
CURRENT TAXATION
Current income tax assets and liabilities for the years ended December 31, 2023 and 2022 were measured at the amount to be
recovered from, or paid to, the taxation authorities. The tax rates and tax laws used to compute the amount are those that are
enacted or substantively enacted at the reporting date in the jurisdictions where the Group operates and generates
taxable income.
UNCERTAIN TAX POSITIONS
Management periodically evaluates positions taken in tax returns with respect to situations in which applicable tax regulation
is subject to interpretation and considers whether it is probable that a taxation authority will accept an uncertain tax
treatment. The Group measures its tax balances based on either the most likely amount, or the expected value, depending on
which method provides a better prediction of the resolution of the uncertainty.
NATURAL GAS, NGLs AND OIL
Commodity revenue is derived from sales of natural gas, NGLs and oil products and is recognized when the customer obtains
control of the commodity. This transfer generally occurs when the product is physically transferred into a vessel, pipe, sales
meter or other delivery mechanism. This also represents the point at which the Group carries out its single performance
obligation to its customer under contracts for the sale of natural gas, NGLs and oil for the purposes of IFRS 15, Revenue from
Contracts with Customers (“IFRS 15”).
Commodity revenue in which the Group has an interest with other producers is recognized proportionately based on the
Group’s working interest and the terms of the relevant production sharing contracts. Royalty payments or counterparty
distributions, representing the portion of revenue that is due to minority working interests, is included as a liability, described
in Note 23.
Commodity revenue is recorded based on the volumes accepted each day by customers at the delivery point and is measured
using the respective market price index for the applicable commodity plus or minus the applicable basis differential based on
the quality of the product.
THIRD-PARTY GATHERING REVENUE
Revenue from gathering and transportation of third-party natural gas is recognized when the customer transfers its natural gas
to the entry point in the Group’s midstream network and becomes entitled to withdraw an equivalent volume of natural gas
from the exit point in the Group’s midstream network under contracts for the gathering and transportation of natural gas. This
transfer generally occurs when product is physically transferred into the Group’s vessel, pipe, or sales meter. The customer’s
entitlement to withdraw an equivalent volume of natural gas is broadly coterminous with the transfer of natural gas into the
Group’s midstream network. Customers are invoiced and revenue is recognized each month based on the volume of natural
gas transported at a contractually agreed upon price per unit.
THIRD-PARTY PLUGGING REVENUE
Revenue from third-party asset retirement services is recognized as earned in the month work is performed and consistent
with the Group’s contractual obligations. The Group’s contractual obligations in this respect are considered to be its
performance obligations for the purposes of IFRS 15.
OTHER REVENUE
Revenue from the operation of third-party wells is recognized as earned in the month work is performed and consistent with
the Group’s contractual obligations. The Group’s contractual obligations in this respect are considered to be its performance
obligations for the purposes of IFRS 15.
Revenue from the sale of water disposal services to third-parties into the Group’s disposal wells is recognized as earned in the
month the water was physically disposed at a contractually agreed upon price per unit. Disposal of the water is considered to
be the Group’s performance obligation under these contracts.
Revenue is stated after deducting sales taxes, excise duties and similar levies.
The Group accounts for share-based payments under IFRS 2, Share-Based Payment (“IFRS 2”). All of the Group’s share-based
awards are equity settled. The fair value of the awards are determined at the date of grant. As of December 31, 2023, 2022 and
2021, the Group had three types of share-based payment awards: RSUs, PSUs and Options. The fair value of the Group’s RSUs
is measured using the stock price at the grant date. The fair value of the Group’s PSUs is measured using a Monte Carlo
simulation model. The inputs to the Monte Carlo simulation model included:
—The share price at the date of grant;
—Expected volatility;
—Expected dividends;
—Risk free rate of interest; and
—Patterns of exercise of the plan participants.
The fair value of the Group’s Options was calculated using the Black-Scholes model as of the grant date. The inputs to the
Black-Scholes model included:
—The share price at the date of grant;
—Exercise price;
—Expected volatility; and
—Risk-free rate of interest.
The grant date fair value of share-based awards, adjusted for market-based performance conditions, are expensed uniformly
over the vesting period.
The following accounting standards, amendments and interpretations became effective in the current year:
—Disclosure of Accounting Policies: IAS 1 and IFRS Practice Statement 2
—Deferred Tax Related to Assets and Liabilities Arising from a Single Transaction: Amendments to IAS 12
The application of these standards and interpretations effective for the first time in the current year has had no significant
impact on the amounts reported in the Group Financial Statements.
At the date of authorization of the Group Financial Statements, the following standards and interpretations, which have not
been applied in the Group Financial Statements, were in issue but not yet effective. It is expected that where applicable, these
standards and amendments will be adopted on each respective effective date. None of these standards are expected to have a
significant impact on the Group.
Amendments to IFRS |
Effective Date |
Classification of Liabilities as Current or Non-Current and
Non-Current Liabilities with Covenants
|
Annual periods beginning on or after January 1, 2024 |
(AMOUNTS IN THOUSANDS, EXCEPT PER SHARE AND PER UNIT DATA)
In application of the Group's accounting policies, described in Note 3, the Directors have made the following judgments and
estimates which may have a significant effect on the amounts recognized in the Group Financial Statements.
The Group follows the guidance in IFRS 3, Business Combinations (“IFRS 3”) for determining the appropriate accounting
treatment for acquisitions. IFRS 3 permits an initial fair value assessment to determine if substantially all of the fair value of the
assets acquired is concentrated in a single asset or group of similar assets, the “concentration test”. If the initial screening test
is not met, the asset is considered a business based on whether there are inputs and substantive processes in place. Based on
the results of this analysis and conclusion on an acquisition’s classification of a business combination or an asset acquisition,
the accounting treatment is derived.
If the acquisition is deemed to be a business, the acquisition method of accounting is applied. Identifiable assets acquired and
liabilities assumed at the acquisition date are recorded at fair value. When the fair value exceeds the consideration
transferred, a bargain purchase gain is recognized. Conversely, when the consideration transferred exceeds the fair value,
goodwill is recorded. If the transaction is deemed to be an asset purchase, the cost accumulation and allocation model is used
whereby the assets and liabilities are recorded based on the purchase price and allocated to the individual assets and
liabilities based on relative fair values. As a result, gain on bargain purchases are not recognized on asset acquisitions.
Additionally, in instances when the acquisition of a group of assets contains contingent consideration, the Group records
changes in the fair value of the contingent consideration through the basis of the asset acquired rather than through the
Consolidated Statement of Comprehensive Income. More information regarding conclusions reached with respect to this
judgment is included in Note 5.
The determination and allocation of fair values to the identifiable assets acquired and liabilities assumed are based on various
market participant assumptions and valuation methodologies requiring considerable judgment by management. The most
significant variables in these valuations are discount rates and other assumptions and estimates used to determine the cash
inflows and outflows. Management determines discount rates based on the risk inherent in the acquired assets, specific risks,
industry beta and capital structure of guideline companies. The valuation of an acquired business is based on available
information at the acquisition date and assumptions that are believed to be reasonable. However, a change in facts and
circumstances as of the acquisition date can result in subsequent adjustments during the measurement period, but no later
than one year from the acquisition date.
The Group determines the fair value of its natural gas and oil properties acquired in business combinations using the income
approach based on expected discounted future cash flows from estimated reserve quantities, costs to produce and develop
reserves, and natural gas and oil forward prices. The future net cash flows are discounted using a weighted average cost of
capital as well as any additional risk factors. Proved reserves are estimated by reference to available geological and
engineering data and only include volumes for which access to market is assured with reasonable certainty. Estimates of
proved reserves are inherently imprecise, require the application of judgment and are subject to regular revision, either upward
or downward, based on new information such as from the drilling of additional wells, observation of long-term reservoir
performance under producing conditions and changes in economic factors, including product prices, contract terms or
development plans.
In preparing the Group Financial Statements the Directors consider that a key judgment is whether there is any evidence that
the natural gas and oil properties are impaired. When making this assessment, producing assets are reviewed for indicators of
impairment at the balance sheet date. Indicators of impairment for the Group’s producing assets can include significant
or prolonged:
—Decreases in commodity pricing or other negative changes in market conditions;
—Downward revisions of reserve estimates; or
—Increases in operating costs.
The Group reviews the carrying value of its natural gas and oil properties on a field basis annually or when an indicator of
impairment is identified. The impairment test compares the carrying value of natural gas and oil properties to their recoverable
amount based on the present value of estimated future net cash flows from the proved natural gas and oil reserves. The future
cash flows are calculated using estimated reserve quantities, costs to produce and develop reserves, and natural gas and oil
forward prices. The fair value of proved reserves is estimated by reference to available geological and engineering data and
only includes volumes for which access to market is assured with reasonable certainty. When the carrying value is in excess of
the fair value, the Group recognizes an impairment by writing down the value of its natural gas and oil properties to their fair
value. During the year ended December 31, 2023, the Group determined that the carrying amounts of certain proved
properties for two fields were not recoverable from future cash flows and recognized an impairment charge of $41,616 .
The Group assessed the sensitivity of the impairment analysis and noted the primary assumptions include pricing and the
selected discount rate. The Group performed the sensitivity analysis below under different scenarios considering the results of
the Group’s impairment assessment by field under the following scenarios: 1) a high and low pricing environment, using
historically observed average annual high and low prices for natural gas and oil over the last 10 years; and 2) a high and low
selected discount rate, using rates that the Group has observed in completed acquisitions over the last three years. These
changes in assumptions could have the following impact on the Group’s impairment analysis as of December 31, 2023:
Impact from Pricing |
Scenario 1(a)
|
Scenario 2(b)
|
Headroom/(impairment) |
$( |
$ |
(a)Scenario 1 includes commodity base prices of $2.04 and $39.23 for natural gas and oil, respectively, representing the lowest annual average
over the last 10 years. Under this scenario, 4 fields are impaired for a total impairment charge of $473,510 .
(b)Scenario 2 includes commodity base prices of $6.42 and $94.79 for natural gas and oil, respectively, representing the highest annual average
over the last 10 years. Under this scenario, no fields are impaired.
Impact from Discount Rate |
Scenario 1(a)
|
Scenario 2(b)
|
Headroom/(impairment) |
$ |
$ |
(a)Scenario 1 represents the Group’s reserves at a discount rate of 9.5 %, which represents the lowest rate used by the Group in an acquisition
over the past 3 years. Under this scenario, 1 field is impaired for a total impairment charge of $7,265 .
(b)Scenario 2 represents the Group’s reserves at a discount rate of 13.5 %, which represents the highest rate used by the Group in an acquisition
over the past 3 years. Under this scenario, 2 fields are impaired for a total impairment charge of $134,459 .
No such impairments were recorded during the years ended December 31, 2022 and 2021. Refer to Note 10 for additional
information regarding the Group’s impairment assessment.
Where there has been a charge for impairment in an earlier period, that charge will be reversed in a later period when there
has been a change in circumstances to the extent that the recoverable amount is higher than the net book value at the time.
In reversing impairment losses, the carrying amount of the asset will be increased to the lower of its original carrying value or
the carrying value that would have been determined (net of depletion) had no impairment loss been recognized in prior
years. No such recoveries were recorded during the years ended December 31, 2023, 2022, and 2021. Please refer to Note 10
for additional information.
When applicable, the Group recognizes impairment losses in the Consolidated Statement of Comprehensive Income in those
expense categories consistent with the function of the impaired asset.
Proved reserves are the estimated volumes of natural gas, oil and NGLs that can be economically produced with reasonable
certainty from known reservoirs under existing economic conditions and operating methods.
In estimating proved natural gas and oil reserves, we rely on interpretations and judgment of available geological, geophysical,
engineering and production data as well as the use of certain economic assumptions such as commodity pricing. Additional
assumptions include operating expenses, capital expenditures and taxes. Many of the factors, assumptions and variables
involved in estimating proved reserves are subject to change over time and therefore affect the estimates of natural gas, oil
and NGL reserve volumes.
The Group makes certain estimates in calculating deferred tax assets and liabilities, as well as income tax expense. These
estimates often involve judgment regarding differences in the timing and recognition of revenue and expenses for tax and
financial reporting purposes as well as the tax basis of our assets and liabilities at the balance sheet date before tax returns are
completed. Additionally, the Group must assess the likelihood that it will be able to recover or utilize its deferred tax assets
and record a valuation allowance against deferred tax assets when all or a portion of that asset is not expected to be realized.
In evaluating whether a valuation allowance should be applied, the Group considers evidence such as future taxable income,
among other factors. This determination involves numerous judgments and assumptions and includes estimating factors such
as commodity prices, production and other operating conditions. If any of those factors, assumptions or judgments change,
the deferred tax asset could change and, in particular, decrease in a period where the Group determines it is more likely than
not that the asset will not be realized. Alternatively, a valuation allowance may be reversed where it is determined it is more
likely than not that the asset will be realized.
The ultimate asset retirement obligation costs are uncertain and cost estimates can vary in response to many factors including
changes to relevant legal requirements, the emergence of new restoration techniques or experience at other production sites.
The expected timing and amount of expenditures can also change, for example, in response to changes in reserves or changes
in laws and regulations or their interpretation. As a result, significant estimates and assumptions are made in determining the
provision for asset retirement. These assumptions include the cost to retire the wells, the Group’s retirement plan, an assumed
inflation rate and the discount rate. Changes in assumptions related to the Group’s asset retirement obligations could result in
a material change in the carrying value within the next financial year. See Note 19 for more information and sensitivity analysis.
(AMOUNTS IN THOUSANDS, EXCEPT PER SHARE AND PER UNIT DATA)
The assets acquired in all acquisitions include the necessary permits, rights to production, royalties, assignments, contracts and
agreements that support the production from wells and operation of pipelines. The Group determines the accounting
treatment of acquisitions using IFRS 3.
As part of the Group’s corporate strategy, it actively seeks to acquire assets when they meet the Group’s acquisition criteria of
being long-life, low-decline assets that strategically complement the Group’s existing portfolio.
TANOS ENERGY HOLDINGS II LLC (“TANOS II”) ASSET ACQUISITION
On March 1, 2023 the Group acquired certain upstream assets and related infrastructure in the Central Region from Tanos II.
Given the concentration of assets, this transaction was considered an asset acquisition rather than a business combination.
When making this determination management performed an asset concentration test considering the fair value of the acquired
assets. The Group paid purchase consideration of $262,329 , inclusive of transaction costs of $936 and customary purchase
price adjustments. The Group funded the purchase with proceeds from the February 2023 equity raise, cash on hand and
existing availability on the Credit Facility for which the borrowing base was upsized concurrent to the closing of the Tanos II
transaction. Refer to Notes 16 and 21 for additional information regarding the Group’s share capital and borrowings. In the
period from its acquisition to December 31, 2023 the Tanos II assets increased the Group’s revenue by $45,589 .
Consideration paid |
|
Cash consideration |
$ |
Total consideration |
$ |
Net assets acquired |
|
Natural gas and oil properties |
$ |
Asset retirement obligations, asset portion |
|
Property, plant and equipment |
|
Derivative financial instruments, net |
|
Other receivables |
|
Asset retirement obligations, liability portion |
( |
Other current liabilities |
( |
Net assets acquired |
$ |
SALE OF EQUITY INTEREST IN DP LION EQUITY HOLDCO LLC
In November 2023, the Group formed DP Lion Equity Holdco LLC, a limited-purpose, bankruptcy-remote, wholly-owned
subsidiary, to issue Class A and Class B asset-backed securities (collectively “ABS VII”) which are secured by certain upstream
producing assets in Appalachia. The Class A and B asset backed securities were issued in aggregate principal amounts of
$142,000 and $20,000 , respectively.
In December 2023, the Group divested 80
generating cash proceeds of $30,000 20 % interest in DP Lion Equity Holdco LLC and
determined that the governance structure is such that the Group does not have the ability to exercise control, joint control, or
significant influence over the DP Lion Equity Holdco LLC entity. Accordingly, this entity is not consolidated within the Group’s
financial statements as of December 31, 2023. The total assets and liabilities divested are no longer consolidated within the
Group’s financial statements and were as follows:
Consideration received |
|
Cash consideration |
$( |
Total consideration |
$( |
Net assets divested |
|
Natural gas and oil properties |
$( |
Restricted cash |
( |
Derivative financial instruments, net |
( |
Other assets |
( |
Borrowings |
|
Other liabilities |
|
Net assets divested |
$( |
Cost basis of investment retained |
|
Gain on sale of equity interest |
$( |
The consideration exceeded the fair value of the Group’s portion of the assets and liabilities divested resulting in a gain on sale
of the equity interest of $18,440 . The Group’s remaining investment in the LLC is accounted for as an equity instrument at fair
value in accordance with IFRS 9, Financial Instruments (“IFRS 9”) and was $7,500 at December 31, 2023, which generated an
unrealized gain of $4,610 .
On July 17, 2023, the Group sold undeveloped acreage in Oklahoma, within the Group’s Central Region, for net consideration
of approximately $16,060 . The consideration received exceeded the fair value of the net assets divested resulting in a gain on
natural gas and oil properties and equipment of $13,619 .
On June 27, 2023, the Group sold certain non-core, non-operated assets within its Central Region for gross consideration of
approximately $37,589 . The divested assets were located in Texas and Oklahoma and consisted of non-operated wells and the
associated leasehold acreage that was acquired as part of the ConocoPhillips Asset Acquisition in September 2022. This sale
of non-operated and non-core assets aligns with the Group’s application of the Smarter Asset Management strategy and its
strategic focus on operated proved developed producing assets.
Additionally, during the year ended December 31, 2023, the Group divested certain other non-core undeveloped acreage
across its operating footprint for consideration of approximately $12,100 . The consideration received exceeded the fair value of
the net assets divested resulting in a gain on natural gas and oil properties and equipment of $10,547 .
On September 27, 2022 the Group acquired certain upstream assets and related facilities within the Central Region from
ConocoPhillips. Given the concentration of assets, this transaction was considered an asset acquisition rather than a business
combination. When making this determination management performed an asset concentration test considering the fair value
of the acquired assets. The Group paid purchase consideration of $209,766 , including customary purchase price adjustments.
Transaction costs associated with the acquisition were negligible. The Group funded the purchase with available cash on hand
and a draw on the Credit Facility. In the period from its acquisition to December 31, 2022 the ConocoPhillips assets increased
the Group’s revenue by $25,217 .
On April 25, 2022, the Group acquired a proportionate 52.5 % working interest in certain upstream assets and related facilities
within the Central Region from a private seller in conjunction with Oaktree, via the previously disclosed participation
agreement between the two parties. Given the concentration of assets, this transaction was considered an asset acquisition
rather than a business combination. When making this determination, the Group performed an asset concentration test
considering the fair value of the acquired assets. The Group paid purchase consideration of $47,468 , including customary
purchase price adjustments. Transaction costs associated with the acquisition were $1,550 . The Group funded the purchase
with available cash on hand and a draw on the Credit Facility.
During the period ended December 31, 2022 the Group acquired three asset retirement companies for an aggregate
consideration of $13,949 , inclusive of customary purchase price adjustments. The Group will also pay an additional $3,150 in
deferred consideration through November 2024. During the year ended December 31, 2023, the Group paid $2,100 of the
deferred consideration. When evaluating these transactions, the Group determined they did not have significant asset
concentrations and as a result it had acquired identifiable sets of inputs, processes and outputs and concluded the
transactions were business combinations.
On April 1, 2022 the Group acquired certain midstream assets, inclusive of a processing facility, in the Central Region that are
contiguous to its existing East Texas assets. The Group paid purchase consideration of $10,139 , inclusive of customary
purchase price adjustments and transaction costs. When evaluating the transaction, the Group determined it did not have
significant asset concentration and as a result it had acquired an identifiable set of inputs, processes and outputs and
accordingly concluded the transaction was a business combination. The fair value of the net assets acquired was $10,742
generating a bargain purchase gain of $603 .
On November 21, 2022 the Group acquired certain midstream assets in the Central Region that are contiguous to its existing
East Texas assets. The Group paid purchase consideration of $7,438 , inclusive of customary purchase price adjustments and
transaction costs. Given the concentration of assets, this transaction was considered an asset acquisition rather than a
business combination.
Transaction costs associated with the other acquisitions noted above were insignificant and the Group funded the aggregate
cash consideration with existing cash on hand.
On December 7, 2021, the Group acquired a proportionate 51.25 % working interest in certain upstream assets, field
infrastructure, equipment, and facilities within the Central Region from Tapstone in conjunction with Oaktree, via the
previously disclosed participation agreement between the two parties. The acquisition also included six wells which were
under development at the time of close which have now been completed by the Group. The Group serves as the sole operator
of the assets. When evaluating the transaction, the Group determined it did not have significant asset concentration and as a
result it had acquired an identifiable set of inputs, processes and outputs and concluded the transaction was a business
combination that resulted in a bargain purchase gain. The Group paid purchase consideration of $177,496 , inclusive customary
purchase price adjustments. During 2022, the Group recorded $3,853 in measurement period adjustments as purchase
accounting was finalized. These adjustments were recorded as an increase in the bargain purchase gain associated with the
transaction. Transaction costs associated with the acquisition were $4,039 and were expensed. The Group funded the
purchase with proceeds from the Credit Facility.
In connection with the acquisition the Group also acquired the beneficial ownership in the Chesapeake Granite Wash Trust
(“the GWT”). The Group consolidated the GWT as it had determined that it controls the GWT because it (1) possesses power
over the GWT, (2) has exposure to variable returns from its involvement with the GWT, and (3) has the ability to use its power
over the GWT to affect its returns. The elements of control are achieved through the Group operating a majority of the natural
gas and oil properties that are subject to the conveyed royalty interests, marketing of the associated production, and through
its ownership of 50.8 % of the outstanding common units of the GWT. The common units of the GWT owned by third parties
have been reflected as a non-controlling interest in the consolidated financial statements. Common units outstanding as of
December 7, 2021 were 46,750 with the Group’s beneficial interests in the GWT representing 50.8 %. The GWT is publicly
traded and the GWT’s market capitalization was utilized when determining the value of the non-controlling interests.
The GWT’s non-controlling interest is heavily concentrated in the acquired Tapstone natural gas and oil properties and as a
result the Group consolidated $16,087 into its natural gas and oil properties associated with this non-controlling interest as of
December 31, 2021. The remaining amounts in the Group’s Consolidated Statement of Financial Position associated with non-
controlling interest were immaterial and working capital in nature.
On August 18, 2021, the Group acquired a 51.25 % working interest in certain upstream assets, field infrastructure, equipment
and facilities within the Central Region from Tanos, in conjunction with Oaktree, via the previously disclosed participation
agreement between the two parties. When evaluating the transaction, the Group determined it did not have significant asset
concentration and as a result it had acquired an identifiable set of inputs, processes and outputs and concluded the
transaction was a business combination. The Group paid purchase consideration of $116,061 , including customary purchase
price adjustments. Transaction costs associated with the acquisition were $2,384 and were expensed. DEC funded the
purchase with proceeds from a drawdown on the Credit Facility. During 2022 purchase accounting was finalized and no
measurement period adjustments were recorded.
As part of the acquisition, the Group obtained the option to novate or extinguish the Tanos hedge book. In conjunction with
the closing settlement, the Group elected to extinguish their share of the Tanos hedge book. The cost to terminate was
$52,666 . This payment relieved the termination liability established in the Group’s Consolidated Statement of Financial Position
in purchase accounting and has been presented as an investing activity in the Consolidated Statement of Cash Flows given its
connection to the Tanos acquisition. New contracts were subsequently entered into for more favorable pricing in order to
secure the cash flows associated with these producing assets.
On July 5, 2021, the Group acquired certain upstream assets and related gathering infrastructure in the Central Region from
Blackbeard. Given the concentration of assets this transaction was considered an asset acquisition rather than a business
combination. When making this determination management performed an asset concentration test considering the fair value
of the acquired assets. The Group paid purchase consideration of $170,523 , including customary purchase price adjustments
and transaction costs. Transaction costs associated with the acquisition were $3,644 and were capitalized to natural gas and
oil properties. The Group funded the purchase with proceeds from the May 2021 equity placement and a draw on the Credit
Facility, discussed in Notes 16 and 21, respectively. During 2022 purchase accounting was finalized and no measurement period
adjustments were recorded.
On May 19, 2021, the Group acquired certain upstream assets and related gathering infrastructure in the Central Region from
Indigo. Given the concentration of assets this transaction was considered an acquisition of assets rather than a
business combination. When making this determination management performed an asset concentration test considering the
fair value of the acquired assets. The Group paid purchase consideration of $117,352 , including customary purchase price
adjustments and transaction costs. Transaction costs associated with the acquisition were $473 and were capitalized to natural
gas and oil properties. The Group funded the purchase with proceeds from the May 2021 equity placement and a draw on the
Credit Facility, discussed in Notes 16 and 21, respectively. During 2022 purchase accounting was finalized and no measurement
period adjustments were recorded.
On July 9, 2021, the Group divested to Oaktree a non-operating 48.75 % proportionate working interest in the Indigo assets
that were previously acquired (as disclosed above) by the Group on May 19, 2021. The initial consideration received was
$52,314 , or 50 % of the Group’s net purchase price on the Indigo assets which is consistent with the terms of the previously
disclosed participation agreement between the Group and Oaktree. The Group used the proceeds to reduce outstanding
balances on the Credit Facility.
In connection with the divestiture, the Group entered into a swap contract with Oaktree where the Group received a market
price and paid a fixed weighted average swap price of $2.86 per Mcfe. When considering the fair value of the swap
arrangement as well as the value of the upfront promote received from Oaktree at the date of close the Group realized a loss
of $1,461 on the divestiture.
On December 23, 2021, the Group divested certain predominantly undeveloped Haynesville Shale acreage in Texas, acquired
as part of the Tanos acquisition. The total consideration received was $66,168 with DEC’s 51.25 % interest through joint
ownership with Oaktree generating net proceeds of $33,911 to DEC inclusive of customary purchase price adjustments.
Blackbeard, Tanos and Tapstone acquisitions each had occurred on January 1, 2021, the East Texas Assets and ConocoPhillips
acquisition each had occurred on January 1, 2022, and the Tanos II acquisition had occurred on January 1, 2023.
Year Ended |
|||
December 31, 2023 |
December 31, 2022 |
December 31, 2021 |
|
Revenues |
$ |
$ |
$ |
Net income (loss) |
( |
( |
|
The unaudited pro forma information is not necessarily indicative of the operating results that would have occurred had the
the Indigo, Blackbeard, Tanos and Tapstone acquisitions each been completed at January 1, 2021, the East Texas Assets and
ConocoPhillips acquisitions each been completed at January 1, 2022, and the Tanos II acquisition been completed at January 1,
2023, nor is it necessarily indicative of future operating results of the combined entities. The unaudited pro forma information
gives effect to the acquisitions and any related equity and debt issuances, along with the use of proceeds therefrom, as if they
had occurred on the respective dates discussed above and is a result of combining the statements of operations of the Group
with the pre-acquisition results of Indigo, Blackbeard, Tanos, Tapstone, East Texas Assets, ConocoPhillips, and Tanos II
including adjustment for revenues and direct expenses. The pro forma results exclude any cost savings anticipated as a result
of the acquisitions, and include adjustments to depreciation, depletion and amortization based on the purchase price allocated
to property, plant and equipment and the estimated useful lives as well as adjustments to interest expense.
On March 19, 2024 the Group announced it entered into a conditional agreement to acquire Oaktree’s proportionate interest in
the previously announced Indigo, Tanos III, East Texas and Tapstone acquisitions for an estimated gross purchase price of
$410,000 before customary purchase price adjustments. The transaction is expected to be funded through a combination of
existing and expanded liquidity, the assumption of Oaktree’s proportionate debt of approximately $120,000 associated with
the ABS VI amortizing note and approximately $90,000 in deferred cash payments to Oaktree. Additional liquidity for the
transaction may be generated from non-core asset sales and the potential issuance of a private placement preferred
instrument.
The Acquisition is classed as a class 1 transaction under the Listing Rules of the Financial Conduct Authority (“FCA”) and
accordingly it is conditional, amongst other things, on the approval of Diversified’s shareholders, by ordinary resolution, at a
general meeting of the Company.
(AMOUNTS IN THOUSANDS, EXCEPT PER SHARE AND PER UNIT DATA)
The Group extracts and sells natural gas, NGLs and oil to various customers as well as operating a majority of these natural gas
and oil wells for customers and other working interest owners. In addition, the Group provides gathering and transportation
services as well as asset retirement and other services to third parties. All revenue was generated in the U.S.
Year Ended |
|||
December 31, 2023 |
December 31, 2022 |
December 31, 2021 |
|
Natural gas |
$ |
$ |
$ |
NGLs |
|||
Oil |
|||
Total commodity revenue |
$ |
$ |
$ |
Midstream |
|||
Other(a)
|
|||
Total revenue |
$ |
$ |
$ |
(a)Includes $28,360 in third party plugging revenue and $6,939 in other revenue. Refer to Note 3 for additional information.
A significant portion of the Group’s trade receivables represent receivables related to either sales of natural gas, NGLs and oil
or operational services, all of which are uncollateralized, and are collected within 30 - 60 days.
During the year ended December 31, 2023, no customers individually comprised more than 10% of total revenues.
During the year ended December 31, 2022, no customers individually comprised more than 10% of total revenues.
During the year ended December 31, 2021, two customers individually comprised more than 10% of total revenues,
representing 22 % of total revenues.
(AMOUNTS IN THOUSANDS, EXCEPT PER SHARE AND PER UNIT DATA)
Year Ended |
|||
December 31, 2023 |
December 31, 2022 |
December 31, 2021 |
|
LOE(a)
|
$ |
$ |
$ |
Production taxes(b)
|
|||
Midstream operating expenses(c)
|
|||
Transportation expenses(d)
|
|||
Total operating expenses |
$ |
$ |
$ |
Depreciation and amortization |
|||
Depletion |
|||
Total depreciation, depletion and amortization |
$ |
$ |
$ |
Employees, administrative costs and professional services(e)
|
|||
Costs associated with acquisitions(f)
|
|||
Other adjusting costs(g)
|
|||
Non-cash equity compensation(h)
|
|||
Total G&A |
$ |
$ |
$ |
Recurring allowance for credit losses(i)
|
( |
||
Total expenses |
$ |
$ |
$ |
Aggregate remuneration (including Directors): |
|||
Wages and salaries |
$ |
$ |
$ |
Payroll taxes |
|||
Benefits |
|||
Total employees and benefits expense |
$ |
$ |
$ |
(a)LOE includes costs incurred to maintain producing properties. Such costs include direct and contract labor, repairs and maintenance, water
hauling, compression, automobile, insurance, and materials and supplies expenses.
(b)Production taxes include severance and property taxes. Severance taxes are generally paid on produced natural gas, NGLs and oil
production at fixed rates established by federal, state or local taxing authorities. Property taxes are generally based on the taxing
jurisdictions’ valuation of the Group’s natural gas and oil properties and midstream assets.
(c)Midstream operating expenses are daily costs incurred to operate the Group’s owned midstream assets inclusive of employee and
benefit expenses.
(d)Transportation expenses are daily costs incurred from third-party systems to gather, process and transport the Group’s natural gas, NGLs
and oil.
(e)Employees, administrative costs and professional services includes payroll and benefits for our administrative and corporate staff, costs of
maintaining administrative and corporate offices, costs of managing our production operations, franchise taxes, public company costs, fees
for audit and other professional services and legal compliance.
(f)The Group generally incurs costs related to the integration of acquisitions, which will vary for each acquisition. For acquisitions considered to
be a business combination, these costs include transaction costs directly associated with a successful acquisition transaction. These costs
also include costs associated with transition service arrangements where the Group pays the seller of the acquired entity a fee to handle
G&A functions until the Group has fully integrated the assets onto its systems. In addition, these costs include costs related to integrating IT
systems and consulting as well as internal workforce costs directly related to integrating acquisitions into the Group’s system.
(g)Other adjusting costs for the year ended December 31, 2023 were primarily associated with legal and professional fees related to the U.S.
listing, legal fees for certain litigation, and expenses associated with unused firm transportation agreements. Other adjusting costs for the
year ended December 31, 2022 primarily consisted of $28,345 in contract terminations which will allow the Group to obtain more favorable
pricing in the future and $31,099 in costs associated with deal breakage and/or sourcing costs for acquisitions. Other adjusting costs for the
year ended December 31, 2021 were primarily associated with one-time projects and contemplated transactions. Also included in other
adjusting costs were expenses associated with unused firm transportation agreements.
(h)Non-cash equity compensation reflects the expense recognition related to share-based compensation provided to certain key members of
the management team. Refer to Note 17 for additional information regarding non-cash share-based compensation.
(i)Allowance for credit losses consists of the recognition and reversal of credit losses. Refer to Note 14 for additional information regarding
credit losses.
Year Ended |
|||
December 31, 2023 |
December 31, 2022 |
December 31, 2021 |
|
Number of production support employees, including
Directors
|
|||
Number of production employees |
|||
Workforce |
|||
The Directors consider that the Group’s key management personnel comprise the Executive Directors. Bradley G. Gray is
included in the Executive Director remuneration below. Mr. Gray was a Director until September 15, 2023, but is no longer a
Director as of the date of this Annual Report & Form 20-F. The fixed pay figures included in the table represent Mr. Gray’s
prorated compensation for the year ended December 31, 2023. The Directors’ remuneration was as follows for the periods
presented:
Year Ended |
|||
December 31, 2023 |
December 31, 2022 |
December 31, 2021 |
|
Executive Directors |
|||
Salary |
$ |
$ |
$ |
Taxable benefits(a)
|
|||
Benefit plan(b)
|
|||
Bonus(c)
|
|||
Long-term incentives(c)
|
|||
Total Executive Directors' remuneration |
$ |
$ |
$ |
Non-Executive Directors |
|||
Fees |
$ |
$ |
$ |
Total Non-Executive Directors' remuneration |
$ |
$ |
$ |
Total remuneration |
$ |
$ |
$ |
(a)Taxable benefits were comprised of life insurance premiums and automobile reimbursements.
(b)Reflects matching contributions under the Group’s 401(k) plan.
(c)Further details of the bonus outcome for 2023 and long-term incentives can be found in the Remuneration Committee’s Report within this
Details of the highest paid Director’s aggregate emoluments and amounts receivable under long-term incentive schemes are
Year Ended |
|||
December 31, 2023 |
December 31, 2022 |
December 31, 2021 |
|
Auditors' remuneration |
|||
Fees payable to the Group’s external auditors and their
associates for the audit of the consolidated financial
statements(a)
|
$ |
$ |
$ |
Fees payable for the audit of the financial statements of the
Company's subsidiaries(b)
|
|||
Audit-related assurance services(c)
|
|||
Other assurance services |
|||
Total auditors' remuneration |
$ |
$ |
$ |
(a)2023 fees include $249 in relation to additional fees agreed and billed in post signing the 2022 consolidated accounts.
(b)2022 fees have been revised to reflect additional scope change for the audit of the subsidiary accounts.
(c)Fees associated with the Group’s interim review and capital market activity which is outside the scope of the audit of the consolidated
financial statements. 2022 fees have been revised to reflect additional work performed for the interim review.
(AMOUNTS IN THOUSANDS, EXCEPT PER SHARE AND PER UNIT DATA)
The Group files a consolidated U.S. federal tax return, multiple state tax returns, and a separate UK tax return for the Parent
entity. The consolidated taxable income includes an allocable portion of income from the Group’s co-investments with Oaktree
and its investment in the Chesapeake Granite Wash Trust. Income taxes are provided for the tax effects of transactions
reported in the Group Financial Statements and consist of taxes currently due plus deferred taxes related to differences
between the basis of assets and liabilities for financial and income tax reporting.
For the taxable years ended December 31, 2023, 2022, and 2021, the Group had a tax expense of $240,643 , benefit of
$178,904 and benefit of $225,694 , respectively. The effective tax rate used for the year ended December 31, 2023 was 24.1 %,
compared to 22.4 % for the year ended December 31, 2022 and 41.0 % for the year ended December 31, 2021.
The December 31, 2023 effective tax rate was primarily impacted by changes in state taxes as a result of acquisitions and
recurring permanent differences. The December 31, 2022 effective tax rate was primarily impacted by changes in state taxes as
a result of acquisitions. The December 31, 2021 effective tax rate was primarily impacted by the Group’s recognition of the U.S.
marginal well tax credit available to qualified producers in 2021, who operate lower-volume wells during a low commodity
pricing environment. The federal government provides these credits to encourage companies to continue operating lower-
volume wells during periods of low prices to maintain the underlying jobs they create and the state and local tax revenues they
generate for communities to support schools, social programs, law enforcement and other similar public services. The U.S.
marginal well tax credit is prescribed by Internal Revenue Code Section 45I and is available for certain natural gas production
from qualifying wells. The federal tax credit is intended to provide a benefit for wells producing less than 90 Mcfe per day
when market prices for natural gas for the previous tax year are relatively low. The Group benefited from this credit given its
portfolio of long-life, low-decline conventional wells. The tax credit was not available for tax year 2023 and 2022 due to
improved commodity prices during 2022 and 2021.
Year Ended |
|||
December 31, 2023 |
December 31, 2022 |
December 31, 2021 |
|
Current income tax (benefit) expense |
|||
Federal (benefit) expense |
$ |
$( |
$ |
State (benefit) expense |
|||
Foreign - UK (benefit) expense |
( |
||
Total current income tax (benefit) expense |
$ |
$ |
$ |
Deferred income tax (benefit) expense |
|||
Federal (benefit) expense |
$ |
$( |
$( |
State (benefit) expense |
( |
( |
|
Foreign - UK (benefit) expense |
( |
( |
|
Total deferred income tax (benefit) expense |
$ |
$( |
$( |
Total income tax (benefit) expense |
$ |
$( |
$( |
summarized as follows:
Year Ended |
|||
December 31, 2023 |
December 31, 2022 |
December 31, 2021 |
|
Income (loss) before taxation |
$ |
$( |
$( |
Income tax benefit (expenses) |
( |
||
Effective tax rate |
|||
Year Ended |
|||
December 31, 2023 |
December 31, 2022 |
December 31, 2021 |
|
Expected tax at statutory U.S. federal income tax rate |
|||
State income taxes, net of federal tax benefit |
|||
Federal credits |
|||
Other, net |
|||
Effective tax rate |
|||
December 31, 2022. The change was primarily due to a poor commodity price environment generating unrealized gains for
unsettled derivatives not recognized for tax purposes. The Group had a net deferred tax asset of $358,666 at December 31,
2022 compared to a net deferred tax asset of $176,954 at December 31, 2021. The change was primarily due to an improved
commodity price environment generating unrealized losses for unsettled derivatives not recognized for tax purposes. The
presentation in the balance sheet takes into consideration the offsetting of deferred tax assets and deferred tax liabilities
within the same tax jurisdiction, where permitted. The overall deferred tax position in a particular tax jurisdiction determines if
a deferred tax balance related to that jurisdiction is presented within deferred tax assets or deferred tax liabilities.
presented:
December 31, 2023 |
December 31, 2022 |
|
Deferred tax asset |
||
Asset retirement obligations |
$ |
$ |
Derivative financial instruments |
||
Allowance for doubtful accounts |
||
Net operating loss carryover |
||
Federal tax credits carryover |
||
163(j) interest expense limitation |
||
Other |
||
Total deferred tax asset |
$ |
$ |
Deferred tax liability |
||
Amortization and depreciation |
$( |
$( |
Investment in partnerships |
( |
( |
Total deferred tax liability |
$( |
$( |
Net deferred tax asset (liability) |
$ |
$ |
Balance sheet presentation |
||
Deferred tax asset |
$ |
$ |
Deferred tax liability |
( |
( |
Net deferred tax asset (liability) |
$ |
$ |
In assessing the realizability of deferred tax assets, the Group considers whether it is probable that some or all of the deferred
tax assets will not be realized. The ultimate realization of deferred tax assets is dependent upon the generation of future
taxable income during the periods in which those temporary differences become deductible or before credits expire. The
Group considers the scheduled reversal of deferred tax liabilities, projected future taxable income and tax planning strategies
in making this assessment. The Group has determined, at this time, it will have sufficient future taxable income to recognize its
deferred tax assets.
Opening Balance |
Consolidated
Statement of
Comprehensive
Income
|
Other(a)
|
Closing Balance |
|
Asset retirement obligations |
$ |
$ |
$ |
$ |
Allowance for doubtful accounts |
||||
Net operating loss carryover |
( |
|||
Federal tax credits carryover |
( |
|||
Property, plant, and equipment and natural
gas and oil properties
|
( |
( |
||
Derivative financial instruments |
( |
|||
Investment in partnerships |
( |
( |
||
163(j) interest expense limitation |
||||
Other |
( |
( |
||
Total deferred tax asset (liability) |
$ |
$( |
$( |
$ |
(a)Amounts primarily relate to deferred taxes acquired as part of acquisition purchase accounting.
The Group reported the effects of deferred tax expense as of and for the year ended December 31, 2022:
Opening Balance |
Consolidated
Statement of
Comprehensive
Income
|
Other(a)
|
Closing Balance |
|
Asset retirement obligations |
$ |
$( |
$ |
$ |
Allowance for doubtful accounts |
||||
Net operating loss carryover |
( |
|||
Federal tax credits carryover |
||||
Property, plant, and equipment and natural
gas and oil properties
|
( |
( |
||
Derivative financial instruments |
||||
Investment in partnerships |
( |
( |
( |
|
163(j) interest expense limitation |
||||
Other |
||||
Total deferred tax asset (liability) |
$ |
$ |
$ |
$ |
(a)Amounts primarily relate to deferred taxes acquired as part of acquisition purchase accounting.
The Group reported the effects of deferred tax expense as of and for the year ended December 31, 2021:
Opening Balance |
Consolidated
Statement of
Comprehensive
Income
|
Other(a)
|
Closing Balance |
|
Asset retirement obligations |
$ |
$ |
$ |
$ |
Allowance for doubtful accounts |
( |
|||
Net operating loss carryover |
( |
|||
Federal tax credits carryover |
||||
Property, plant, and equipment and natural
gas and oil properties
|
( |
( |
( |
|
Derivative financial instruments |
||||
Investment in partnerships |
( |
( |
( |
|
Other |
||||
Total deferred tax asset (liability) |
$( |
$ |
$( |
$ |
(a)Amounts primarily relate to deferred taxes acquired as part of acquisition purchase accounting.
The Group’s material deferred tax assets and liabilities all arise in the U.S.
For U.S. federal tax purposes, the Group is taxed as one consolidated entity. The Group’s co-investments with Oaktree and its
investment in the Chesapeake Granite Wash Trust are taxed as partnerships that pass through to the Group’s consolidated
return. The Group is subject to additional taxes in its domiciled jurisdiction of the UK. For the years ended December 31, 2023,
2022, and 2021, the Group incurred no tax impact, an expense of $107 , and a benefit of $52 in the UK, respectively.
The Group has considered the impact of Pillar Two income taxes and does not expect this to impact current tax expense in the
current year.
The Group had no
As of December 31, 2023, the Group had U.S. federal net operating loss carryforwards (“NOLs”) of approximately $1,600 , of
which $1,504 are subject to limitation. Additionally, the Group had U.S. state NOLs of approximately $4,025 , which expire in
the years 2035 through 2038.
The Group had U.S. marginal well tax credit carryforwards of approximately $163,158 as of December 31, 2023 compared to
$184,975 as of December 31, 2022. The Group had U.S. marginal well tax credit carryforwards of approximately $184,975 as of
December 31, 2022 compared to $183,460 as of December 31, 2021. As discussed earlier, the federal tax credit is intended to
provide a benefit for wells producing less than 90 Mcfe per day when market prices for natural gas are relatively low. Due to
the improved commodity price environment in 2022, the Group did not generate federal tax credits for the year ended
December 31, 2023. The tax credits expire in the years 2038 through 2042.
The Group had no U.S. federal capital loss carryforwards as of December 31, 2023 compared to $21,401 as of December 31,
2022. The Group had U.S. federal capital loss carryforwards of $21,401 as of December 31, 2022 compared to $9,904 as of
December 31, 2021. For the year ended December 31, 2023, no capital loss carryforwards expired. The Group utilized all of the
existing capital loss carryforward in the amount of $23,102 in 2023, therefore there is no capital loss carryforward going
into 2024.
The Group completed a Section 382 study through December 31, 2023 in accordance with the Internal Revenue Code of 1986,
as amended. If the Group experiences an ownership change, tax credit carryforwards can be utilized but are limited each year
and could expire before they are fully utilized. The study concluded that the Group has not experienced an ownership change
as defined by Section 382 since the last ownership change that occurred on January 31, 2018. The Directors expect its tax
credit carryforwards, limited by the January 31, 2018 ownership change, to be fully available for utilization by 2024.
(AMOUNTS IN THOUSANDS, EXCEPT PER SHARE AND PER UNIT DATA)
The calculation of basic earnings (loss) per share is based on net income (loss) and on the weighted average number of shares
outstanding during the period. The calculation of diluted earnings per share is based on net income (loss) and the weighted
average number of shares outstanding plus the weighted average number of shares that would be issued if dilutive options
and warrants were converted into shares on the last day of the reporting period. The weighted average number of shares
outstanding for the computation of both basic and diluted earnings (loss) per share excludes shares held as treasury shares in
the Employee Benefit Trust (“EBT”), which for accounting purposes are treated in the same manner as shares held in the
treasury reserve. Refer to Note 16 for additional information regarding the EBT.
Effective December 5, 2023, the Company executed a 20-for-1 consolidation of its outstanding shares. The Group’s weighted
average shares outstanding and earnings (loss) per share calculation have been retroactively adjusted for all reporting periods.
Year Ended |
||||
Calculation |
December 31, 2023 |
December 31, 2022 |
December 31, 2021 |
|
Net income (loss) attributable to Diversified
Energy Company PLC
|
A |
$ |
$( |
$( |
Weighted average shares outstanding - basic |
B |
|||
Dilutive impact of potential shares |
||||
Weighted average shares outstanding - diluted |
C |
|||
Earnings (loss) per share - basic |
= A/B |
$ |
$( |
$( |
Earnings (loss) per share - diluted |
= A/C |
$ |
$( |
$( |
Potentially dilutive shares(a)
|
||||
(a)Outstanding share-based payment awards excluded from the diluted EPS calculation because their effect would have been anti-dilutive.
(AMOUNTS IN THOUSANDS, EXCEPT PER SHARE AND PER UNIT DATA)
Year Ended |
||||
December 31, 2023 |
December 31, 2022 |
December 31, 2021 |
||
Costs |
||||
Beginning balance |
$ |
$ |
$ |
|
Additions(a)
|
||||
Disposals(b)
|
( |
( |
( |
|
Ending balance |
$ |
$ |
$ |
|
Depletion and impairment |
||||
Beginning balance |
$( |
$( |
$( |
|
Depletion expense |
( |
( |
( |
|
Impairment |
( |
|||
Ending balance |
$( |
$( |
$( |
|
Net book value |
$ |
$ |
$ |
|
(a)For the year ended December 31, 2023, the Group added $266,306 related to acquisitions and $42,650 resulting from normal revisions to
the Group’s asset retirement obligations. The remaining change is primarily attributable to recurring capital expenditures. For the year ended
December 31, 2022, the Company added $285,212 related to acquisitions, offset by $98,802 resulting from normal revisions to the
Company’s asset retirement obligations. The remaining additions are primarily attributable to capital expenditures associated with the
completion of five Tapstone wells that were under development as of December 31, 2021, and seven additional wells in which the Group
participated with a non-operating interest in Appalachia. The remaining change is primarily attributable to recurring capital expenditures.
For the year ended December 31, 2021, the Group added $907,383 related to acquisitions and $78,156 resulting from normal revisions to the
Group’s asset retirement obligations. The remaining change is primarily attributable to recurring capital expenditures and the revaluation of
the EQT contingent consideration. Refer to Notes 5 and 19 for additional information regarding acquisitions and asset retirement
obligations, respectively.
(b)For the year ended December 31, 2023, the Group divested $202,886 in natural gas and oil properties related to the sale of equity interest in
DP Lion Equity Holdco LLC, the divested assets previously acquired as part of the ConocoPhillips Asset Acquisition, and other proved
properties and undeveloped acreage divestitures. Disposals for the year ended December 31, 2022 were associated with divestitures of
natural gas and oil properties in the normal course of business, none of which were material. For the year ended December 31, 2021, the
Group divested $113,752 in natural gas and oil properties related to the Indigo and Tanos undeveloped acreage transactions. Refer to Note 5
Impairment Assessment for Natural Gas and Oil Properties
For the period ended December 31, 2023, the Directors assessed the indicators of impairment, noting depressed commodity
prices represented an indicator of potential impairment. The estimated future cash flows expected in connection with each
field are compared to the carrying amount of the field to determine if the carrying amount is recoverable. Due to the
unavailability of relevant comparable market data, a discounted cash flow method is used to determine the fair value of proved
properties. Significant unobservable inputs (Level 3) utilized in the determination of discounted future net cash flows include
future commodity prices adjusted for differentials, forecasted production based on decline curve analysis, estimated future
operating costs, property ownership interests, and a 10.9 % discount rate. For the year ended December 31, 2023, the Company
determined the carrying amounts of certain proved properties within two fields were not recoverable from future cash flows,
and therefore, were impaired. Such impairments totaled $41,616 for the year ended December 31, 2023.
For the years ended December 31, 2022 and December 31, 2021, estimated future cash flows were determined to be in excess
of cost basis, and therefore no
(AMOUNTS IN THOUSANDS, EXCEPT PER SHARE AND PER UNIT DATA)
Year Ended December 31, 2023 |
||||||
Buildings and
Leasehold
Improvements
|
Equipment |
Motor
Vehicles
|
Midstream
Assets
|
Other
Property
and
Equipment
|
Total |
|
Costs |
||||||
Beginning balance |
$ |
$ |
$ |
$ |
$ |
$ |
Additions(a)
|
||||||
Disposals |
( |
( |
( |
( |
( |
|
Ending balance(b)
|
$ |
$ |
$ |
$ |
$ |
$ |
Accumulated depreciation |
||||||
Beginning balance |
$( |
$( |
$( |
$( |
$( |
$( |
Period changes |
( |
( |
( |
( |
( |
( |
Disposals |
||||||
Ending balance |
$( |
$( |
$( |
$( |
$( |
$( |
Net book value |
$ |
$ |
$ |
$ |
$ |
$ |
Year Ended December 31, 2022 |
||||||
Buildings and
Leasehold
Improvements
|
Equipment |
Motor
Vehicles
|
Midstream
Assets
|
Other
Property
and
Equipment
|
Total |
|
Costs |
||||||
Beginning balance |
$ |
$ |
$ |
$ |
$ |
$ |
Additions(a)
|
||||||
Disposals |
( |
( |
( |
( |
( |
|
Ending balance(b)
|
$ |
$ |
$ |
$ |
$ |
$ |
Accumulated depreciation |
||||||
Beginning balance |
$( |
$( |
$( |
$( |
$( |
$( |
Period changes |
( |
( |
( |
( |
( |
( |
Disposals |
||||||
Ending balance |
$( |
$( |
$( |
$( |
$( |
$( |
Net book value |
$ |
$ |
$ |
$ |
$ |
$ |
Year Ended December 31, 2021 |
||||||
Buildings and
Leasehold
Improvements
|
Equipment |
Motor
Vehicles
|
Midstream
Assets
|
Other
Property
and
Equipment
|
Total |
|
Costs |
||||||
Beginning balance |
$ |
$ |
$ |
$ |
$ |
$ |
Additions(a)
|
||||||
Disposals |
( |
( |
( |
( |
||
Ending balance(b)
|
$ |
$ |
$ |
$ |
$ |
$ |
Accumulated depreciation |
||||||
Beginning balance |
$( |
$( |
$( |
$( |
$( |
$( |
Period changes |
( |
( |
( |
( |
( |
( |
Disposals |
||||||
Ending balance |
$( |
$( |
$( |
$( |
$( |
$( |
Net book value |
$ |
$ |
$ |
$ |
$ |
$ |
(a)Of the $42,496 in 2023 additions, $234 was related to acquisitions and $13,279 was associated with right-of-use asset additions for new
leases. Of the $95,245 in 2022 additions, $26,815 was related to acquisitions and $11,295 was associated with right-of-use asset additions for
new leases. The remaining capital expenditures are a result of our recurring capital needs and enhanced sustainability efforts. Of the $70,855
in 2021 additions, $25,961 was related to acquisitions and $16,554 was associated with right-of-use asset additions for new and acquired
leases. Refer to Notes 5 and 20 for additional information regarding acquisitions and leases, respectively. Remaining additions are related to
routine capital projects on the Group’s compressor and gathering systems, vehicle and equipment additions.
(b)Buildings and Leasehold Improvements and Motor Vehicles are inclusive of right-of-use assets associated with the Group’s leases. Refer to
Note 20 for additional information regarding leases.
The Group continued to utilize certain fully depreciated assets during the years ended December 31, 2023, 2022 and 2021 with
an original cost basis of $6,546 , $9,222 and $5,597 , respectively.
(AMOUNTS IN THOUSANDS, EXCEPT PER SHARE AND PER UNIT DATA)
Year Ended December 31, 2023 |
|||
Software |
Other Acquired
Intangibles
|
Total |
|
Costs |
|||
Beginning balance |
$ |
$ |
$ |
Additions(a)
|
|||
Disposals |
( |
( |
( |
Ending balance |
$ |
$ |
$ |
Accumulated amortization |
|||
Beginning balance |
$( |
$( |
$( |
Period changes |
( |
( |
( |
Disposals |
|||
Ending balance |
$( |
$( |
$( |
Net book value |
$ |
$ |
$ |
Year Ended December 31, 2022 |
|||
Software |
Other Acquired
Intangibles
|
Total |
|
Costs |
|||
Beginning balance |
$ |
$ |
$ |
Additions(a)
|
|||
Ending balance |
$ |
$ |
$ |
Accumulated amortization |
|||
Beginning balance |
$( |
$( |
$( |
Period changes |
( |
( |
( |
Ending balance |
$( |
$( |
$( |
Net book value |
$ |
$ |
$ |
Year Ended December 31, 2021 |
|||
Software |
Other Acquired
Intangibles
|
Total |
|
Costs |
|||
Beginning balance |
$ |
$ |
$ |
Additions(a)
|
|||
Ending balance |
$ |
$ |
$ |
Accumulated amortization |
|||
Beginning balance |
$( |
$( |
$( |
Period changes |
( |
( |
( |
Ending balance |
$( |
$( |
$( |
Net book value |
$ |
$ |
$ |
(a)For the years ended December 31, 2023, 2022 and 2021 additions were related to software enhancements and other acquired intangibles.
(AMOUNTS IN THOUSANDS, EXCEPT PER SHARE AND PER UNIT DATA)
The Group is exposed to volatility in market prices and basis differentials for natural gas, NGLs and oil, which impacts the
predictability of its cash flows related to the sale of those commodities. The Group can also have exposure to volatility in
interest rate markets, depending on the makeup of its debt structure, which impacts the predictability of its cash flows related
to interest payments on the Group’s variable rate debt obligations. These risks are managed by the Group’s use of certain
derivative financial instruments. As of December 31, 2023, the Group’s derivative financial instruments consisted of swaps,
collars, basis swaps, stand-alone put and call options, and swaptions. A description of these instruments is as follows:
Swaps: |
If the Group sells a swap, it receives a fixed price for the contract and pays a floating market price to
the counterparty;
|
Collars: |
Arrangements that contain a fixed floor price (purchased put option) and a fixed ceiling price (sold call
option) based on an index price which, in aggregate, have no net costs. At the contract settlement date,
(1) if the index price is higher than the ceiling price, the Group pays the counterparty the difference
between the index price and ceiling price, (2) if the index price is between the floor and ceiling prices, no
payments are due from either party, and (3) if the index price is below the floor price, the Group will
receive the difference between the floor price and the index price.
Certain collar arrangements may also include a sold put option with a strike price below the purchased put
option. Referred to as a three-way collar, the structure works similar to the above description, except that
when the index price settles below the sold put option, the Group pays the counterparty the difference
between the index price and sold put option, effectively enhancing realized pricing by the difference
between the price of the sold and purchased put option;
|
Basis swaps: |
Arrangements that guarantee a price differential for commodities from a specified delivery point. If the
Group sells a basis swap, it receives a payment from the counterparty if the price differential is greater
than the stated terms of the contract and pays the counterparty if the price differential is less than the
stated terms of the contract;
|
Put options: |
The Group purchases and sells put options in exchange for a premium. If the Group purchases a put
option, it receives from the counterparty the excess (if any) of the market price below the strike price of
the put option at the time of settlement, but if the market price is above the put’s strike price, no payment
is due from either party. If the Group sells a put option, the Group pays the counterparty the excess (if
any) of the market price below the strike price of the put option at the time of settlement, but if the
market price is above the put’s strike price, no payment is due from either party;
|
Call options: |
The Group purchases and sells call options in exchange for a premium. If the Group purchases a call
option, it receives from the counterparty the excess (if any) of the market price over the strike price of the
call option at the time of settlement, but if the market price is below the call’s strike price, no payment is
due from either party. If the Group sells a call option, it pays the counterparty the excess (if any) of the
market price over the strike price of the call option at the time of settlement, but if the market price is
below the call’s strike price, no payment is due from either party; and
|
Swaptions: |
If the Group sells a swaption, the counterparty will receive the option to enter into a swap contract at a
specified date and receives a fixed price for the contract and pays a floating market price to the
counterparty.
|
The Group may elect to enter into offsetting transactions for the above instruments for the purpose of cancelling or
terminating certain positions.
as follows:
NATURAL GAS CONTRACTS |
Weighted Average Price per Mcfe(a)
|
||||||
Volume |
Sold |
Purchased |
Sold |
Basis |
Fair Value at |
||
(Mmbtu) |
Swaps |
Puts |
Puts |
Calls |
Differential |
December 31, 2023 |
|
2024 |
|||||||
Swaps |
$ |
$— |
$— |
$— |
$— |
$ |
|
Collars |
— |
— |
— |
||||
Stand-Alone Calls, net(b)
|
— |
— |
— |
— |
— |
( |
|
Basis Swaps |
— |
— |
— |
— |
( |
( |
|
Total 2024 contracts |
|||||||
2025 |
|||||||
Swaps |
$ |
$— |
$— |
$— |
$— |
$( |
|
Stand-Alone Calls, net(b)
|
— |
— |
— |
— |
— |
( |
|
Basis Swaps |
— |
— |
— |
— |
( |
||
Total 2025 contracts |
( |
||||||
2026 |
|||||||
Swaps |
$ |
$— |
$— |
$— |
$— |
$( |
|
Stand-Alone Calls |
— |
— |
— |
— |
( |
||
Basis Swaps |
— |
— |
— |
— |
( |
( |
|
Total 2026 contracts |
( |
||||||
2027 |
|||||||
Swaps |
$ |
$— |
$— |
$— |
$— |
$( |
|
Collars |
— |
— |
— |
||||
Stand-Alone Calls |
— |
— |
— |
— |
( |
||
Purchased puts |
— |
— |
— |
— |
|||
Sold puts |
— |
— |
— |
— |
( |
||
2028 |
|||||||
Swaps |
$ |
$— |
$— |
$— |
$— |
$( |
|
Collars |
— |
— |
— |
||||
Purchased puts |
— |
— |
— |
— |
|||
Sold puts |
— |
— |
— |
— |
( |
||
2029 |
|||||||
Swaps |
$ |
$— |
$— |
$— |
$— |
$( |
|
Collars |
— |
— |
— |
||||
Purchased puts |
— |
— |
— |
— |
|||
Sold puts |
— |
— |
— |
— |
( |
||
2030 |
|||||||
Swaps |
$ |
$— |
$— |
$— |
$— |
$( |
|
Purchased puts |
— |
— |
— |
— |
|||
Sold puts |
— |
— |
— |
— |
( |
||
Swaptions |
|||||||
10/1/2024-9/30/2028(c)
|
$ |
$— |
$— |
$— |
$— |
$( |
|
1/1/2025-12/31/2029(d)
|
— |
— |
— |
— |
( |
||
4/1/2026-3/31/2030(e)
|
— |
— |
— |
— |
( |
||
4/1/2030-3/31/2032(f)
|
— |
— |
— |
— |
( |
||
Total 2027-2032 contracts |
$( |
||||||
Total natural gas contracts |
$( |
||||||
(a)Rates have been converted from Btu to Mcfe using a Btu conversion factor of 1.07.
(b)Future cash settlements for deferred premiums.
(c)Option expires on September 6, 2024.
(d)Option expires on December 23, 2024.
(e)Option expires on March 23, 2026.
(f)Option expires on March 22, 2030.
NGLs CONTRACTS |
Weighted Average Price per Bbl |
|||
Volume |
Sold |
Fair Value at |
||
(MBbls) |
Swaps |
Calls |
December 31, 2023 |
|
2024 |
||||
Swaps |
$ |
$— |
$ |
|
Stand-Alone Calls |
— |
( |
||
2025 |
||||
Swaps |
$ |
$— |
$( |
|
2026 |
||||
Swaps |
$ |
$— |
$( |
|
Total NGLs contracts |
$ |
|||
OIL CONTRACTS |
Weighted Average Price per Bbl |
|||
Volume |
Sold |
Fair Value at |
||
(MBbls) |
Swaps |
Calls |
December 31, 2023 |
|
2024 |
||||
Swaps |
$ |
$— |
$( |
|
Sold Calls |
— |
( |
||
2025 |
||||
Swaps |
$ |
$— |
$( |
|
2026 |
||||
Swaps |
$ |
$— |
$( |
|
2027 |
||||
Swaps |
$ |
$— |
$( |
|
Total oil contracts |
$( |
|||
INTEREST |
Principal
Hedged
|
Fair Value at |
|
Fixed-Rate |
December 31, 2023 |
||
2023 |
|||
SOFR Interest Rate Swap |
$ |
||
Net fair value of derivative financial instruments as of December 31, 2023
|
$( |
liabilities are with the same counterparty and a legal right of set-off exists, subject to a master netting arrangement. The
Directors have elected to present derivative assets and liabilities net when these conditions are met. The following table
outlines the Group’s net derivatives as of the periods presented:
Derivative Financial Instruments |
Consolidated Statement of Financial
Position
|
December 31, 2023 |
December 31, 2022 |
Assets: |
|||
Non-current assets |
Derivative financial instruments |
$ |
$ |
Current assets |
Derivative financial instruments |
||
Total assets |
$ |
$ |
|
Liabilities |
|||
Non-current liabilities |
Derivative financial instruments |
$( |
$( |
Current liabilities |
Derivative financial instruments |
( |
( |
Total liabilities |
$( |
$( |
|
Net assets (liabilities): |
|||
Net assets (liabilities) - non-current |
Other non-current assets (liabilities) |
$( |
$( |
Net assets (liabilities) - current |
Other current assets (liabilities) |
( |
|
Total net assets (liabilities) |
$( |
$( |
The Group presents the fair value of derivative contracts on a net basis in the consolidated statement of financial position. The
following presents the impact of this presentation on the Group’s recognized assets and liabilities as of the periods indicated:
December 31, 2023 |
|||
Presented without
Effects of Netting
|
Effects of Netting |
As Presented with
Effects of Netting
|
|
Non-current assets |
$ |
$( |
$ |
Current assets |
( |
||
Total assets |
$ |
$( |
$ |
Non-current liabilities |
( |
( |
|
Current liabilities |
( |
( |
|
Total liabilities |
$( |
$ |
$( |
Total net assets (liabilities) |
$( |
$ |
$( |
December 31, 2022 |
|||
Presented without
Effects of Netting
|
Effects of Netting |
As Presented with
Effects of Netting
|
|
Non-current assets |
$ |
$( |
$ |
Current assets |
( |
||
Total assets |
$ |
$( |
$ |
Non-current liabilities |
( |
( |
|
Current liabilities |
( |
( |
|
Total liabilities |
$( |
$ |
$( |
Total net assets (liabilities) |
$( |
$ |
$( |
Comprehensive Income for the periods presented:
Year Ended |
|||
December 31, 2023 |
December 31, 2022 |
December 31, 2021 |
|
Net gain (loss) on commodity derivatives settlements(a)
|
$ |
$( |
$( |
Net gain (loss) on interest rate swaps(a)
|
( |
( |
( |
Gain (loss) on foreign currency hedges(a)
|
( |
( |
|
Total gain (loss) on settled derivative instruments |
$ |
$( |
$( |
Gain (loss) on fair value adjustments of unsettled financial
instruments(b)
|
( |
( |
|
Total gain (loss) on derivative financial instruments |
$ |
$( |
$( |
(a)Represents the cash settlement of hedges that settled during the period.
(b)Represents the change in fair value of financial instruments net of removing the carrying value of hedges that settled during the period.
All derivatives are defined as Level 2 instruments as they are valued using inputs and outputs other than quoted prices that are
observable for the assets and liabilities.
From time to time, such as when acquiring producing assets, completing ABS financings or navigating changing price
environments, the Group will opportunistically modify, offset, extinguish or add to certain existing hedge positions.
Modifications include the volume of production subject to contracts, the swap or strike price of certain derivative contracts
and similar elements of the derivative contract. The Group maintains distinct, long-dated derivative contract portfolios for its
ABS financings and Term Loan I. The Group also maintains a separate derivative contract portfolio related to its assets
collateralized by the Credit Facility. The derivative contract portfolios for the Group’s ABS financings, Term Loan 1 and Credit
Facility are reflected in the Group’s Statement of Financial Position.
In February 2023, the Group sold puts in ABS III for approximately $9,045 and replaced them with swaps to maintain the
appropriate level and composition of derivatives at both the legal entity and full-company level. In August 2023, the Group
monetized $9,240 in purchased puts associated with its ABS hedge books and transitioned the monetized positions into long-
dated swap agreements. The Group also monetized an additional $8,401 in net modifications, primarily comprised of swap
terminations. As these modifications were made in the normal course of business for the year ended December 31, 2023, they
are presented as an operating activity in the Consolidated Statement of Cash Flows.
In November 2023, the Group adjusted portions of its commodity derivative portfolio across its legal entities to ensure that it
maintained the appropriate level and composition at both the legal entity and full-Group level for the completion of the ABS
VII financing arrangement. These portfolio adjustments included novations of certain contracts to the legal entities holding the
ABS VII Notes. The Group paid $6,376 for these portfolio adjustments. As these modifications were associated with a
borrowing transaction, these amounts are presented as a financing activity in the Consolidated Statement of Cash Flows.
Refer to Note 21 for additional information regarding ABS financing arrangements.
In February 2022, the Group adjusted portions of its commodity derivative portfolio across its legal entities to ensure that it
maintained the appropriate level and composition at both the legal entity and full-Group level for the completion of the ABS III
and ABS IV financing arrangements. The Group completed these adjustments by entering into new commodity derivative
contracts and novating certain derivative contracts to the legal entities holding the ABS III and ABS IV notes. The Group paid
$41,823 for these portfolio adjustments, driven primarily by the purchase of long-dated puts for ABS III and ABS IV that
collectively increased the value of the Group’s derivative position by an equal amount, and were required under the respective
ABS III and ABS IV indentures. The Group recorded payments for offsetting positions as new derivative financial instruments
and applied extinguishment payments against the existing commodity contracts in its Consolidated Statement of
Financial Position.
In May 2022, and in October 2022 the Group completed the ABS V and ABS VI financing arrangements, respectively, and
made similar commodity derivative portfolio adjustments to maintain the appropriate level and composition of derivatives at
both the legal entity and full-Group level. The Group paid $31,250 , driven primarily by the purchase of long-dated puts that
increased the value of the Group’s derivative position by an equal amount, and were required under the ABS V indenture.
Under the ABS VI financing, the Group paid $32,242 from the proceeds of the financing to increase the value of certain pre-
existing derivative contracts that were novated to the ABS VI legal entity at closing. The Group recorded the payments as new
derivative financial instruments in its Consolidated Statement of Financial Position.
Refer to Note 21 for additional information regarding ABS financing arrangements.
Other commodity derivative contract modifications made during the normal course of business for the year ended December
31, 2022 totaled $133,573 which the Group recorded in its Consolidated Statement of Financial Position. As these modifications
were made in the normal course, the Group has presented these as an operating activity in the Consolidated Statement of
Cash Flows. These modifications were primarily associated with elevating the Group’s weighted average hedge floor to take
advantage of the high price environment experienced in 2022 over a longer term. The trades were primarily comprised of
swap enhancements and the extinguishment of standalone call options.
In August 2021 as part of the Tanos acquisition, the Group obtained the option to novate or extinguish the Tanos hedge book.
In conjunction with the closing settlement, DEC elected to extinguish their share of the Tanos hedge book. The cost to
terminate was $52,666 . This payment relieved the termination liability established on the Group’s Consolidated Statement of
Financial Position in purchase accounting and has been presented as an investing activity in the Consolidated Statement of
Cash Flows given its connection to the Tanos acquisition. New derivative contracts were subsequently entered into for more
favorable pricing in order to secure the cash flows associated with these producing assets in an elevated price environment.
In May 2021, subsequent to the close of the Indigo acquisition, market dynamics began shifting to a more favorable commodity
price environment. Given the favorable forward curve, the Group elected to early terminate certain legacy Indigo derivative
positions resulting in a cash payment of $6,797 which the Group recorded in its Consolidated Statement of Financial Position.
Since this extinguishment occurred subsequent to the acquisition date the Group has presented this payment as an operating
activity in the Consolidated Statement of Cash Flows. New derivative contracts were subsequently entered into for more
favorable pricing in order to secure the cash flows associated with these producing assets in an elevated price environment.
Refer to Note 5 for additional information regarding acquisitions.
Other commodity derivative contract modifications made during the normal course of business for the year ended December
31, 2021 totaled $3,367 which the Group recorded in its Consolidated Statement of Financial Position. As these modifications
were made in the normal course of business, the Group has presented these as an operating activity in the Consolidated
Statement of Cash Flows.
(AMOUNTS IN THOUSANDS, EXCEPT PER SHARE AND PER UNIT DATA)
Trade receivables include amounts due from customers, entities that purchase the Group’s natural gas, NGLs and oil
production, and also include amounts due from joint interest owners, entities that own a working interest in the properties
operated by the Group. The majority of trade receivables are current, and the Group believes these receivables are collectible.
periods presented:
December 31, 2023 |
December 31, 2022 |
|
Commodity receivables(a)
|
$ |
$ |
Other receivables(b)
|
||
Total trade receivables |
$ |
$ |
Allowance for credit losses(c)
|
( |
( |
Total trade receivables, net |
$ |
$ |
(a)Includes trade receivables and accrued revenues. The decrease in commodity receivables primarily reflects the decrease in commodity
pricing over the course of 2023.
(b)Other receivables consist primarily of joint interest receivables in 2023 and 2022.
(c)The allowance for credit losses is primarily related to amounts due from joint interest owners. Year-over-year increases is primarily due to
the declining commodity pricing environment during the year.
(AMOUNTS IN THOUSANDS, EXCEPT PER SHARE AND PER UNIT DATA)
December 31, 2023 |
December 31, 2022 |
|
Other non-current assets |
||
Other non-current assets(a)
|
$ |
$ |
Total other non-current assets |
$ |
$ |
Other current assets |
||
Prepaid expenses |
$ |
$ |
Inventory |
||
Total other current assets |
$ |
$ |
(a)Includes the Group’s investment in DP Lion Equity Holdco LLC of $7,500 as of December 31, 2023. Refer to Notes 5 and 21 for additional
information regarding the DP Lion Equity Holdco LLC equity sale.
(AMOUNTS IN THOUSANDS, EXCEPT PER SHARE AND PER UNIT DATA)
The Company has one class of common shares which carry the right to one vote at annual general meetings of the Group. As
of December 31, 2023, the Group had no limit on the amount of authorized share capital and all shares in issue were fully paid.
Effective December 5, 2023, the Company executed a 20-for-1 consolidation of its outstanding shares. The Company’s issued
share capital has been retrospectively adjusted for all reporting periods.
Share capital represents the nominal (par) value of shares (£0.20) that have been issued. Share premium includes any
premiums received on issue of share capital above par. Any transaction costs associated with the issuance of shares are
deducted from share premium, net of any related income tax benefits. The components of share capital include:
Issuance of Share Capital
In February 2023, the Group placed 6,422 new shares at $25.34 per share (£21.00 ) to raise gross proceeds of $162,757
(approximately £134,866 ). Associated costs of the placing were $5,969 . The Group used the proceeds to fund the Tanos II
transaction, discussed in Note 5.
In 2022, there were no issuances of share capital for purposes other than share-based compensation awards issued at par
which were insignificant for the period.
In May 2021, the Group placed 7,077 new shares at $31.80 per share (£22.40 ) to raise gross proceeds of $225,050
(approximately £158,526 ). Associated costs of the placing were $11,206 . The Group used the proceeds to pay down the Credit
Facility and partially fund the Indigo and Blackbeard acquisitions, discussed in Notes 21 and 5, respectively.
Treasury Shares
The Group’s holdings in its own equity instruments are classified as treasury shares. The consideration paid, including any
directly attributable incremental costs, is deducted from the stockholders’ equity of the Group until the shares are cancelled or
reissued. No gain or loss is recognized in the income statement on the purchase, sale, issue or cancellation of treasury shares.
EMPLOYEE BENEFIT TRUST (“EBT”)
In March 2022, the Group established the EBT for the benefit of the employees of the Group. The Group funds the EBT to
facilitate the acquisition of shares. The shares in the EBT are held to satisfy awards and grants under the Group’s 2017 Equity
Incentive Plan and the Employee Share Purchase Plan (the “ESPP”). Shares held in the EBT are accounted for in the same
manner as treasury shares and are therefore included in the Consolidated Financial Statement as treasury shares.
During the year ended December 31, 2023, the EBT issued 334 shares to settle vested share-based awards and ESPP
purchases. No shares were purchased by the EBT during the year ended December 31, 2023. During the year ended
December 31, 2022, the EBT purchased 790 shares at an average price per share of $29.04 (approximately £24.56 ) for a total
consideration of $22,931 (approximately £19,388 ). During the year ended December 31, 2022, the EBT issued 88 to settle
vested share-based awards. As of December 31, 2023, the EBT held 367 shares. Refer to Note 17 for additional information
related to share-based compensation.
REPURCHASE OF SHARES
During the year ended December 31, 2023, the Group repurchased 647 treasury shares at an average price of $17.08 totaling
$11,048 , representing 1 % of issued share capital as of December 31, 2023. During the year ended December 31, 2022, the Group
repurchased 400 treasury shares at an average price of $29.42 totaling $11,760 , representing 1 % of issued share capital as of
December 31, 2022.
The Group has accounted for the repurchase of these shares as a reduction to the treasury reserve. All repurchased treasury
shares were cancelled upon repurchase and as of December 31, 2023 and 2022, their par value of $161 and $80 , respectively,
was retired into the capital redemption reserve included within share based payments and other reserves in the Consolidated
Statement of Financial Position.
SETTLEMENT OF WARRANTS
In July 2022, the Group entered into an agreement to cancel 7 warrants (the "Warrants") held by certain former Mirabaud
Securities Limited ("Mirabaud") employees for an aggregate principal amount of approximately $56 (approximately £46 ). The
former employees surrendered the Warrants to the Group for cancellation. Concurrently, the Group entered into an agreement
to exercise 11 Warrants held by certain former Mirabaud employees for an aggregate principal amount of approximately $201
(approximately £166 ). The former employees surrendered the Warrants to the Group for cancellation in exchange for an
equivalent number of shares of common stock. Following this purchase and exercise, no warrants remain outstanding.
In February 2022, the Group entered into an agreement to cancel 24 Warrants held by certain former Mirabaud Securities
Limited ("Mirabaud") employees for an aggregate principal amount of approximately $265 (approximately £196 ). The former
employees surrendered the Warrants to the Group for cancellation. Concurrently, the Group entered into an agreement to
exercise 15 Warrants held by certain former Mirabaud employees for an aggregate principal amount of approximately $251
(approximately £187 ). The former employees surrendered the Warrants to the Group for cancellation in exchange for an
equivalent number of shares of common stock. Following this purchase and exercise, 18 warrants remained outstanding.
In January 2021, the Group entered into an agreement to cancel 119 Warrants held by Mirabaud and certain former Mirabaud
employees for an aggregate principal amount of approximately $1,429 (approximately £1,040 ). Mirabaud and its former
employees surrendered the Warrants to the Group for cancellation. Following this purchase, 57 warrants
remained outstanding.
Number of Shares |
Total Share Capital |
Total Share Premium |
|
Balance as of December 31, 2020 |
$ |
$ |
|
Issuance of share capital (equity placement) |
|||
Issuance of share capital (equity compensation) |
|||
Balance as of December 31, 2021 |
$ |
$ |
|
Issuance of share capital (settlement of warrants) |
|||
Issuance of share capital (equity compensation) |
|||
Issuance of EBT shares (equity compensation) |
|||
Repurchase of shares (EBT) |
( |
||
Repurchase of shares (share buyback program) |
( |
( |
|
Balance as of December 31, 2022 |
$ |
$ |
|
Issuance of share capital (equity placement) |
|||
Issuance of EBT shares (equity compensation) |
|||
Repurchase of shares (share buyback program) |
( |
( |
|
Balance as of December 31, 2023 |
(AMOUNTS IN THOUSANDS, EXCEPT PER SHARE AND PER UNIT DATA)
The 2017 Equity Incentive Plan (the “Plan”), as amended through April 27, 2021, authorized and reserved for issuance 3,284
shares of common stock, which may be issued upon exercise of vested Options or the vesting of RSUs, PSUs and dividend
equivalent units (“DEUs”) that are granted under the Plan. As of December 31, 2023, 1,648 shares have vested and been issued
to Plan participants, 1,141 shares have been granted but remain unvested and 238 DEUs have accrued and remain unvested. As
of December 31, 2022, 595 shares had vested and been issued to Plan participants, 1,283 shares had been granted but
remained unvested and 212 DEUs had accrued and remained unvested. Refer to the Remuneration Committee’s Report within
this Annual Report & Form 20-F for additional information regarding the terms of awards issued under the Plan.
Effective December 5, 2023, the Company executed a 20-for-1 consolidation of its outstanding shares. The Group’s share-
based payment awards have been retroactively adjusted for all reporting periods.
The following table summarizes Options award activity for the respective periods presented:
Number of Options(a)
|
Weighted Average
Grant Date Fair
Value per Share
|
|
Balance as of December 31, 2020 |
$ |
|
Granted |
||
Exercised(b)
|
( |
|
Forfeited |
( |
|
Balance as of December 31, 2021 |
$ |
|
Granted |
||
Exercised(b)
|
( |
|
Forfeited |
( |
|
Balance as of December 31, 2022 |
$ |
|
Granted |
||
Exercised(b)
|
( |
|
Forfeited |
( |
|
Balance as of December 31, 2023 |
$ |
(a)As of December 31, 2023, 2022 and 2021, 162 , 19 and 202 Options were exercisable, respectively. As of December 31, 2023 all remaining
Options outstanding have an exercise price ranging from £16.80 to £24.00 and a weighted average remaining contractual life of 4.6 years.
(b)The weighted average exercise date share price was $24.29 , $32.35 and $34.80 for Options exercised during 2023, 2022 and 2021,
respectively.
The Group’s Options ratably vest over a three-year period and contain both performance and service metrics. The
performance metrics include Adjusted EPS as compared to pre-established benchmarks and a calculation that compares the
Group’s TSR to pre-established benchmarks. The number of units that will vest can range between 0 % and 100 % of the award.
The fair value of the Group’s Options was calculated using the Black-Scholes model as of the grant date and is uniformly
expensed over the vesting period. No Options were awarded during the years ended December 31, 2023, 2022 and 2021.
Number of Shares |
Weighted Average
Grant Date Fair Value
per Share
|
|
Balance as of December 31, 2020 |
$ |
|
Granted |
||
Vested |
( |
|
Forfeited |
( |
|
Balance as of December 31, 2021 |
$ |
|
Granted |
||
Vested |
( |
|
Forfeited |
( |
|
Balance as of December 31, 2022 |
$ |
|
Granted |
||
Vested |
( |
|
Forfeited |
( |
|
Balance as of December 31, 2023 |
$ |
RSUs cliff- or ratably-vest based on service conditions. The fair value of the Group’s RSUs is determined using the stock price
at the grant date and uniformly expensed over the vesting period.
Number of Shares |
Weighted Average
Grant Date Fair Value
per Share
|
|
Balance as of December 31, 2020 |
$ |
|
Granted |
||
Vested |
||
Forfeited |
( |
|
Balance as of December 31, 2021 |
$ |
|
Granted |
||
Vested |
||
Forfeited |
( |
|
Balance as of December 31, 2022 |
$ |
|
Granted |
||
Vested |
( |
|
Forfeited |
( |
|
Balance as of December 31, 2023 |
$ |
PSUs cliff-vest based on performance criteria which include a three-year average adjusted return on equity as compared to
pre-established benchmarks, a calculation that compares the Group’s TSR to pre-established benchmarks as well as the same
calculated return for a group of peer companies as selected by the Group, and methane intensity reduction over three years.
The number of units that will vest can range between 0 % and 100 % of the award.
The fair value of the Group’s PSUs is calculated using a Monte Carlo simulation model as of the grant date and is uniformly
expensed over the vesting period. The inputs to the Monte Carlo model included the following for PSUs granted during the
respective periods presented:
December 31, 2023 |
December 31, 2022 |
December 31, 2021 |
|
Risk-free rate of interest |
|||
Volatility(a)
|
|||
Correlation with comparator group range |
(a)Volatility utilizes the historical volatility for the Group’s share price.
The Employee Stock Purchase Plan (the “ESPP”), implemented in February 2023, authorized and reserved for issuance 300
shares of common stock. As of December 31, 2023, 15 shares have been purchased by and issued to ESPP participants, and
December 31, 2023 |
December 31, 2022 |
December 31, 2021 |
|
Options |
$ |
$( |
$ |
RSUs |
|||
PSUs |
|||
ESPP |
|||
Total share-based compensation expense |
$ |
$ |
$ |
(AMOUNTS IN THOUSANDS, EXCEPT PER SHARE AND PER UNIT DATA)
Effective December 5, 2023, the Company executed a 20-for-1 consolidation of its outstanding shares. Prices per share and
shares outstanding have been retroactively adjusted for all reporting periods.
Dividend per Share |
Record Date |
Pay Date |
Shares
Outstanding
|
Gross
Dividends
Paid
|
||
Date Dividends Declared |
USD |
GBP |
||||
November 14, 2022 |
$ |
£ |
March 3, 2023 |
March 28, 2023 |
$ |
|
March 21, 2023 |
$ |
£ |
May 26, 2023 |
June 30, 2023 |
||
May 9, 2023 |
$ |
£ |
September 1, 2023 |
September 29, 2023 |
||
September 1, 2023 |
$ |
£ |
December 1, 2023 |
December 29, 2023 |
||
Paid during the year ended December 31, 2023 |
$ |
|||||
October 28, 2021 |
$ |
£ |
March 4, 2022 |
March 28, 2022 |
$ |
|
March 22, 2022 |
$ |
£ |
May 27, 2022 |
June 30, 2022 |
||
May 16, 2022 |
$ |
£ |
September 2, 2022 |
September 26, 2022 |
||
August 8, 2022 |
$ |
£ |
November 25, 2022 |
December 28, 2022 |
||
Paid during the year ended December 31, 2022 |
$ |
|||||
October 29, 2020 |
$ |
£ |
March 5, 2021 |
March 26, 2021 |
$ |
|
March 8, 2021 |
$ |
£ |
May 28, 2021 |
June 24, 2021 |
||
April 30, 2021 |
$ |
£ |
September 3, 2021 |
September 24, 2021 |
||
August 5, 2021 |
$ |
£ |
November 26, 2021 |
December 17, 2021 |
||
Paid during the year ended December 31, 2021 |
$ |
|||||
On November 15, 2023 the Group proposed a dividend of $0.8750 per share. The dividend will be paid on March 28, 2024 to
shareholders on the register on March 1, 2024. This dividend was not approved by shareholders, thereby qualifying it as an
“interim” dividend. No liability was recorded in the Group Financial Statements in respect of this interim dividend as of
December 31, 2023.
Dividends are waived on shares held in the EBT.
On March 19, 2024 the Directors recommended a dividend of $0.29 per share. The dividend will be subject to shareholder
approval at the AGM. Provided this dividend was not approved by shareholders as of the reporting date, this represents an
“interim” dividend. No liability has been recorded in the Group Financial Statements in respect of this dividend as of
December 31, 2023.
(AMOUNTS IN THOUSANDS, EXCEPT PER SHARE AND PER UNIT DATA)
The Group records a liability for the present value of the estimated future decommissioning costs on its natural gas and oil
properties, Although productive life varies within our well portfolio, presently we expect all of our existing wells to have
reached the end of their productive lives and be retired by approximately 2095, consistent with our reserve calculations which
were independently evaluated by third-party engineers. The Group also records a liability for the future cost of
decommissioning its production facilities and pipelines when required by contract, statute, or constructive obligation. No state
contractual agreements or statutes for production facilities and pipelines would impose material obligations on the Group for
the years ended December 31, 2023, 2022 and 2021.
In estimating the present value of future decommissioning costs of natural gas and oil properties the Group takes into account
the number and state jurisdictions of wells, current costs to decommission by state and well type, and the Group’s retirement
plan which is based on state requirements and the Group’s retirement capacity over the producing lives of the Group’s well
portfolio. The Directors’ assumptions are based on the current economic environment and represent what the Directors
believe is a reasonable basis upon which to estimate the future liability. However, actual decommissioning costs will ultimately
depend upon future market prices at the time the decommissioning services are performed. Furthermore, the timing of
decommissioning will vary depending on when the fields cease to produce economically, making the determination dependent
upon future natural gas and oil prices, which are inherently uncertain.
The Group applies a contingency allowance for annual inflationary cost increases to its current cost expectations then
discounts the resulting cash flows using a credit adjusted risk free discount rate. The inflationary adjustment is a U.S. long-term
10-year rate sourced from consensus economics. When determining the discount rate of the liability, the Group evaluates
treasury rates as well as the Bloomberg 15-year U.S. Energy BB and BBB bond index which economically aligns with the
underlying long-term and unsecured liability. Based on this evaluation the net discount rate used in the calculation of the
decommissioning liability in 2023, 2022 and 2021 was 3.4 %, 3.6 % and 2.9 %, respectively.
periods presented:
Year Ended |
|||
December 31, 2023 |
December 31, 2022 |
December 31, 2021 |
|
Balance at beginning of period |
$ |
$ |
$ |
Additions(a)
|
|||
Accretion |
|||
Asset retirement costs |
( |
( |
( |
Disposals(b)
|
( |
( |
( |
Revisions to estimate(c)
|
( |
||
Balance at end of period |
$ |
$ |
$ |
Less: Current asset retirement obligations |
|||
Non-current asset retirement obligations |
$ |
$ |
$ |
(a)Refer to Note 5 for additional information regarding acquisitions and divestitures.
(b)Associated with the divestiture of natural gas and oil properties. Refer to Note 10 for additional information.
(c)As of December 31, 2023, we performed normal revisions to our asset retirement obligations, which resulted in a $42,650 increase in the
liability. This increase was comprised of a $27,830 increase attributable to a lower discount rate as a result of slightly decreased bond yields
as compared to 2022 as inflation began to increase at a lower rate and a $16,059 increase for cost revisions based on our recent asset
retirement experiences. Partially offsetting this increase was a $1,239 change attributed to retirement timing. As of December 31, 2022, the
Group performed normal revisions to its asset retirement obligations, which resulted in a $98,802 decrease in the liability. This decrease was
comprised of a $144,656 decrease attributable to a higher discount rate. The higher discount rate was a result of macroeconomic factors
spurred by the increase in bond yields which have elevated with U.S. treasuries to combat the current inflationary environment. Partially
offsetting this decrease was $29,357 in cost revisions based on the Group’s recent asset retirement experiences and a $16,497 timing
revision for the acceleration of the Group’s retirement plans made possible by asset retirement acquisitions that improved the Group’s asset
retirement capacity through the growth of its operational capabilities. As of December 31, 2021, the Group performed normal revisions to its
asset retirement obligations, which resulted in a $78,156 increase in the liability. This increase was comprised of a $109,306 increase
attributable to the lower discount rate which was then offset by a $27,038 decrease for cost revisions based on our recent asset retirement
experiences. The remaining change was attributable to timing. The lower discount rate was a result of macroeconomic factors spurred by
the COVID-19 recovery, which reduced bond yields and increased inflation. Cost reductions are a result of our recent asset retirement
Changes to assumptions for the estimation of the Group’s asset retirement obligations could result in a material change in the
carrying value of the liability. A reasonably possible change in assumptions could have the following impact on the Group’s
asset retirement obligations as of December 31, 2023:
ARO Sensitivity |
Scenario 1(a)
|
Scenario 2(b)
|
Discount rate |
$( |
$ |
Timing |
( |
|
Cost |
( |
(a)Scenario 1 assumes an increase of the BBB 15 year discount rate to approximately 7% (which is one of the highest rates observed since
2020), a 10% increase in cost and a 10% increase in timing by assuming the addition of one plugging rig, which would accelerate retirement
plans. All of these scenarios have been either historically observed or are considered reasonably possible.
(b)Scenario 2 assumes a decrease of the BBB 15 year discount rate to approximately 3% (which is one of the lowest rates observed since 2020),
a 10% decrease in cost and a 10% decrease in timing by assuming the loss of one plugging rig, which would delay retirement plans. All of
these scenarios have been either historically observed or are considered reasonably possible.
(AMOUNTS IN THOUSANDS, EXCEPT PER SHARE AND PER UNIT DATA)
from financing activities and the balance sheet classification of future minimum lease payments as of the reporting periods
presented were as follows:
Present Value of
Minimum Lease Payments
|
|||
December 31, 2023 |
December 31, 2022 |
December 31, 2021 |
|
Balance at beginning of period |
$ |
$ |
$ |
Additions(a)
|
|||
Interest expense(b)
|
|||
Cash outflows |
( |
( |
( |
Balance at end of period |
$ |
$ |
$ |
Classified as: |
|||
Current liability |
$ |
$ |
$ |
Non-current liability |
|||
Total |
$ |
$ |
$ |
(a)The $14,430 and $11,269 in lease additions during the years ended December 31, 2023 and December 31, 2022, respectively, was primarily
attributable to the expansion of the Group’s fleet due to continued growth. Of the $16,482 in lease additions during the year ended
December 31, 2021, $8,062
regarding acquisitions.
(b)Included as a component of finance cost.
Right-of-Use Assets |
|||
December 31, 2023 |
December 31, 2022 |
December 31, 2021 |
|
Balance at beginning of period |
$ |
$ |
$ |
Additions(a)
|
|||
Depreciation |
( |
( |
( |
Balance at end of period |
$ |
$ |
$ |
Classified as: |
|||
Motor vehicles |
$ |
$ |
$ |
Midstream |
|||
Buildings and leasehold improvements |
|||
Total |
$ |
$ |
$ |
(a)The $13,279 and $11,295 in lease additions during the years ended December 31, 2023 and December 31, 2022, respectively, was attributable
to the expansion of the Group’s fleet due to continued growth. Of the $16,554 in lease additions during the year ended December 31, 2021,
$8,062
acquisitions.
is presented below:
December 31, 2023 |
December 31, 2022 |
December 31, 2021 |
|
Discount rates range |
Expenses related to short-term and low-value lease exemptions applied under IFRS 16 are primarily associated with short term
compressor rentals and were $30,024 , $25,153 and $15,362 for the years ended December 31, 2023 and 2022 and 2021,
respectively. These amounts have been included in the Group’s operating expenses and are primarily concentrated in LOE.
December 31, 2023 |
December 31, 2022 |
December 31, 2021 |
|
Not Later Than One Year |
$ |
$ |
$ |
Later Than One Year and Not Later Than Five Years |
|||
Later Than Five Years |
|||
Total |
$ |
$ |
$ |
(AMOUNTS IN THOUSANDS, EXCEPT PER SHARE AND PER UNIT DATA)
December 31, 2023 |
December 31, 2022 |
|
Credit Facility (Interest rate of |
$ |
$ |
ABS I Notes (Interest rate of |
||
ABS II Notes (Interest rate of |
||
ABS III Notes (Interest rate of |
||
ABS IV Notes (Interest rate of |
||
ABS V Notes (Interest rate of |
||
ABS VI Notes (Interest rate of |
||
Term Loan I (Interest rate of |
||
Miscellaneous, primarily for real estate, vehicles and equipment |
||
Total borrowings |
$ |
$ |
Less: Current portion of long-term debt |
( |
( |
Less: Deferred financing costs |
( |
( |
Less: Original issue discounts |
( |
( |
Total non-current borrowings, net |
$ |
$ |
(a)Represents the variable interest rate as of period end.
The Group maintains a revolving loan facility (the “Credit Facility”) with a lending syndicate, the borrowing base for which is
redetermined on a semi-annual, or as needed, basis. The Group’s wholly-owned subsidiary, DP RBL Co LLC, is the borrower
under the Credit Facility. The borrowing base is primarily a function of the value of the natural gas and oil properties that
collateralize the lending arrangement and will fluctuate with changes in collateral, which may occur as a result of acquisitions
or through the establishment of ABS, term loan or other lending structures that result in changes to the collateral base.
In August 2022, the Group amended and restated the credit agreement governing its Credit Facility. The amendment
enhanced the alignment with the Group’s stated ESG initiatives by including sustainability performance targets (“SPTs”) similar
to those included in the ABS III, IV, V and VI notes, extended the maturity of the Credit Facility to August 2026. In September
2023, the Group performed its semi-annual redetermination and the borrowing base was resized to $435,000 . In November
2023, the borrowing base was resized to $305,000 to reflect the movement of collateral for the issuance of the ABS VII Notes.
Refer to Note 5 for additional information regarding the ABS VII transaction.
The Credit Facility has an interest rate of SOFR plus an additional spread that ranges from 2.75 % to 3.75 % based on utilization.
Interest payments on the Credit Facility are paid on a monthly basis. Available borrowings under the Credit Facility were
$134,817 as of December 31, 2023 which includes the impact of $11,183 in letters of credit issued to certain vendors.
The Credit Facility contains certain customary representations and warranties and affirmative and negative covenants,
including covenants relating to: maintenance of books and records; financial reporting and notification; compliance with laws;
maintenance of properties and insurance; and limitations on incurrence of indebtedness, liens, fundamental changes,
international operations, asset sales, making certain debt payments and amendments, restrictive agreements, investments,
restricted payments and hedging. The restricted payment provision governs the Group’s ability to make discretionary
payments such as dividends, share repurchases, or other discretionary payments. DP RBL Co LLC must comply with the
following restricted payments test in order to make discretionary payments (i) leverage is less than 1.5 x and borrowing base
availability is >25 % (ii) leverage is between 1.5 x and 2.0 x, free cash flow must be positive and borrowing base availability must
be >15 % (iii) leverage is between 2.0 x and 2.5 x, free cash flow must be positive and borrowing base availability must be >20 %
(iv) when leverage exceeds 2.5 x for DP RBL Co LLC, restricted payments are prohibited.
Additional covenants require DP RBL Co LLC to maintain a ratio of total debt to EBITDAX of not more than 3.25 to 1.00 and a
ratio of current assets (with certain adjustments) to current liabilities of not less than 1.00 to 1.00 as of the last day of each
fiscal quarter. The fair value of the Credit Facility approximates the carrying value as of December 31, 2023.
In May 2020, the Group acquired DP Bluegrass LLC (“Bluegrass”), a limited-purpose, bankruptcy-remote, wholly owned
subsidiary, to enter into a securitized financing agreement for $160,000 , which was structured as a secured term loan. The
Group issued the Term Loan I at a 1 % discount and used the proceeds of $158,400 to fund the 2020 Carbon and EQT
acquisitions. The Term Loan I is secured by certain producing assets acquired in connection with the Carbon and EQT
acquisitions.
The Term Loan I accrues interest at a stated 6.50 % annual rate and has a maturity date of May 2030. Interest and principal
payments on the Term Loan I are payable on a monthly basis. During the years ended December 31, 2023, 2022 and 2021, the
Group incurred $7,573 , $8,643 and $9,860 in interest related to the Term Loan I, respectively. The fair value of the Term Loan I
is approximately $101,706 as of December 31, 2023.
In November 2019, the Group formed Diversified ABS LLC (“ABS I”), a limited-purpose, bankruptcy-remote, wholly-owned
subsidiary, to issue BBB- rated asset-backed securities for an aggregate principal amount of $200,000 at par. The ABS I Notes
are secured by certain of the Group’s upstream producing Appalachian assets. Natural gas production associated with these
assets was hedged at 85 % at the close of the agreement with long-term derivative contracts.
Interest and principal payments on the ABS I Notes are payable on a monthly basis. During the years ended December 31,
2023, 2022 and 2021, the Group incurred $5,660 , $7,110 and $8,460 of interest related to the ABS I Notes, respectively. The
legal final maturity date is January 2037 with an amortizing maturity of December 2029. The ABS I Notes accrue interest at a
stated 5 % rate per annum. The fair value of the ABS I Notes is approximately $94,517 as of December 31, 2023.
In the event that ABS I has cash flow in excess of the required payments, ABS I is required to pay between 50 % to 100 % of the
excess cash flow, contingent on certain performance metrics, as additional principal, with the remaining excess cash flow, if
any, remaining with the Group. In particular, (a) with respect to any payment date prior to March 1, 2030, (i) if the debt service
coverage ratio (the “DSCR”) as of such payment date is greater than or equal to 1.25 to 1.00, then 25 %, (ii) if the DSCR as of
such payment date is less than 1.25 to 1.00 but greater than or equal to 1.15 to 1.00, then 50 %, and (iii) if the DSCR as of such
payment date is less than 1.15 to 1.00, the production tracking rate for ABS I is less than 80 %, or the loan to value ratio is
greater than 85 %, then 100 %, and (b) with respect to any payment date on or after March 1, 2030, 100 %. During the year ended
December 31, 2023, the Group paid $7,892 in excess cash flow payments on the ABS I Notes.
In April 2020, the Group formed Diversified ABS Phase II LLC (“ABS II”), a limited-purpose, bankruptcy-remote, wholly owned
subsidiary, to issue BBB- rated asset-backed securities for an aggregate principal amount of $200,000 . The ABS II Notes were
issued at a 2.775 % discount. The Group used the proceeds of $183,617 , net of discount, capital reserve requirement, and debt
issuance costs, to pay down its Credit Facility. The ABS II Notes are secured by certain of the Group’s upstream producing
Appalachian assets. Natural gas production associated with these assets was hedged at 85 % at the close of the agreement
with long-term derivative contracts.
The ABS II Notes accrue interest at a stated 5.25 % rate per annum and have a maturity date of July 2037 with an amortizing
maturity of September 2028. Interest and principal payments on the ABS II Notes are payable on a monthly basis. During the
years ended December 31, 2023, 2022 and 2021, the Group incurred $8,040 , $9,286 and $10,530 in interest related to the ABS
II Notes, respectively. The fair value of the ABS II Notes is approximately $119,519 as of December 31, 2023.
In the event that ABS II has cash flow in excess of the required payments, ABS II is required to pay between 50 % to 100 % of
the excess cash flow, contingent on certain performance metrics, as additional principal, with the remaining excess cash flow, if
any, remaining with the Group. In particular, (a) (i) if the DSCR as of any payment date is less than 1.15 to 1.00, then 100 %, (ii) if
the DSCR as of such payment date is greater than or equal to 1.15 to 1.00 and less than 1.25 to 1.00, then 50 %, or (iii) if the
DSCR as of such payment date is greater than or equal to 1.25 to 1.00, then 0 %; (b) if the production tracking rate for ABS II is
less than 80.0 %, then 100 %, else 0 %; (c) if the loan-to-value ratio (“LTV”) as of such payment date is greater than 65.0 %, then
and ABS II has executed hedging agreements for a minimum period of 30 months starting July 2026 covering production
volumes of at least 85 % but no more than 95 % (the “Extended Hedging Condition”), then 50 %, else 0 %; (e) with respect to any
payment date after July 1, 2025 and prior to October 1, 2025, if LTV is greater than 40.0 % or ABS II has not satisfied the
Extended Hedging Condition, then 50 %, else 0 %; and (f) with respect to any payment date after October 1, 2025, if LTV is
greater than 40.0 % or ABS II has not satisfied the Extended Hedging Condition, then 100 %, else 0 %. During the year ended
December 31, 2023, the Group made no excess cash flow payments on the ABS II Notes.
In February 2022, the Group formed Diversified ABS III LLC (“ABS III”), a limited-purpose, bankruptcy-remote, wholly-owned
subsidiary, to issue BBB rated asset-backed securities for an aggregate principal amount of $365,000 at par. The ABS III Notes
are secured by certain of the Group’s upstream producing, as well as certain midstream, Appalachian assets.
The ABS III Notes accrue interest at a stated 4.875 % rate per annum and have a final maturity date of April 2039 with an
amortizing maturity of November 2030. Interest and principal payments on the ABS III Notes are payable on a monthly basis.
During the years ended December 31, 2023 and 2022, the Group incurred $14,515 and $15,325 in interest related to the ABS III
Notes, respectively. The fair value of the ABS III Notes is approximately $250,158 as of December 31, 2023.
In the event that ABS III has cash flow in excess of the required payments, ABS III is required to pay between 50 % to 100 % of
the excess cash flow, contingent on certain performance metrics, as additional principal, with the remaining excess cash flow, if
any, remaining with the Group. In particular, (a) (i) if the DSCR as of any payment date is greater than or equal to 1.25 to 1.00,
then 0 %, (ii) if the DSCR as of such payment date is less than 1.25 to 1.00 but greater than or equal to 1.15 to 1.00, then 50 %,
and (iii) if the DSCR as of such Payment Date is less than 1.15 to 1.00, then 100 %; (b) if the production tracking rate for ABS III
(as described in the ABS III Indenture) is less than 80 %, then 100 %, else 0 %; and (c) if the LTV for ABS III is greater than 65 %,
then 100 %, else 0 %. During the year ended December 31, 2023, the Group made no excess cash flow payments on the
ABS III Notes.
In February 2022, the Group formed Diversified ABS IV LLC (“ABS IV”), a limited-purpose, bankruptcy-remote, wholly-owned
subsidiary, to issue BBB rated asset-backed securities for an aggregate principal amount of $160,000 at par. The ABS IV Notes
are secured by a portion of the upstream producing assets acquired in connection with the Blackbeard Acquisition.
The ABS IV Notes accrue interest at a stated 4.95 % rate per annum and have a final maturity date of February 2037 with an
amortizing maturity of September 2030. Interest and principal payments on the ABS IV Notes are payable on a monthly basis.
During the year ended December 31, 2023 and 2022, the Group incurred $5,703 and $6,235 in interest related to the ABS IV
Notes, respectively. The fair value of the ABS IV Notes is approximately $92,345 as of December 31, 2023.
In the event that ABS IV has cash flow in excess of the required payments, ABS IV is required to pay between 50 % to 100 % of
the excess cash flow, contingent on certain performance metrics, as additional principal, with the remaining excess cash flow, if
any, remaining with the Group. In particular, (a) (i) if the DSCR as of any payment date is greater than or equal to 1.25 to 1.00,
then 0 %, (ii) if the DSCR as of such payment date is less than 1.25 to 1.00 but greater than or equal to 1.15 to 1.00, then 50 %,
and (iii) if the DSCR as of such Payment Date is less than 1.15 to 1.00, then 100 %; (b) if the production tracking rate for ABS IV
is less than 80 %, then 100 %, else 0 %; and (c) if the LTV for ABS IV is greater than 65 %, then 100 %, else 0 %. During the year
ended December 31, 2023, the Group made no excess cash flow payments on the ABS IV Notes.
In May 2022, the Group formed Diversified ABS V LLC (“ABS V”), a limited-purpose, bankruptcy-remote, wholly-owned
subsidiary, to issue BBB rated asset-backed securities for an aggregate principal amount of $445,000 at par. The ABS V Notes
are secured by a majority of the Group’s remaining upstream assets in Appalachia that were not securitized by previous
ABS transactions.
The ABS V Notes accrue interest at a stated 5.78 % rate per annum and have a final maturity date of May 2039 with an
amortizing maturity of December 2030. Interest and principal payments on the ABS V Notes are payable on a monthly basis.
During the year ended December 31, 2023 and 2022, the Group incurred $19,332 and $14,319 in interest related to the ABS V
Notes, respectively. The fair value of the ABS V Notes is approximately $274,061 as of December 31, 2023.
Based on whether certain performance metrics are achieved, ABS V is required to apply 50 % to 100 % of any excess cash flow
to make additional principal payments. In particular, (a) (i) if the DSCR as of any payment date is greater than or equal to 1.25
to 1.00, then 0 %, (ii) if the DSCR as of such payment date is less than 1.25 to 1.00 but greater than or equal to 1.15 to 1.00, then
ABS V is less than 80 %, then 100 %, else 0 %; and (c) if the LTV for ABS V is greater than 65 %, then 100 %, else 0 %. During the
year ended December 31, 2023, the Group made no excess cash flow payments on the ABS V Notes.
In October 2022, the Group formed Diversified ABS VI LLC (“ABS VI”), a limited-purpose, bankruptcy-remote, wholly-owned
subsidiary, to issue, jointly with Oaktree, BBB+ rated asset-backed securities for an aggregate principal amount of $460,000
($235,750 to the Group, before fees, representative of its 51.25 % ownership interest in the collateral assets). The ABS VI Notes
were issued at a 2.63 % discount and are secured primarily by the upstream assets that were jointly acquired with Oaktree in
the Tapstone acquisition. The Group recorded its proportionate share of the note in its Consolidated Statement of
Financial Position.
The ABS VI Notes accrue interest at a stated 7.50 % rate per annum and have a final maturity date of November 2039 with an
amortizing maturity of October 2031. Interest and principal payments on the ABS VI Notes are payable on a monthly basis.
During the year ended December 31, 2023 and 2022, the Group incurred $15,433 and $3,300 in interest related to the ABS VI
Notes, respectively. The fair value of the ABS VI Notes is approximately $158,284 as of December 31, 2023.
Based on whether certain performance metrics are achieved, ABS VI is required to apply 50 % to 100 % of any excess cash flow
to make additional principal payments. In particular, (a) (i) If the DSCR as of the applicable Payment Date is less than 1.15 to
1.00, then 100 %, (ii) if the DSCR as of such Payment Date is greater than or equal to 1.15 to 1.00 and less than 1.25 to 1.00, then
rate for ABS VI is less than 80 %, then 100 %, else 0 %; and (c) if the LTV for ABS VI is greater than 75 %, then 100 %, else 0 %.
During the year ended December 31, 2023, the Group made no excess cash flow payments on the ABS VI Notes.
In November 2023, the Group formed DP Lion Equity Holdco LLC, a limited-purpose, bankruptcy-remote, wholly-owned
subsidiary, to issue Class A and Class B asset-backed securities (collectively “ABS VII”) which are secured by certain upstream
producing assets in Appalachia. The Class A Notes are rated BBB+ and were issued for an aggregate principal amount of
$142,000 . The Class B Notes are rated BB- and were issued for an aggregate principal amount of $20,000 .
The ABS VII Class A Notes accrue interest at a stated 8.243 % rate per annum and have a final maturity date of November 2043
with an amortizing maturity of February 2034. The ABS VII Class B Notes accrue interest at a stated 12.725 % rate per annum
and have a final maturity date of November 2043 with an amortizing maturity of August 2032. Interest and principal payments
on the ABS VII Class A and Class B Notes are payable on a monthly basis.
In December 2023, the Group divested 80
generating cash proceeds of $30,000 20 % interest in DP Lion Equity Holdco LLC and
determined that the governance structure is such that the Group does not have the ability to exercise control, joint control, or
significant influence over the DP Lion Equity Holdco LLC entity. Accordingly, this entity is not consolidated within the Group’s
financial statements for the year ended December 31, 2023. The Group’s remaining investment in the LLC of $7,500 is
accounted for at fair value in accordance with IFRS 9, Financial Instruments (“IFRS 9”).
Refer to Note 5 for additional information regarding the DP Lion Equity Holdco LLC equity sale.
Term Loan I
The ABS Notes and Term Loan I are subject to a series of covenants and restrictions customary for transactions of this type,
including (i) that the Issuer maintains specified reserve accounts to be used to make required interest payments in respect of
the ABS Notes and Term Loan I, (ii) provisions relating to optional and mandatory prepayments and the related payment of
specified amounts, including specified make-whole payments in the case of the ABS Notes and Term Loan I under certain
circumstances, (iii) certain indemnification payments in the event, among other things, that the assets pledged as collateral for
the ABS Notes and Term Loan I are used in stated ways defective or ineffective, (iv) covenants related to recordkeeping,
access to information and similar matters, and (v) the Issuer will comply with all laws and regulations which it is subject to
including ERISA, Environmental Laws, and the USA Patriot Act (ABS III-V only).
The ABS Notes and Term Loan I are also subject to customary accelerated amortization events provided for in the indenture,
including events tied to failure to maintain stated debt service coverage ratios, failure to maintain certain production metrics,
certain change of control and management termination events, and the failure to repay or refinance the ABS Notes and Term
Loan I on the applicable scheduled maturity date.
The ABS Notes and Term Loan I are subject to certain customary events of default, including events relating to non-payment
of required interest, principal, or other amounts due on or with respect to the ABS Notes and Term Loan I, failure to comply
with covenants within certain time frames, certain bankruptcy events, breaches of specified representations and warranties,
failure of security interests to be effective and certain judgments.
As of December 31, 2023 the Group was in compliance with all financial covenants for the ABS Notes, Term Loan I and the
Credit Facility.
CREDIT FACILITY
The Credit Facility contains three sustainability-linked performance targets (“SPTs”) which, depending on the Group’s
performance thereof, may result in adjustments to the applicable margin with respect to borrowings thereunder:
—GHG Emissions Intensity: The Group’s consolidated Scope 1 emissions and Scope 2 emissions, each measured as MT CO2e
per MMcfe;
—Asset Retirement Performance: The number of wells the Group successfully retires during any fiscal year; and
—TRIR Performance: The arithmetic average of the two preceding fiscal years and current period total recordable injury rate
computed as the Total Number of Recordable Cases (as defined by the Occupational Safety and Health Administration)
multiplied by 200,000 and then divided by total hours worked by all employees during any fiscal year.
The goals set by the Credit Facility for each of these categories are aspirational and represent higher thresholds than the
Group has publicly set for itself. The economic repercussions of achieving or failing to achieve these thresholds, however, are
relatively minor, ranging from subtracting five basis points to adding five basis points to the applicable margin level in any
given fiscal year.
An independent third-party assurance provider is required to certify the Group’s performance of the SPTs.
In connection with the issuance of the ABS III & IV notes, the Group retained an independent international provider of
sustainability research and services to provide and maintain a “sustainability score” with respect to Diversified Energy
Company PLC and to the extent such score is below a minimum threshold established at the time of issue of the ABS III & IV
notes, the interest payable with respect to the subsequent interest accrual period will increase by five
is not dependent on the Group meeting or exceeding any sustainability performance metrics but rather an overall assessment
of the Group’s corporate sustainability profile. Further, this score is not dependent on the use of proceeds of the ABS III & IV
notes and there were no such restrictions on the use of proceeds other than pursuant to the terms of the Group’s Credit
Facility. The Group informs the ABS III & IV note holders in monthly note holder statements as to any change in interest rate
payable on the ABS III & IV notes as a result of the change in this sustainability score.
ABS V & VI
In addition, a “second party opinion provider” certified the terms of the ABS V & VI notes as being aligned with the framework
for sustainability-linked bonds of the International Capital Markets Association (“ICMA”), applicable to bond instruments for
which the financial and/or structural characteristics vary depending on whether predefined sustainability objectives, or SPTs,
are achieved. The framework has five
calibration of SPTs, (3) variation of bond characteristics depending on whether the KPIs meet the SPTs, (4) regular reporting
of the status of the KPIs and whether SPTs have been met and (5) independent verification of SPT performance by an external
reviewer such as an auditor or environmental consultant. Unlike the ICMA’s framework for green bonds, its framework for
sustainability-linked bonds does not require a specific use of proceeds.
The ABS V & VI notes contain two
2027 for ABS VI (1) a reduction in Scope 1 and Scope 2 GHG emissions intensity to 2.85
reduction in Scope 1 methane emissions intensity to 1.12
or have certified by an external verifier that it has met, by April 28, 2027 for ABS V and May 28, 2027 for ABS VI, the interest
rate payable with respect to the ABS V & VI notes will be increased by 25
party assurance provider will be required to certify the Group’s performance of the above SPTs by the applicable deadlines.
COMPLIANCE
As of December 31, 2023, the Group met or was in compliance with all sustainability-linked debt metrics.
as follows:
December 31, 2023 |
December 31, 2022 |
|
Not later than one year |
$ |
$ |
Later than one year and not later than five years |
||
Later than five years |
||
Total borrowings |
$ |
$ |
Year Ended |
|||
December 31, 2023 |
December 31, 2022 |
December 31, 2021 |
|
Interest expense, net of capitalized and income amounts(a)
|
$ |
$ |
$ |
Amortization of discount and deferred finance costs |
|||
Other |
|||
Total finance costs |
$ |
$ |
$ |
(a)Includes payments related to borrowings and leases.
Year Ended |
|||
December 31, 2023 |
December 31, 2022 |
December 31, 2021 |
|
Balance at beginning of period |
$ |
$ |
$ |
Acquired as part of a business combination |
|||
Sale of equity interest |
( |
||
Proceeds from borrowings |
|||
Repayments of borrowings |
( |
( |
( |
Costs incurred to secure financing |
( |
( |
( |
Amortization of discount and deferred financing costs |
|||
Cash paid for interest |
( |
( |
( |
Finance costs and other |
|||
Balance at end of period |
$ |
$ |
$ |
(AMOUNTS IN THOUSANDS, EXCEPT PER SHARE AND PER UNIT DATA)
periods presented:
December 31, 2023 |
December 31, 2022 |
|
Trade payables |
$ |
$ |
Other payables |
||
Total trade and other payables |
$ |
$ |
Trade and other payables are unsecured, non-interest bearing and paid as they become due.
(AMOUNTS IN THOUSANDS, EXCEPT PER SHARE AND PER UNIT DATA)
December 31, 2023 |
December 31, 2022 |
|
Other non-current liabilities |
||
Other non-current liabilities |
$ |
$ |
Total other non-current liabilities |
$ |
$ |
Other current liabilities |
||
Accrued expenses(a)
|
$ |
$ |
Net revenue clearing(b)
|
||
Asset retirement obligations - current |
||
Revenue to be distributed(c)
|
||
Total other current liabilities |
$ |
$ |
(a)As of December 31, 2023 accrued expenses decreased primarily due to a $50,541 decrease in hedge settlements payables, resulting from
lower commodity prices throughout 2023. As of December 31, 2022 accrued expenses primarily consisted of $61,896 for hedge settlements
payables, $21,372 for accrued post production expense, $15,127 in accrued payroll and bonus and $10,832 for accrued lease operating
expense. The remaining balance consisted of accrued capital projects and operating expenses. Refer to the Financial Review for more
information on year-over-year changes in other liabilities and their fixed and variable nature.
(b)Net revenue clearing is estimated revenue that is payable to third-party working interest owners. The year-over-year decrease, similar to
commodity receivables, was a result of lower commodity prices year-over-year.
(c)Revenue to be distributed is revenue that is payable to third-party working interest owners, but has yet to be paid due to title, legal,
ownership or other issues. The Group releases the underlying liability as the aforementioned issues become resolved. As the timing of
resolution is unknown, the Group records the balance as a current liability. Revenue to be distributed increased year-over-year as a result of
the Group’s growth.
(AMOUNTS IN THOUSANDS, EXCEPT PER SHARE AND PER UNIT DATA)
Fair Value
The fair value of an asset or liability is the price that would be received to sell that asset or paid to transfer that liability in an
orderly transaction occurring in the principal market (or most advantageous market in the absence of a principal market) for
such asset or liability. In estimating fair value, the Group utilizes valuation techniques that are consistent with the market
approach, the income approach and/or the cost approach. Such valuation techniques are consistently applied. Inputs to
valuation techniques include the assumptions that market participants would use in pricing an asset or liability. IFRS 13, Fair
Value Measurement (“IFRS 13”) establishes a fair value hierarchy for valuation inputs that gives the highest priority to quoted
prices in active markets for identical assets or liabilities and the lowest priority to unobservable inputs. The fair value hierarchy
is defined as follows:
Level 1: |
Inputs are unadjusted, quoted prices in active markets for identical assets at the measurement date. |
||
Level 2: |
Inputs (other than quoted prices included in Level 1) can include the following: |
||
(1)Observable prices in active markets for similar assets;
(2)Prices for identical assets in markets that are not active;
(3)Directly observable market inputs for substantially the full term of the asset; and
(4)Market inputs that are not directly observable but are derived from or corroborated by observable
market data.
Level 3: |
Unobservable inputs which reflect the Directors’ best estimates of what market participants would use in pricing
the asset at the measurement date.
|
||
Financial Instruments
WORKING CAPITAL
The carrying values of cash and cash equivalents, trade receivables, other current assets, accounts payable and other current
liabilities in the Consolidated Statement of Financial Position approximate fair value because of their short-term nature. For
trade receivables, the Group applies the simplified approach permitted by IFRS 9, Financial Instruments (“IFRS 9”), which
requires expected lifetime losses to be recognized from initial recognition of the receivables. Financial liabilities are initially
measured at fair value and subsequently measured at amortized cost.
For borrowings, derivative financial instruments, and leases the following methods and assumptions were used to estimate
fair value:
BORROWINGS
The fair values of the Group’s ABS Notes and Term Loan I are considered to be a Level 2 measurement on the fair value
hierarchy. The carrying values of the borrowings under the Group’s Credit Facility (to the extent utilized) approximates fair
value because the interest rate is variable and reflective of market rates. The Group considers the fair value of its Credit
Facility to be a Level 2 measurement on the fair value hierarchy.
LEASES
The Group initially measures the lease liability at the present value of the future lease payments. The lease payments are
discounted using the interest rate implicit in the lease. When this rate cannot be readily determined, the Group uses its
incremental borrowing rate.
DERIVATIVE FINANCIAL INSTRUMENTS
The Group measures the fair value of its derivative financial instruments based upon a pricing model that utilizes market-based
inputs, including, but not limited to, the contractual price of the underlying position, current market prices, natural gas and
liquids forward curves, discount rates such as the U.S. Treasury yields, SOFR curve, and volatility factors.
The Group has classified its derivative financial instruments into the fair value hierarchy depending upon the data utilized to
determine their fair values. The Group’s fixed price swaps (Level 2) are estimated using third-party discounted cash flow
calculations using the NYMEX futures index for natural gas and oil derivatives and OPIS for NGLs derivatives. The Group
utilizes discounted cash flow models for valuing its interest rate derivatives (Level 2). The net derivative values attributable to
the Group’s interest rate derivative contracts as of December 31, 2023 are based on (i) the contracted notional amounts, (ii)
active market-quoted SOFR yield curves and (iii) the applicable credit-adjusted risk-free rate yield curve.
The Group’s call options, put options, collars and swaptions (Level 2) are valued using the Black-Scholes model, an industry
standard option valuation model that takes into account inputs such as contract terms, including maturity, and market
parameters, including assumptions of the NYMEX and OPIS futures index, interest rates, volatility and credit worthiness. Inputs
to the Black-Scholes model, including the volatility input are obtained from a third-party pricing source, with independent
verification of the most significant inputs on a monthly basis. A change in volatility would result in a change in fair value
measurement, respectively.
The Group’s basis swaps (Level 2) are estimated using third-party calculations based upon forward commodity price curves.
CONTINGENT CONSIDERATION
These liabilities represent the estimated fair value of potential future payments the Group may be required to remit under the
terms of historical purchase agreements entered into for asset acquisitions and business combinations. In instances when the
contingent consideration relates to the acquisition of a group of assets, the Group records changes in the fair value of the
contingent consideration through the basis of the asset acquired rather than through other income (expense) in
the Consolidated Statement of Comprehensive Income as it does for business combinations. During the years ended
December 31, 2023, 2022 and 2021, the Group recorded $0 , $1,036 and $9,482 , respectively, in revaluations related to
contingent consideration associated with asset acquisitions and $0 , $0 and $8,963 , respectively, associated with
business combinations.
The contingent consideration represented in the Group’s financial statements is associated with the 2020 Carbon and EQT
acquisitions. The maximum contingent consideration payment of $15,000 associated with the Carbon acquisition and the
remaining contingent consideration payment of $8,547 associated with the EQT acquisition was made during the year ended
December 31, 2022, settling both contingencies in their entirety.
The Group remeasures the fair value of the contingent consideration at each reporting period. This estimate requires
assumptions to be made, including forecasting the NYMEX Henry Hub natural gas settlement prices relative to stated floor and
target prices in future periods. In determining the fair value of the contingent consideration liability, the Group used the Monte
Carlo simulation model, which considers unobservable input variables, representing a Level 3 measurement. While valued
under this technique, presently there are no remaining contingent payments.
There were no transfers between fair value levels for the year ended December 31, 2023.
December 31, 2023 |
December 31, 2022 |
|
Cash and cash equivalents |
$ |
$ |
Trade receivables and accrued income |
||
Other non-current assets |
||
Other non-current liabilities(a)
|
( |
( |
Other current liabilities(b)
|
( |
( |
Derivative financial instruments at fair value |
( |
( |
Leases |
( |
( |
Borrowings |
( |
( |
Total |
$( |
$( |
(a)Excludes the long-term portion of the value associated with the upfront promote received from Oaktree.
(b)Includes accrued expenses, net revenue clearing and revenue to be distributed. Excludes taxes payable and asset retirement obligations.
(AMOUNTS IN THOUSANDS, EXCEPT PER SHARE AND PER UNIT DATA)
The Group is exposed to a variety of financial risks such as market risk, credit risk, liquidity risk, capital risk and collateral risk.
The Group manages these risks by monitoring the unpredictability of financial markets and seeking to minimize potential
adverse effects on its financial performance on a continuous basis.
The Group’s principal financial liabilities are comprised of borrowings, leases and trade and other payables, used primarily to
finance and financially guarantee its operations. The Group’s principal financial assets include cash and cash equivalents and
trade and other receivables derived from its operations.
The Group also enters into derivative financial instruments which, depending on market dynamics, are recorded as assets or
liabilities. To assist with the design and composition of its hedging program, the Group engages a specialist firm with the
appropriate skills and experience to manage its risk management derivative-related activities.
Market risk is the possibility that the fair value of future cash flows of a financial instrument will fluctuate due to changes in
market prices. Market risk is comprised of two types of risk: interest rate risk and commodity price risk. Financial instruments
affected by market risk include borrowings and derivative financial instruments. Derivative and non-derivative financial
instruments are used to manage market price risks resulting from changes in commodity prices and foreign exchange rates,
which could have a negative effect on assets, liabilities or future expected cash flows.
The Group is subject to market risk exposure related to changes in interest rates. The Group’s borrowings primarily consist of
fixed-rate amortizing notes and its variable rate Credit Facility as illustrated below.
December 31, 2023 |
December 31, 2022 |
|||
Borrowings |
Interest Rate(a)
|
Borrowings |
Interest Rate(a)
|
|
ABS Notes and Term Loan I |
$ |
$ |
||
Credit Facility |
$ |
$ |
||
(a)The interest rate on the ABS Notes and Term Loan I borrowings represents the weighted average fixed-rate of the notes while the interest
rate presented for the Credit Facility represents the floating rate as of December 31, 2023 and 2022, respectively. During the year ended
December 31, 2022, the Credit Facility transitioned from LIBOR to SOFR during the regular redetermination in late Spring 2022. The Group
did not experience a material impact from the transition.
Refer to Note 21 for additional information regarding the ABS Notes, Term Loan I and Credit Facility. The table below
represents the impact of a 100 basis point adjustment in the borrowing rate for the Credit Facility and the corresponding
impact on finance costs. This represents a reasonably possible change in interest rate risk.
Credit Facility Interest Rate Sensitivity |
December 31, 2023 |
December 31, 2022 |
+100 Basis Points |
$ |
$ |
-100 Basis Points |
$( |
$( |
The Group strives to maintain a prudent balance of floating and fixed-rate borrowing exposure, particularly during uncertain
market conditions. As part of the Group’s risk mitigation strategy from time to time the Group enters into swap arrangements
to increase or decrease exposure to floating or fixed- interest rates to account for changes in the composition of borrowings in
its portfolio. As a result, the total principal hedged through the use of derivative financial instruments varies from period to
period. The fair value of the Group’s interest rate swaps represents a liability of $315 and $3,228 as of December 31, 2023 and
2022, respectively. Refer to Note 13 for additional information regarding derivative financial instruments.
The Group’s revenues are primarily derived from the sale of its natural gas, NGLs and oil production, and as such, the Group is
subject to commodity price risk. Commodity prices for natural gas, NGLs and oil can be volatile and can experience
fluctuations as a result of relatively small changes in supply, weather conditions, economic conditions and government actions.
For the years ended December 31, 2023, 2022 and 2021, the Group’s commodity revenue was $802,399 , $1,873,011 and
$973,107 , respectively. The Group enters into derivative financial instruments to mitigate the risk of fluctuations in commodity
prices. The total volumes hedged through the use of derivative financial instruments varies from period to period, but generally
the Group’s objective is to hedge at least 65 % for the next 12 months, at least 50 % in months 13 to 24, and a minimum of 30 %
in months 25 to 36, of its anticipated production volumes. Refer to Note 13 for additional information regarding derivative
financial instruments.
By removing price volatility from a significant portion of the Group’s expected production through 2032, it has mitigated, but
not eliminated, the potential effects of changing prices on its operating cash flow for those periods. While mitigating negative
effects of falling commodity prices, these derivative contracts also limit the benefits the Group would receive from increases in
commodity prices.
The Group is exposed to credit and counterparty risk from the sale of its natural gas, NGLs and oil. Trade receivables from
customers are amounts due for the purchase of natural gas, NGLs and oil. Collectability is dependent on the financial condition
of each customer. The Group reviews the financial condition of customers prior to extending credit and generally does not
require collateral in support of their trade receivables. The Group had no customers that comprised over 10% of its total trade
receivables from customers as of December 31, 2023 and 2022. As of December 31, 2023 and 2022, the Group’s trade
receivables from customers, net of the applicable allowance for credit losses, were $168,913 and $278,030 , respectively.
The Group is also exposed to credit risk from joint interest owners, entities that own a working interest in the properties
operated by the Group. Joint interest receivables are classified in trade receivables, net in the Consolidated Statement of
Financial Position. The Group has the ability to withhold future revenue payments to recover any non-payment of joint interest
receivables. As of December 31, 2023 and 2022, the Group’s joint interest receivables, net of the applicable allowance for
credit losses, were $21,294 and $18,751 , respectively.
Trade receivables are current and the Group believes these net receivables are collectible. Refer to Note 3 for
additional information.
Liquidity risk is the possibility that the Group will not be able to meet its financial obligations as they fall due. The Group
manages this risk by maintaining adequate cash reserves through the use of cash from operations and borrowing capacity on
the Credit Facility. The Group also continuously monitors its forecast and actual cash flows to ensure it maintains an
appropriate amount of liquidity. The amounts disclosed in the following table are the contractual cash flows.
Not Later Than
One Year
|
Later Than
One Year and
Not Later Than
Five Years
|
Later Than
Five Years
|
||
Total |
||||
For the year ended December 31, 2023 |
||||
Trade and other payables |
$ |
$ |
$ |
$ |
Borrowings |
||||
Leases |
||||
Other liabilities(a)
|
||||
Total |
$ |
$ |
$ |
$ |
For the year ended December 31, 2022 |
||||
Trade and other payables |
$ |
$ |
$ |
$ |
Borrowings |
||||
Leases |
||||
Other liabilities(a)
|
||||
Total |
$ |
$ |
$ |
$ |
The Group defines capital as the total of equity shareholders’ funds and long-term borrowings net of available cash balances.
The Group’s objectives when managing capital are to provide returns for shareholders, maintain appropriate leverage and
safeguard the ability to continue as a going concern while pursuing opportunities for growth through identifying and
evaluating potential acquisitions and constructing new infrastructure on existing proved leaseholds. The Directors do not
establish a quantitative return on capital criteria, but rather promote year-over-year adjusted EBITDA growth. The Group seeks
to maintain a leverage target at or under 2.5 x.
As of December 31, 2023, the Group has pledged 100 % of its upstream natural gas and oil properties in the Appalachia and
Central Region, along with certain midstream assets, to fulfill the collateral requirements for borrowings under the ABS Notes,
Term Loan I and Credit Facility. The fair value of the collateral is based on a third-party engineering reserve calculation using
estimated cash flows discounted at 10 % and a commodities futures price schedule. Refer to Notes 5 and 21 for additional
information regarding acquisitions and borrowings, respectively.
(AMOUNTS IN THOUSANDS, EXCEPT PER SHARE AND PER UNIT DATA)
Delivery Commitments
We have contractually agreed to deliver firm quantities of natural gas to various customers, which we expect to fulfill with
production from existing reserves. We regularly monitor our proved developed reserves to ensure sufficient availability to
meet these commitments. The following table summarizes our total gross commitments, compiled using best estimates based
on our sales strategy, as of December 31, 2023.
Natural gas (MMcf) |
|
2024 |
|
2025 |
|
2026 |
|
Thereafter |
Litigation and Regulatory Proceedings
The Group is involved in various pending legal issues that have arisen in the ordinary course of business. The Group accrues for
litigation, claims and proceedings when a liability is both probable and the amount can be reasonably estimated. As of
December 31, 2023 and 2022, the Group did not have any material amounts accrued related to litigation or regulatory matters.
For any matters not accrued for, it is not possible to estimate the amount of any additional loss, or range of loss that is
reasonably possible, but, based on the nature of the claims, management believes that current litigation, claims and
proceedings are not, individually or in aggregate, after considering insurance coverage and indemnification, likely to have a
material adverse impact on the Group’s financial position, results of operations or cash flows.
The Group has no other contingent liabilities that would have a material impact on the Group’s financial position, results of
operations or cash flows.
Environmental Matters
The Group’s operations are subject to environmental regulation in all the jurisdictions in which it operates, and it was in
compliance as of December 31, 2023 and 2022. The Group is unable to predict the effect of additional environmental laws and
regulations which may be adopted in the future, including whether any such laws or regulations would adversely affect its
operations. The Group can offer no assurance regarding the significance or cost of compliance associated with any such new
environmental legislation once implemented.
(AMOUNTS IN THOUSANDS, EXCEPT PER SHARE AND PER UNIT DATA)
The Group had no related party activity in 2023, 2022 or 2021.
(AMOUNTS IN THOUSANDS, EXCEPT PER SHARE AND PER UNIT DATA)
The Group determined the need to disclose the following material transactions that occurred subsequent to December 31,
2023, which have been described within each relevant footnote as follows:
Description |
Footnote |
Acquisitions and Divestitures |
Note 5 |
Dividends |
Note 18 |
SUPPLEMENTAL NATURAL GAS AND
OIL INFORMATION (UNAUDITED)
(AMOUNTS IN THOUSANDS, EXCEPT PER SHARE AND PER UNIT DATA)
Estimated Reserves
The process of estimating quantities of “proved” and “proved developed” reserves is very complex, requiring significant
subjective decisions in the evaluation of all available geological, engineering and economic data for each reservoir. The data
for a given reservoir may also change substantially over time as a result of numerous factors including, but not limited to,
additional development activity, evolving production history and continual reassessment of the viability of production under
varying economic conditions. As a result, revisions to existing reserve estimates may occur from time to time. Although every
reasonable effort is made to ensure that reserve estimates reported represent the most accurate assessments possible, the
subjective decisions and variances in available data for various reservoirs make these estimates generally less precise than
other estimates included in the financial statement disclosures.
For each of the years ended December 31, 2023, 2022 and 2021 in the table below, the estimated proved reserves were
independently evaluated by our independent engineers, NSAI, in accordance with petroleum engineering and evaluation
standards published by the Society of Petroleum Evaluation Engineers and definitions and guidelines established by the SEC.
Accordingly, the following reserve estimates are based upon existing economic and operating conditions. Reserve estimates
are inherently imprecise, and the Group’s reserve estimates are generally based upon extrapolation of historical production
trends, historical prices of natural gas and oil, and analogy to similar properties and volumetric calculations. Accordingly, the
Group’s estimates are expected to change, and such changes could be material and occur in the near term as future
information becomes available.
The following table summarizes the changes in the Group’s net proved reserves for the periods presented, all of which were
located in the U.S.:
Natural Gas |
NGLs |
Oil |
Total |
|
(MMcf) |
(MBbls) |
(MBbls) |
(MMcfe) |
|
December 31, 2020 |
2,860,792 |
60,206 |
4,760 |
3,250,588 |
Revisions of previous estimates(a)
|
498,927 |
4,045 |
3,052 |
541,509 |
Extensions, discoveries and other additions |
— |
— |
— |
— |
Production |
(234,643) |
(3,558) |
(592) |
(259,543) |
Purchase of reserves in place(b)
|
1,019,944 |
32,698 |
7,397 |
1,260,514 |
Sales of reserves in place(c)
|
(135,983) |
(4,311) |
(365) |
(164,039) |
December 31, 2021 |
4,009,037 |
89,080 |
14,252 |
4,629,029 |
Revisions of previous estimates(a)
|
306,696 |
11,694 |
492 |
379,812 |
Extensions, discoveries and other additions |
13,098 |
1 |
37 |
13,326 |
Production |
(255,597) |
(5,200) |
(1,554) |
(296,121) |
Purchase of reserves in place(b)
|
281,345 |
6,356 |
1,927 |
331,043 |
Sales of reserves in place(c)
|
(4,968) |
— |
(324) |
(6,912) |
December 31, 2022 |
4,349,611 |
101,931 |
14,830 |
5,050,177 |
Revisions of previous estimates(a)
|
(658,917) |
153 |
(230) |
(659,379) |
Extensions, discoveries and other additions |
712 |
— |
50 |
1,012 |
Production |
(256,378) |
(5,832) |
(1,377) |
(299,632) |
Purchase of reserves in place(b)
|
105,713 |
2,592 |
923 |
126,803 |
Sales of reserves in place(c)
|
(340,697) |
(3,143) |
(1,580) |
(369,035) |
December 31, 2023 |
3,200,044 |
95,701 |
12,616 |
3,849,946 |
(a)During 2023, commodity market pricing decreased significantly driving a net downward revision of 659,379 MMcfe. During 2022, commodity
market pricing was volatile and increased significantly due to the war between Russia and Ukraine as well as other geopolitical factors. These
factors primarily drove a net upward revision of 386,064 MMcfe due to changes in pricing that impacted well economics. These increases
were then offset in part by a 6,252 MMcfe downward revision for changes in timing. During 2021, commodity market pricing began to
rebound from the COVID-19 pandemic lows driving a net upward revision of 541,509 MMcfe.
(b)During 2023, purchases of reserves in place were primarily related to the Tanos II acquisition. During 2022, purchases of reserves in place
were primarily related to the East Texas Assets and ConocoPhillips acquisitions. During 2021, purchases of reserves in place were primarily
related to the Indigo, Tanos, Blackbeard, and Tapstone acquisitions. Refer to Note 5 for additional information about acquisitions.
(c)During 2023, 2022 and 2021, sales of reserves in place were primarily related to the divestitures of non-core assets. Refer to Note 5 for
additional information about divestitures.
Natural Gas |
NGLs |
Oil |
Total |
|
(MMcf) |
(MBbls) |
(MBbls) |
(MMcfe) |
|
Total proved reserves as of: |
||||
December 31, 2021 |
4,009,037 |
89,080 |
14,252 |
4,629,029 |
December 31, 2022 |
4,349,611 |
101,931 |
14,830 |
5,050,177 |
December 31, 2023 |
3,200,044 |
95,701 |
12,616 |
3,849,946 |
Total proved developed reserves as of: |
||||
December 31, 2021 |
4,008,160 |
89,071 |
13,823 |
4,625,524 |
December 31, 2022 |
4,340,779 |
101,931 |
14,830 |
5,041,345 |
December 31, 2023 |
3,184,499 |
94,391 |
12,380 |
3,825,125 |
Total proved undeveloped reserves as of: |
||||
December 31, 2021 |
877 |
9 |
429 |
3,505 |
December 31, 2022 |
8,832 |
— |
— |
8,832 |
December 31, 2023 |
15,545 |
1,310 |
236 |
24,821 |
Capitalized Costs Relating to Natural Gas and Oil Producing Activities
Capitalized costs relating to natural gas and oil producing activities and related accumulated depreciation, depletion and
amortization were as follows:
December 31, 2023 |
December 31, 2022 |
December 31, 2021 |
|
Proved properties |
$3,206,739 |
$3,062,463 |
$2,866,353 |
Unproved properties |
— |
— |
— |
Total capitalized costs |
3,206,739 |
3,062,463 |
2,866,353 |
Less: Accumulated depreciation, depletion and amortization |
(716,364) |
(506,655) |
(336,275) |
Net capitalized costs |
$2,490,375 |
$2,555,808 |
$2,530,078 |
Costs Incurred in Natural Gas and Oil Property Acquisition, Exploration and
Development Activities
Costs incurred in natural gas and oil property acquisition, exploration and development activities were as follows:
December 31, 2023 |
December 31, 2022 |
December 31, 2021 |
|
Proved properties |
$78,582 |
$260,817 |
$718,353 |
Unproved properties |
— |
— |
— |
Total property acquisition costs |
78,582 |
260,817 |
718,353 |
Total exploration and development costs |
10,923 |
19,670 |
1,464 |
Capitalized interest |
— |
— |
— |
Total costs |
$89,505 |
$280,487 |
$719,817 |
Standardized Measure of Discounted Future Net Cash Flows
The following information has been developed based on natural gas and crude oil reserve and production volumes estimated
by the Group’s engineering staff. It can be used for some comparisons, but should not be the only method used to evaluate the
Group or its performance. Further, the information in the following table may not represent realistic assessments of future cash
flows, nor should the Standardized Measure of Discounted Future Net Cash Flows (the “Standardized Measure”) be viewed as
representative of the current value of the Group.
The Group believes that the following factors should be taken into account when reviewing the following information:
—Future costs and selling prices will differ from those required to be used in these calculations;
—Due to future market conditions and governmental regulations, actual rates of production in future years may vary
significantly from the rate of production assumed in the calculations;
—Selection of a 10% discount rate is arbitrary and may not be a reasonable measure of the relative risk that is part of realizing
future net natural gas and oil revenues; and
—Future net cash flows may be subject to different rates of income taxation.
Under the Standardised Measure, future cash inflows were estimated by using the 12-month average index price for the
respective commodity, calculated as the unweighted arithmetic average for the first day of the month price for each month
during the year. Prices used for standardised measure (adjusted for basis and quality differentials) were as follows:
December 31, 2023 |
December 31, 2022 |
December 31, 2021 |
|
Natural gas (Mcf) |
$2.49 |
$6.29 |
$3.26 |
NGLs (Bbls) |
21.59 |
43.68 |
29.19 |
Oil (Bbls) |
71.89 |
94.01 |
62.55 |
Future cash inflows were reduced by estimated future development and production costs based on year-end costs to arrive at
net cash flow before tax. Future income tax expense was computed by applying year-end statutory tax rates to future pretax
net cash flows, less the tax basis of the properties involved and utilization of available tax carryforwards related to natural gas
and oil operations. The applicable accounting standards require the use of a 10% discount rate.
Management does not solely use the following information when making investment and operating decisions. These decisions
are based on a number of factors, including estimates of proved reserves and varying price and cost assumptions considered
more representative of a range of anticipated economic conditions. The Standardised Measure is as follows:
December 31, 2023 |
December 31, 2022 |
December 31, 2021 |
|
Future cash inflows |
$10,900,742 |
$32,155,117 |
$16,283,927 |
Future production costs |
(5,345,117) |
(8,923,660) |
(5,773,240) |
Future development costs(a)
|
(1,937,293) |
(1,902,297) |
(1,818,190) |
Future income tax expense |
(653,216) |
(5,001,823) |
(1,644,625) |
Future net cash flows |
2,965,116 |
16,327,337 |
7,047,872 |
10% annual discount for estimated timing of cash flows |
(1,219,580) |
(9,584,237) |
(3,714,781) |
Standardized Measure |
$1,745,536 |
$6,743,100 |
$3,333,091 |
(a)Includes $1,715,585, $1,698,105 and $1,615,461 in asset retirement costs for the years ended December 31, 2023, 2022 and 2021, respectively.
Future cash inflows were reduced by estimated future production and development costs based on year-end costs to
determine pre-tax cash inflows. Future income taxes were computed by applying the year-end statutory rate to the excess of
pre-tax cash inflows over the Group’s tax basis in the associated proved natural gas and oil properties after giving effect to
permanent differences and tax credits.
Changes in the Standardized Measure were as follows:
December 31, 2023 |
December 31, 2022 |
December 31, 2021 |
|
Standardized Measure, beginning of year |
$6,743,100 |
$3,333,091 |
$1,005,307 |
Sales and transfers of natural gas and oil produced, net of
production costs
|
(431,629) |
(1,498,272) |
(742,375) |
Net changes in prices and production costs |
(5,850,625) |
5,137,373 |
2,411,163 |
Extensions, discoveries, and other additions, net of future
production and development costs
|
(13,682) |
28,038 |
— |
Acquisition of reserves in place |
122,613 |
555,773 |
980,837 |
Divestiture of reserves in place |
(377,097) |
(8,303) |
(145,434) |
Revisions of previous quantity estimates |
(1,224,544) |
702,585 |
609,100 |
Net change in income taxes |
1,688,208 |
(1,378,438) |
(622,314) |
Changes in estimated future development costs |
— |
22,085 |
(5,612) |
Previously estimated development costs incurred during
the year
|
— |
7,711 |
— |
Changes in production rates (timing) and other |
206,646 |
(562,245) |
(266,273) |
Accretion of discount |
882,546 |
403,702 |
108,692 |
Standardized Measure, end of year |
$1,745,536 |
$6,743,100 |
$3,333,091 |

Additional
Information
Payments to Governments Report
2023 (Unaudited)
(AMOUNTS IN THOUSANDS)
This report provides a consolidated overview of the
payments to governments made by the Group for the year
2023 as required under Disclosure and Transparency Rule
4.3A issued by the UK's Financial Conduct Authority ("DTR
4.3A") and in accordance with The Reports on Payments to
Governments Regulations 2014 (as amended in 2015) ("the
UK Regulations"). DTR 4.3A requires companies listed on a
stock exchange in the UK and operating in the extractive
industry to publicly disclose payments to governments in
the countries where they undertake exploration,
prospection, discovery, development and extraction of
natural gas and oil deposits or other materials.
Basis of Preparation
Under the UK Regulations, the Group prepares a disclosure
on payments made to governments for each financial year
in relation to relevant activities of both the Group and any
of its subsidiary undertakings included in the Group
Financial Statements.
ACTIVITIES WITHIN THE SCOPE OF THE
DISCLOSURE
Payments made to governments that relate to the Group’s
activities involving the exploration, development, and
production of natural gas and oil reserves (“extractive
activities”) are included in this disclosure. Payments made
to governments that relate to activities other than
extractive activities are not included in this disclosure as
they are not within the scope of extractive activities as
defined by the UK Regulations.
GOVERNMENT
“Government” includes any national, regional or local
authority of a country, and includes a department, agency
or entity that is a subsidiary of a government.
CASH BASIS
Payments are reported on a cash basis, meaning that they
are reported in the period in which they are paid, as
opposed to being reported on an accrual basis, meaning
that they are reported in the period in which the
liabilities arise.
PROJECT DEFINITION
The UK Regulations require payments to be reported by
project (as a sub category within a country). They define a
“project” as the operational activities which are governed
by a single contract, license, lease, concession or similar
legal agreement, and form the basis for payment liabilities
with a government. If these agreements are substantially
interconnected, then they can be treated as a single project.
Under the UK Regulations “substantially interconnected”
means forming a set of operationally and geographically
integrated contracts, licenses, leases or concessions or
related agreements with substantially similar terms that are
signed with a government, giving rise to payment liabilities.
The number of projects will depend on the contractual
arrangements within a country and not necessarily on the
scale of activities. Moreover, a project will only appear in
this disclosure where relevant payments occurred during
the year in relation to that project. The UK Regulations
acknowledge that for some payments it may not be
possible to attribute a payment to a single project and
therefore such payments may be reported at the country
level. Corporate income taxes, which are typically not levied
at a project level, are an example of this.
MATERIALITY LEVEL
For each payment type, total payments below £86 to a
government are excluded from this report.
EXCHANGE RATE
Payments made in currencies other than USD are translated
for this report based on the foreign exchange rate at the
relevant quarterly average rate.
PAYMENT TYPES
The UK Regulations define a “payment” as an amount paid
whether in money or in kind, for relevant activities where
the payment is of any one of the types listed below:
PRODUCTION ENTITLEMENTS
Under production-sharing agreements (“PSA”) the
production is shared between the host government and the
other parties to the PSA. The host government typically
receives its share or entitlement in kind rather than being
paid in cash. For the year ended December 31, 2023, DEC
had no reportable production entitlements to
a government.
TAXES
This report includes taxes levied on income, personnel,
production or profits withheld from dividends, royalties and
interest received by DEC. Taxes levied on consumption,
sales, procurement (contractor’s withholding taxes),
environmental, property, customs and excise are not
reportable under the UK Regulations.
ROYALTIES
Payments for the rights to extract natural gas and oil
resources, typically at a set percentage of revenue less any
deductions that may be taken, and may be paid in cash or
in kind (valued in the same way as production entitlement).
DIVIDENDS
Dividend payments other than dividends paid to a
government as a shareholder of an entity unless paid in lieu
of production entitlements or royalties. For the year ended
December 31, 2023, DEC had no reportable dividend
payments to a government.
BONUSES
Signature, discovery and production bonuses and other
bonuses payable under licenses or concession agreements
are included in this report. These are usually paid upon
signing an agreement or a contract, or when a commercial
discovery is declared, or production has commenced or
production has reached a milestone. For the year ended
December 31, 2023, DEC had no reportable bonus
payments to a government.
FEES
In preparing this report, DEC has included license fees,
rental fees, entry fees and all other payments that are paid
in consideration for new and existing licenses and or
concessions. Fees paid to governments for administrative
services are excluded.
INFRASTRUCTURE IMPROVEMENTS
Payments which relate to the construction of infrastructure
(road, bridge or rail) not substantially dedicated for the use
of extractive activities. Payments which are of a social
investment in nature, for example building of a school or
hospital, are excluded.
Payments Overview
The tables below show the relevant payments to
governments made by DEC in the year ended
December 31, 2023 shown by country and payment type.
Of the seven payment types required by the UK
Regulations, DEC did not pay any production entitlements,
dividends, bonuses, fees and or infrastructure
improvements therefore those categories are not shown.
SUMMARY OF PAYMENTS TO GOVERNMENTS
(AMOUNTS IN THOUSANDS)
Countries |
Taxes |
Royalties |
Total |
United Kingdom |
$— |
$— |
$— |
United States |
88,665 |
4,022 |
92,687 |
Total |
$88,665 |
$4,022 |
$92,687 |
UNITED KINGDOM
Governments |
Taxes |
Royalties |
Total |
Oil and Gas Authority |
$— |
$— |
$— |
HM Revenue and Customs |
— |
— |
— |
The Crown Estate Scotland |
— |
— |
— |
Total |
$— |
$— |
$— |
UNITED STATES
Governments |
Taxes |
Royalties |
Total |
Commonwealth of Pennsylvania |
$3,100 |
$— |
$3,100 |
Commonwealth of Virginia |
1,180 |
— |
1,180 |
Internal Revenue Service |
14,639 |
— |
14,639 |
Office of Natural Resources Revenue |
— |
2,238 |
2,238 |
State of Alabama |
134 |
— |
134 |
State of Kentucky |
8,090 |
— |
8,090 |
State of Louisiana |
16,437 |
— |
16,437 |
State of Ohio |
2,363 |
— |
2,363 |
State of Oklahoma |
12,140 |
1,473 |
13,613 |
State of Tennessee |
285 |
— |
285 |
State of Texas |
19,612 |
311 |
19,923 |
State of West Virginia |
10,685 |
— |
10,685 |
Total |
$88,665 |
$4,022 |
$92,687 |
Alternative Performance Measures
(Unaudited)
(AMOUNTS IN THOUSANDS, EXCEPT PER SHARE AND
PER UNIT DATA)
We use APMs to improve the comparability of information
between reporting periods and to more accurately evaluate
cash flows, either by adjusting for uncontrollable or
transactional factors that are not comparable period-over-
period, or by aggregating measures, to aid the users of this
Annual Report & Form 20-F in understanding the activity
taking place across the Group. APMs are used by the
Directors for planning and reporting and should not be
considered an IFRS replacement. The measures are also
used in discussions with the investment analyst community
and credit rating agencies.
Adjusted EBITDA
As used herein, EBITDA represents earnings before interest, taxes, depletion, depreciation and amortization. adjusted EBITDA
includes adjusting for items that are not comparable period-over-period, namely, accretion of asset retirement obligation,
other (income) expense, loss on joint and working interest owners receivable, (gain) loss on bargain purchases, (gain) loss on
fair value adjustments of unsettled financial instruments, (gain) loss on natural gas and oil property and equipment, costs
associated with acquisitions, other adjusting costs, non-cash equity compensation, (gain) loss on foreign currency hedge, net
(gain) loss on interest rate swaps and items of a similar nature.
Adjusted EBITDA should not be considered in isolation or as a substitute for operating profit or loss, net income or loss, or
cash flows provided by operating, investing and financing activities. However, we believe such measure is useful to an investor
in evaluating our financial performance because it (1) is widely used by investors in the natural gas and oil industry as an
indicator of underlying business performance; (2) helps investors to more meaningfully evaluate and compare the results of
our operations from period to period by removing the often-volatile revenue impact of changes in the fair value of derivative
instruments prior to settlement; (3) is used in the calculation of a key metric in one of our Credit Facility financial covenants;
and (4) is used by us as a performance measure in determining executive compensation. When evaluating this measure, we
believe investors also commonly find it useful to evaluate this metric as a percentage of our total revenue, inclusive of settled
hedges, producing what we refer to as our adjusted EBITDA margin.
Year Ended |
|||
December 31, 2023 |
December 31, 2022 |
December 31, 2021 |
|
Net income (loss) |
$759,701 |
$(620,598) |
$(325,206) |
Finance costs |
134,166 |
100,799 |
50,628 |
Accretion of asset retirement obligations |
26,926 |
27,569 |
24,396 |
Other (income) expense |
(385) |
(269) |
8,812 |
Income tax (benefit) expense |
240,643 |
(178,904) |
(225,694) |
Depreciation, depletion and amortization |
224,546 |
222,257 |
167,644 |
(Gain) loss on bargain purchases |
— |
(4,447) |
(58,072) |
(Gain) loss on fair value adjustments of unsettled financial
instruments
|
(905,695) |
861,457 |
652,465 |
(Gain) loss on natural gas and oil properties and
equipment(a)
|
20 |
93 |
901 |
(Gain) loss on sale of equity interest |
(18,440) |
— |
— |
Unrealized (gain) loss on investment |
(4,610) |
— |
— |
Impairment of proved properties |
41,616 |
— |
— |
Costs associated with acquisitions |
16,775 |
15,545 |
27,743 |
Other adjusting costs(b)
|
17,794 |
69,967 |
10,371 |
Non-cash equity compensation |
6,494 |
8,051 |
7,400 |
(Gain) loss on foreign currency hedge |
521 |
— |
1,227 |
(Gain) loss on interest rate swap |
2,722 |
1,434 |
530 |
Total adjustments |
$(216,907) |
$1,123,552 |
$668,351 |
Adjusted EBITDA |
$542,794 |
$502,954 |
$343,145 |
(a)Excludes $24.2 million and $2 million in proceeds received for leasehold sales during the years ended December 31, 2023 and 2022.
(b)Other adjusting costs for the year ended December 31, 2023 were primarily associated with legal and professional fees related to the U.S.
listing, legal fees for certain litigation, and expenses associated with unused firm transportation agreements. Other adjusting costs for the
year ended December 31, 2022 primarily consisted of $28 million in contract terminations which may allow the Group to obtain more
favorable pricing in the future and $31 million in costs associated with deal breakage and/or sourcing costs for acquisitions.
Net Debt
As used herein, net debt represents total debt as recognized on the balance sheet less cash and restricted cash. Total debt
includes our borrowings under the Credit Facility and borrowings under or issuances of, as applicable, our subsidiaries’
securitization facilities. We believe net debt is a useful indicator of our leverage and capital structure.
Net Debt-to-Adjusted EBITDA
As used herein, net debt-to-adjusted EBITDA, or “leverage” or “leverage ratio,” is measured as net debt divided by adjusted
EBITDA. We believe that this metric is a key measure of our financial liquidity and flexibility and is used in the calculation of a
key metric in one of our Credit Facility financial covenants.
As of |
|||
December 31, 2023 |
December 31, 2022 |
December 31, 2021 |
|
Credit Facility |
$159,000 |
$56,000 |
$570,600 |
ABS I Notes |
100,898 |
125,864 |
155,266 |
ABS II Notes |
125,922 |
147,458 |
169,320 |
ABS III Notes |
274,710 |
319,856 |
— |
ABS IV Notes |
99,951 |
130,144 |
— |
ABS V Notes |
290,913 |
378,796 |
— |
ABS VI Notes |
159,357 |
212,446 |
— |
Term Loan I |
106,470 |
120,518 |
137,099 |
Other |
7,627 |
7,084 |
9,380 |
Total debt |
$1,324,848 |
$1,498,166 |
$1,041,665 |
LESS: Cash |
3,753 |
7,329 |
12,558 |
LESS: Restricted cash |
36,252 |
55,388 |
19,102 |
Net debt |
$1,284,843 |
$1,435,449 |
$1,010,005 |
Adjusted EBITDA |
$542,794 |
$502,954 |
$343,145 |
Pro forma adjusted EBITDA(a)
|
$549,258 |
$574,414 |
$490,978 |
Net debt-to-pro forma adjusted EBITDA(b)
|
2.3x |
2.5x |
2.1x |
(a)Pro forma adjusted EBITDA includes adjustments for the year ended December 31, 2023 for the Tanos II Acquisition to pro forma its results
for the full twelve months of operations. Similar adjustments were made for the year ended December 31, 2022 for the East Texas Assets and
ConocoPhillips acquisitions.
(b)Does not include adjustments for working capital which are often customary in the market.
Total Revenue, Inclusive of Settled Hedges
As used herein, total revenue, inclusive of settled hedges, includes the impact of derivatives settled in cash. We believe that
total revenue, inclusive of settled hedges is a useful because it enables investors to discern our realized revenue after adjusting
for the settlement of derivative contracts.
Adjusted EBITDA Margin
As used herein, adjusted EBITDA margin is measured as adjusted EBITDA, as a percentage of total revenue, inclusive of settled
hedges. adjusted EBITDA margin includes the direct operating cost and the portion of general and administrative cost it takes
to produce each Mcfe. This metric includes operating expense, employees, administrative costs and professional services and
recurring allowance for credit losses, which include fixed and variable costs components. We believe that adjusted EBITDA
margin is a useful measure of our profitability and efficiency as well as our earnings quality because it measures the Group on a
more comparable basis period-over-period, given we are often involved in transactions that are not comparable
between periods.
Year Ended |
|||
December 31, 2023 |
December 31, 2022 |
December 31, 2021 |
|
Total revenue |
$868,263 |
$1,919,349 |
$1,007,561 |
Net gain (loss) on commodity derivative instruments(a)
|
178,064 |
(895,802) |
(320,656) |
Total revenue, inclusive of settled hedges |
$1,046,327 |
$1,023,547 |
$686,905 |
Adjusted EBITDA |
$542,794 |
$502,954 |
$343,145 |
Adjusted EBITDA margin |
52% |
49% |
50% |
(a)Net gain (loss) on commodity derivative settlements represents cash (paid) or received on commodity derivative contracts. This excludes
settlements on foreign currency and interest rate derivatives as well as the gain (loss) on fair value adjustments for unsettled financial
instruments for each of the periods presented.
Free Cash Flow
As used herein, free cash flow represents net cash provided by operating activities less expenditures on natural gas and oil
properties and equipment and cash paid for interest. We believe that free cash flow is a useful indicator of our ability to
generate cash that is available for activities other than capital expenditures. The Directors believe that free cash flow provides
investors with an important perspective on the cash available to service debt obligations, make strategic acquisitions and
investments and pay dividends.
Year Ended |
|||
December 31, 2023 |
December 31, 2022 |
December 31, 2021 |
|
Net cash provided by operating activities |
$410,132 |
$387,764 |
$320,182 |
LESS: Expenditures on natural gas and oil properties and
equipment
|
(74,252) |
(86,079) |
(50,175) |
LESS: Cash paid for interest |
(116,784) |
(83,958) |
(42,673) |
Free cash flow |
$219,096 |
$217,727 |
$227,334 |
Adjusted Operating Cost per Mcfe
Adjusted operating cost per Mcfe is a metric that allows us to measure the direct operating cost and the portion of general
and administrative cost it takes to produce each Mcfe. This metric, similar to adjusted EBITDA margin, includes operating
expense employees, administrative costs and professional services and recurring allowance for credit losses, which include
fixed and variable cost components.
Employees, administrative costs and professional services
As used herein, employees, administrative costs and professional services represents total administrative expenses excluding
cost associated with acquisitions, other adjusting costs and non-cash expenses. We use employees, administrative costs and
professional services because this measure excludes items that affect the comparability of results or that are not indicative of
trends in the ongoing business.
Year Ended |
|||
December 31, 2023 |
December 31, 2022 |
December 31, 2021 |
|
Total production (MMcfe) |
299,632 |
296,121 |
259,543 |
Total operating expense |
$440,562 |
$445,893 |
$291,213 |
Employees, administrative costs and professional services |
78,659 |
77,172 |
56,812 |
Recurring allowance for credit losses |
8,478 |
— |
(4,265) |
Adjusted operating cost |
$527,699 |
$523,065 |
$343,760 |
Adjusted operating cost per Mcfe |
$1.76 |
$1.77 |
$1.32 |
PV-10
PV-10 is a non-IFRS measure because it excludes the effects of applicable income tax. The Directors believe that the
presentation of the non-IFRS financial measure of PV-10 provides useful information to investors because it is widely used by
professional analysts and sophisticated investors in evaluating natural gas and oil companies. PV-10 is not a measure of
financial or operating performance under IFRS. PV-10 should not be considered as an alternative to the standardized measure
as defined under IFRS. Refer to Supplemental Natural Gas and Oil Information for a reconciliation of PV-10 to the
standardized measure of discounted future net cash flows, its most directly comparable IFRS measure. PV-10 differs from the
standardized measure of discounted future net cash flows because it does not include the effects of income taxes. Neither
PV-10 nor the standardized measure represents an estimate of fair market value of our natural gas and oil properties.
As of |
|||
December 31, 2023 |
December 31, 2022 |
December 31, 2021 |
|
SEC Pricing(a)
|
|||
PV-10 |
|||
Pre-tax (Non-GAAP)(b)
|
$2,139,690 |
$8,825,462 |
$4,037,016 |
PV of Taxes |
(394,154) |
(2,082,362) |
(703,925) |
Standardized Measure |
$1,745,536 |
$6,743,100 |
$3,333,091 |
(a)Our estimated net proved reserves were determined using average first-day-of-the-month prices for the prior 12 months in accordance with
SEC guidance. For natural gas volumes, the average Henry Hub spot price of $2.64, $6.36 and $3.60 per MMBtu as of December 31, 2023,
2022 and 2021, respectively, was adjusted for gravity, quality, local conditions, gathering and transportation fees, and distance from market.
For NGLs and oil volumes, the average WTI price of $78.21, $94.14 and $66.55 per Bbl as of December 31, 2023, 2022 and 2021, respectively,
was similarly adjusted for gravity, quality, local conditions, gathering and transportation, fees and distance from market. All prices are held
constant throughout the lives of the properties.
(b)The PV-10 of our proved reserves as of December 31, 2023, 2022 and 2021 was prepared without giving effect to taxes or hedges. PV-10 is a
non-GAAP and non-IFRS financial measure and generally differs from Standardized Measure, the most directly comparable GAAP measure,
because it does not include the effects of income taxes on future net cash flows. We believe that the presentation of PV-10 is relevant and
useful to our investors as supplemental disclosure to the Standardized Measure because it presents the discounted future net cash flows
attributable to our reserves prior to taking into account future corporate income taxes and our current tax structure. While the Standardized
Measure is free cash dependent on the unique tax situation of each company, PV-10 is based on a pricing methodology and discount factors
that are consistent for all companies. Because of this, PV-10 can be used within the industry and by creditors and securities analysts to
evaluate estimated net cash flows from proved reserves on a more comparable basis. Investors should be cautioned that neither PV-10 nor
the Standardized Measure represents an estimate of the fair market value of our proved reserves.
Officers and Professional Advisors
Directors |
David E. Johnson (Non-Executive Chairman (Independent upon appointment))
Martin K. Thomas (Non-Executive Vice Chairman)
Rusty Hutson, Jr. (Chief Executive Officer)
David J. Turner, Jr. (Independent Non-Executive Director)
Sandra M. Stash (Independent Non-Executive Director)
Kathryn Z. Klaber (Independent Non-Executive Director)
Sylvia Kerrigan (Senior Independent Non-Executive Director)
|
|
Registered Number |
09156132 (England and Wales) |
|
Registered Office |
4th floor Phoenix House
1 Station Hill
Reading, Berkshire, RG1 1NB
United Kingdom
|
|
Headquarters |
1600 Corporate Drive
Birmingham, Alabama 35242
United States
|
|
Company Secretary |
Apex Secretaries LLP
6th Floor 140 London Wall
London EC2V 5DN
United Kingdom
|
|
Independent Auditors,
United Kingdom
|
PricewaterhouseCoopers LLP
1 Embankment Place
London WC2N 6RH
United Kingdom
|
|
Independent Registered
Public Accounting Firm,
United States
|
PricewaterhouseCoopers LLP
569 Brookwood Village #851
Birmingham, AL 35209
United States
|
|
Legal Advisor,
United Kingdom
|
Latham & Watkins (London) LLP
99 Bishopsgate
London ECM2 3XF
United Kingdom
|
|
Legal Advisor,
United States
|
Benjamin Sullivan, Senior Executive Vice President and Chief Legal & Risk Officer
414 Summers Street
Charleston, WV 25301
United States
|
|
Competent Person |
Netherland, Sewell & Associates, Inc.
2100 Ross Avenue, Suite 2200
Dallas, Texas 75201
United States
|
|
Share Registrar |
ComputerShare Investor Services PLC
The Pavilions, Bridgewater Road
Bristol, BS13 8AE
United Kingdom
|
|
Brokers |
Tennyson Securities
23rd Floor, 20 Fenchurch Street
London EC3M 3BY
United Kingdom
Stifel Nicolaus Europe Limited
150 Cheapside
London, EC2V 6ET
United Kingdom
|
Peel Hunt LLP
7th Floor, 100 Liverpool Street
London EC2M 2AT
United Kingdom
|
Shareholder Information
MATERIAL CONTRACTS
Our material contracts as of December 31, 2023 include:
—Participation Agreement, dated October 2, 2020, by and
between Diversified Production LLC and OCM Denali
Holdings, LLC.
—Letter Agreement, dated January 12, 2022, by and
between Diversified Production LLC and OCM Denali
Holdings, LLC.
—Amended, Restated and Consolidated Revolving Credit
Agreement, dated December 7, 2018, among Diversified
Gas & Oil Corporation, as borrower, KeyBank National
Association, as administrative agent and issuing bank,
Keybanc Capital Markets, as sole lead arranger and sole
book runner and the lenders party thereto. For a
description of this contract, see Liquidity and
Capital Resources.
—First Amendment to Amended, Restated and
Consolidated Revolving Credit Agreement, dated April
18, 2019, among Diversified Gas & Oil Corporation, as
borrower, KeyBank National Association, as
administrative agent, the guarantors party thereto and
the lenders party thereto. For a description of this
contract, see Liquidity and Capital Resources.
—Second Amendment to Amended, Restated and
Consolidated Revolving Credit Agreement, dated June
28, 2019, among Diversified Gas & Oil Corporation, as
borrower, KeyBank National Association, as
administrative agent, the guarantors party thereto and
the lenders party thereto. For a description of this
contract, see Liquidity and Capital Resources.
—Third Amendment to Amended, Restated and
Consolidated Revolving Credit Agreement, dated
November 13, 2019, among Diversified Gas & Oil
Corporation, as borrower, KeyBank National Association,
as administrative agent, the guarantors party thereto and
the lenders party thereto. For a description of this
contract, see Liquidity and Capital Resources.
—Fourth Amendment to Amended, Restated and
Consolidated Revolving Credit Agreement, dated
January 9, 2020, among Diversified Gas & Oil
Corporation, as borrower, KeyBank National Association,
as administrative agent, the guarantors party thereto and
the lenders party thereto. For a description of this
contract, see Liquidity and Capital Resources.
—Fifth Amendment to Amended, Restated and
Consolidated Revolving Credit Agreement, dated
January 22, 2020, among Diversified Gas & Oil
Corporation, as borrower, KeyBank National Association,
as administrative agent, the guarantors party thereto and
the lenders party thereto. For a description of this
contract, see Liquidity and Capital Resources.
—Sixth Amendment to Amended, Restated and
Consolidated Revolving Credit Agreement, dated March
24, 2020, among Diversified Gas & Oil Corporation, as
borrower, KeyBank National Association, as
administrative agent, the guarantors party thereto and
the lenders party thereto. For a description of this
contract, see Liquidity and Capital Resources.
—Seventh Amendment to Amended, Restated and
Consolidated Revolving Credit Agreement, dated May 21,
2020, among Diversified Gas & Oil Corporation, as
borrower, KeyBank National Association, as
administrative agent, the guarantors party thereto and
the lenders party thereto. For a description of this
contract, see Liquidity and Capital Resources.
—Eighth Amendment to Amended, Restated and
Consolidated Revolving Credit Agreement, dated June
26, 2020, among Diversified Gas & Oil Corporation, as
borrower, KeyBank National Association, as
administrative agent, the guarantors party thereto and
the lenders party thereto. For a description of this
contract, see Liquidity and Capital Resources.
—Ninth Amendment to Amended, Restated and
Consolidated Revolving Credit Agreement, dated
November 19, 2020, among Diversified Gas & Oil
Corporation, as borrower, KeyBank National Association,
as administrative agent, the guarantors party thereto and
the lenders party thereto. For a description of this
contract, see Liquidity and Capital Resources.
—Tenth Amendment to Amended, Restated and
Consolidated Revolving Credit Agreement, dated April 6,
2021, among Diversified Gas & Oil Corporation, as
borrower, KeyBank National Association, as
administrative agent, the guarantors party thereto and
the lenders party thereto. For a description of this
contract, see Liquidity and Capital Resources.
—Eleventh Amendment to Amended, Restated and
Consolidated Revolving Credit Agreement, dated May 11,
2021, among Diversified Gas & Oil Corporation, as
borrower, KeyBank National Association, as
administrative agent, the guarantors party thereto and
the lenders party thereto. For a description of this
contract, see Liquidity and Capital Resources.
—Twelfth Amendment to Amended, Restated and
Consolidated Revolving Credit Agreement, dated August
17, 2021, among the Diversified Gas & Oil Corporation, as
borrower, KeyBank National Association, as
administrative agent, the guarantors party thereto and
the lenders party thereto. For a description of this
contract, see Liquidity and Capital Resources.
—Thirteenth Amendment to Amended, Restated and
Consolidated Revolving Credit Agreement, dated
December 7, 2021, among Diversified Gas & Oil
Corporation, as borrower, KeyBank National Association,
as administrative agent, the guarantors party thereto and
the lenders party thereto. For a description of this
contract, see Liquidity and Capital Resources.
—Fourteenth Amendment to Amended, Restated and
Consolidated Revolving Credit Agreement, dated
February 4, 2022, among Diversified Gas & Oil
Corporation, as borrower, KeyBank National Association,
as administrative agent, the guarantors party thereto and
the lenders party thereto. For a description of this
contract, see Liquidity and Capital Resources.
—Fifteenth Amendment to Amended, Restated and
Consolidated Revolving Credit Agreement, dated
February 22, 2022, among Diversified Gas & Oil
Corporation, as borrower, KeyBank National Association,
as administrative agent, the guarantors party thereto and
the lenders party thereto. For a description of this
contract, see Liquidity and Capital Resources.
—Sixteenth Amendment to Amended, Restated and
Consolidated Revolving Credit Agreement, dated May
27, 2022, among Diversified Gas & Oil Corporation, as
borrower, KeyBank National Association, as
administrative agent, the guarantors party thereto and
the lenders party thereto. For a description of this
contract, see Liquidity and Capital Resources.
—Amended and Restated Revolving Credit Agreement,
dated as of August 2, 2022 among DP RBL CO LLC, as
borrower, Diversified Gas & Oil Corporation, as existing
borrower, KeyBank National Association, as
administrative agent and issuing bank, Keybanc Capital
Markets, as sole lead arranger and sole book runner and
the lenders party thereto. For a description of this
contract, see Liquidity and Capital Resources.
—First Amendment to Amended and Restated Revolving
Credit Agreement, dated as of March 1, 2023 among DP
RBL CO LLC, as borrower, Diversified Gas & Oil
Corporation, as existing borrower, KeyBank National
Association, as administrative agent and issuing bank,
Keybanc Capital Markets, as sole lead arranger and sole
book runner and the lenders party thereto. For a
description of this contract, see Liquidity and
Capital Resources.
—Second Amendment to Amended and Restated
Revolving Credit Agreement, dated as of April 27, 2023
among DP RBL CO LLC, as borrower, Diversified Gas &
Oil Corporation, as existing borrower, KeyBank National
Association, as administrative agent and issuing bank,
Keybanc Capital Markets, as sole lead arranger and sole
book runner and the lenders party thereto. For a
description of this contract, see Liquidity and Capital
Resources.
—Credit Agreement, dated May 26, 2020, by and between
DP Bluegrass LLC (f.k.a Carbon West Virginia Company,
LLC), as borrower and Munich Re Reserve Risk
Financing, Inc., as lender, as amended. For a description
of this contract, see Liquidity and Capital Resources.
—Indenture, dated November 13, 2019, by and between
Diversified ABS LLC, as issuer, and UMB Bank, N.A., as
indenture trustee and securities intermediary. For a
description of this contract, see Liquidity and
Capital Resources.
—First Amendment to Indenture, dated February 13, 2020,
by and between Diversified ABS LLC, as issuer, and UMB
Bank, N.A., as indenture trustee. For a description of this
contract, see Liquidity and Capital Resources.
—Indenture, dated April 9, 2020, by and between
Diversified ABS Phase II LLC, as issuer, and UMB Bank,
N.A., as indenture trustee and securities intermediary.
For a description of this contract, see Liquidity and
Capital Resources.
—Indenture, dated February 4, 2022, among Diversified
ABS Phase III LLC, as issuer, the guarantors named
therein and UMB Bank, N.A., as indenture trustee and
securities intermediary. For a description of this contract,
see Liquidity and Capital Resources.
—Indenture, dated February 23, 2022, by and between
Diversified ABS Phase IV LLC, as issuer, and UMB Bank,
N.A., as indenture trustee and securities intermediary.
For a description of this contract, see Liquidity and
Capital Resources.
—Indenture, dated May 27, 2022, among Diversified ABS
Phase V LLC, as issuer, Diversified ABS V Upstream LLC,
as guarantor and UMB Bank, N.A., as indenture trustee
and securities intermediary. For a description of this
contract, see Liquidity and Capital Resources.
—Indenture, dated October 27, 2022, among Diversified
ABS Phase VI LLC, as issuer, Diversified ABS VI
Upstream LLC and Oaktree ABS VI Upstream LLC, as
guarantors and UMB Bank, N.A., as indenture trustee and
securities intermediary. For a description of this contract,
see Liquidity and Capital Resources.
—Indenture, dated November 30, 2023, by and between
DP Lion Holdco, as issuer and UMB Bank, N.A., as
indenture trustee and securities intermediary. For a
description of this contract, see Liquidity and
Capital Resources.
—Service Agreement, dated January 30, 2017, by and
between Diversified Gas & Oil PLC and Rusty Hutson
—Service Agreement, dated January 30, 2017, by and
between Diversified Gas & Oil PLC and Bradley Gray
—2017 Equity Incentive Plan, as amended.
EXCHANGE CONTROLS
Other than certain economic sanctions which may be in
place from time to time, there are currently no UK laws,
decrees or regulations restricting the import or export of
capital or affecting the remittance of dividends or other
payment to holders of ordinary shares who are non-
residents of the United Kingdom. Similarly, other than
certain economic sanctions which may be in force from
time to time, there are no limitations relating only to
nonresidents of the United Kingdom under English law or
the Group’s articles of association on the right to be a
holder of, and to vote in respect of, the ordinary shares.
TAXATION
Material United Kingdom Tax Considerations
The following statements are of a general nature and do not
purport to be a complete analysis of all potential UK tax
consequences of acquiring, holding and disposing of the
ordinary shares. They are based on current UK tax law and
on the current published practice of His Majesty’s Revenue
and Customs (“HMRC”) (which may not be binding on
HMRC), as of the date of this Annual Report & Form 20-F,
all of which are subject to change, possibly with
retrospective effect. They are intended to address only
certain UK tax consequences for holders of ordinary shares
who are tax resident in (and only in) the United Kingdom,
and in the case of individuals, domiciled in (and only in) the
United Kingdom (except where expressly stated otherwise)
who are the absolute beneficial owners of the ordinary
shares and any dividends paid on them and who hold the
ordinary shares as investments (other than in an individual
savings account or a self-invested personal pension). They
do not address the UK tax consequences which may be
relevant to certain classes of shareholders such as traders,
brokers, dealers, banks, financial institutions, insurance
companies, investment companies, collective investment
schemes, tax-exempt organizations, trustees, persons
connected with the Group, persons holding their ordinary
shares as part of hedging or conversion transactions,
shareholders who have (or are deemed to have) acquired
their ordinary shares by virtue of an office or employment,
and shareholders who are or have been officers or
employees of the Group. The statements do not apply to
any shareholder who either directly or indirectly holds or
controls 10% or more of the Group’s share capital (or class
thereof), voting power or profits.
The following is intended only as a general guide and is not
intended to be, nor should it be considered to be, legal or
tax advice to any particular prospective subscriber for, or
purchaser of, any ordinary shares. Accordingly, prospective
subscribers for, or purchasers of, any ordinary shares who
are in any doubt as to their tax position regarding the
acquisition, ownership or disposition of any ordinary shares
or who are subject to tax in a jurisdiction other than the
United Kingdom should consult their own tax advisers.
UK taxation of dividends
Withholding tax
The Group will not be required to withhold UK tax at source
when paying dividends. The amount of any liability to UK
tax on dividends paid by the Group will depend on the
individual circumstances of a shareholder.
Income tax
An individual shareholder who is resident for tax purposes
in the United Kingdom may, depending on his or her
particular circumstances, be subject to UK tax on dividends
received from the Group. An individual shareholder who is
not resident for tax purposes in the United Kingdom should
not be chargeable to UK income tax on dividends received
from the Group unless he or she carries on (whether solely
or in partnership) any trade, profession or vocation in the
United Kingdom through a branch or agency to which the
ordinary shares are attributable. There are certain
exceptions for trading in the United Kingdom through
independent agents, such as some brokers and investment
managers.
All dividends received by a UK tax resident individual
holder of any ordinary shares from the Group or from other
sources will form part of the shareholder’s total income for
income tax purposes and will constitute the top slice of that
income. A nil rate of income tax will apply to the first
£1,000 (reducing to £500 from April 6, 2024) of taxable
dividend income received by the shareholder in a tax year.
Income within the nil rate band will be taken into account in
determining whether income in excess of the nil rate band
falls within the basic rate, higher rate or additional rate tax
bands. Where the dividend income is above the £1,000
dividend allowance, the first £1,000 of the dividend income
will be charged at the nil rate and any excess amount will
be taxed at 8.75% to the extent that the excess amount falls
within the basic rate tax band, 33.75% to the extent that the
excess amount falls within the higher rate tax band and
39.35% to the extent that the excess amount falls within the
additional rate tax band.
Corporation tax
Corporate shareholders which are resident for tax purposes
in the United Kingdom should not be subject to UK
corporation tax on any dividend received from the Group
so long as the dividends qualify for exemption
(as is likely) and certain conditions are met (including
anti-avoidance conditions). If the conditions for exemption
are not met or cease to be satisfied, or such a shareholder
elects for an otherwise exempt dividend to be taxable, the
shareholder will be subject to UK corporation tax on
dividends received from the Group, at the rate of
corporation tax applicable to that shareholder (the main
rate of UK corporation tax is currently 25%).
Corporate shareholders who are not resident in the United
Kingdom will not generally be subject to UK corporation tax
on dividends unless they are carrying on a trade, profession
or vocation in the United Kingdom through a permanent
establishment in connection with which the ordinary shares
are used, held, or acquired.
A shareholder who is resident outside the United Kingdom
may be subject to non-UK taxation on dividend income
under local law.
UK taxation of chargeable gains
UK resident shareholders
A disposal or deemed disposal of ordinary shares by an
individual or corporate shareholder who is tax resident in
the United Kingdom may, depending on the shareholder’s
circumstances and subject to any available exemptions or
reliefs, give rise to a chargeable gain or allowable loss for
the purposes of UK taxation of chargeable gains.
Any chargeable gain (or allowable loss) will generally be
calculated by reference to the consideration received for
the disposal of the ordinary shares less the allowable cost
to the shareholder of acquiring any such ordinary shares.
The applicable tax rates for individual shareholders realizing
a gain on the disposal of ordinary shares is, broadly, 10% for
basic rate taxpayers and 20% for higher and additional rate
taxpayers. For corporate shareholders, corporation tax is
generally charged on chargeable gains at the rate
applicable to the relevant corporate shareholder.
Non-UK shareholders
Shareholders who are not resident in the United Kingdom
and, in the case of an individual shareholder, not
temporarily non-resident, should not be liable for UK tax on
capital gains realized on a sale or other disposal of ordinary
shares unless (i) such ordinary shares are used, held or
acquired for the purposes of a trade, profession or vocation
carried on in the United Kingdom through a branch or
agency or, in the case of a corporate shareholder, through a
permanent establishment or (ii) where certain conditions
are met, the Group derives 75% or more of its gross value
from UK land. Shareholders who are not resident in the
United Kingdom may be subject to non-UK taxation on any
gain under local law.
Generally, an individual shareholder who has ceased to be
resident in the United Kingdom for UK tax purposes for a
period of five years or less and who disposes of any
ordinary shares during that period may be liable on their
return to the United Kingdom to UK taxation on any capital
gain realized (subject to any available exemption or relief).
UK stamp duty (“stamp duty”) and UK stamp duty reserve
tax (“SDRT”)
The statements in this paragraph are intended as a general
guide to the current position relating to stamp duty and
SDRT and apply to any shareholder irrespective of their
place of tax residence. Certain categories of person,
including intermediaries, brokers, dealers and persons
connected with depositary receipt arrangements and
clearance services, may not be liable to stamp duty or
SDRT or may be liable at a higher rate or may, although not
primarily liable for the tax, be required to notify and
account for it under the UK Stamp Duty Reserve Tax
Regulations 1986. The discussion below does not consider
any potential change of law.
Issue of shares
As a general rule (and except in relation to depositary
receipt systems and clearance services (as to which see
below)), no stamp duty or SDRT is payable on the issue of
the ordinary shares.
Clearance systems and depositary receipt issuers
An unconditional agreement to issue or transfer ordinary
shares to, or to a nominee or agent for, a person whose
business is or includes the issue of depositary receipts or
the provision of clearance services will generally be subject
to SDRT (or, where the transfer is effected by a written
instrument, stamp duty) at a higher rate of 1.5% of the
amount or value of the consideration given for the transfer
unless, in the context of a clearance service, the clearance
service has made and maintained an election under section
97A of the UK Finance Act 1986, or a “section 97A
election.” It is understood that HMRC regards the facilities
of DTC as a clearance service for these purposes and we
are not aware of any section 97A election having been
made by DTC. However, HMRC clearance has been received
by the Group confirming that no stamp duty or SDRT is
payable on the transfer of legal title to the existing ordinary
shares into the DTC clearing system, to the extent required
in order to implement the U.S. Listing at the effective time.
Such HMRC clearance only applies to transfers into the DTC
clearing system made on the Initial Depositary Transfer
Date in order to implement the U.S. Listing (and transfers of
ordinary shares held by Restricted Shareholders which are
transferred to Computershare Trust Company N.A. (as
depositary for the holders of the Restricted Shares) on the
Initial Depositary Transfer Date), and not subsequent
transfers into the DTC clearing system (other than certain
transfers of ordinary shares held by Restricted Shareholders
on the Initial Depositary Transfer Date).
Transfer of shares and DIs
No SDRT should be required to be paid on a paperless
transfer of ordinary shares through the clearance service
facilities of DTC, provided that no section 97A election has
been made by DTC, and such ordinary shares are held
through DTC at the time of any agreement for
their transfer.
No stamp duty will in practice be payable on a written
instrument transferring an ordinary share provided that the
instrument of transfer is executed and remains at all times
outside the United Kingdom. Where these conditions are
not met, the transfer of, or agreement to transfer, an
ordinary share could, depending on the circumstances,
attract a charge to stamp duty at the rate of 0.5% of the
amount or value of the consideration. If it is necessary to
pay stamp duty, it may also be necessary to pay interest
and penalties.
The Group has received HMRC clearance confirming that
agreements to transfer DIs which represent ordinary shares
held within the DTC clearance system will not be subject
to SDRT.
Material United States Federal Income Tax Considerations
The following discussion is a summary of the material U.S.
federal income tax consequences to U.S. Holders and Non-
U.S. Holders (each, as defined below) of the purchase,
ownership and disposition of an ordinary share issued
pursuant to this listing, but does not purport to be a
complete analysis of all potential U.S. federal tax effects.
The effects of other U.S. federal tax laws, such as estate and
gift tax laws, and any applicable state, local, or non-U.S. tax
laws are not discussed herein. This discussion is based on
the Code, Treasury Regulations promulgated thereunder,
judicial decisions, and published rulings and administrative
pronouncements of the U.S. Internal Revenue Service (the
“IRS”), in each case in effect as of the date hereof. These
authorities may change or be subject to differing
interpretations. Any such change or differing interpretation
may be applied retroactively in a manner that could
adversely affect a holder of an ordinary share. We have not
sought and will not seek any rulings from the IRS regarding
the matters discussed below. There can be no assurance
that the IRS or a court will not take a contrary position to
that discussed below regarding the tax consequences of
the purchase, ownership and disposition of our
ordinary shares.
This discussion is limited to U.S. Holders and Non-U.S.
Holders that each hold an ordinary share as a “capital asset”
within the meaning of Section 1221 of the Code (generally,
property held for investment). This discussion does not
address all U.S. federal income tax consequences relevant
to a holder’s particular circumstances, including the impact
of the Medicare contribution tax on net investment income
and the alternative minimum tax. In addition, it does not
address consequences relevant to holders subject to special
rules, including, without limitation:
—U.S. expatriates and former citizens or long-term
residents of the United States;
—U.S. Holders (as defined below) whose functional
currency is not the U.S. dollar;
—persons holding an ordinary share as part of a hedge,
straddle or other risk reduction strategy or as part of a
conversion transaction or other integrated investment;
—banks, insurance companies, and other financial
institutions;
—brokers, dealers or traders in securities;
—“controlled foreign corporations,” passive foreign
investment companies,” and corporations that
accumulate earnings to avoid U.S. federal income tax;
—partnerships or other entities or arrangements treated as
partnerships for U.S. federal income tax purposes and
other pass-through entities (and investors therein);
—tax-exempt organizations or governmental
organizations;
—persons deemed to sell an ordinary share under the
constructive sale provisions of the Code;
—persons who hold or receive an ordinary share pursuant
to the exercise of any employee stock option or
otherwise as compensation;
—tax qualified retirement plans;
—“qualified foreign pension funds” as defined in Section
897(l)(2) of the Code and entities of all the interests of
which are held by qualified foreign pension funds; and
—persons subject to special tax accounting rules as a
result of any item of gross income with respect to the
ordinary shares being taken into account in an applicable
financial statement.
If an entity or arrangement treated as a partnership for U.S.
federal income tax purposes holds an ordinary share, the
tax treatment of a partner in the partnership will depend on
the status of the partner, the activities of the partnership
and certain determinations made at the partner level.
Accordingly, partnerships holding an ordinary share and the
partners in such partnerships should consult their tax
advisors regarding the U.S. federal income tax
consequences to them.
THIS DISCUSSION IS FOR INFORMATIONAL PURPOSES ONLY AND
IS NOT TAX ADVICE. PROSPECTIVE INVESTORS SHOULD CONSULT
THEIR TAX ADVISORS WITH RESPECT TO THE APPLICATION OF
THE U.S. FEDERAL TAX LAWS TO THEIR PARTICULAR SITUATIONS
AS WELL AS ANY TAX CONSEQUENCES OF THE PURCHASE,
OWNERSHIP AND DISPOSITION OF AN ORDINARY SHARE ARISING
UNDER THE U.S. FEDERAL ESTATE OR GIFT TAX LAWS OR UNDER
THE LAWS OF ANY STATE, LOCAL OR NON-U.S. TAXING
JURISDICTION OR UNDER ANY APPLICABLE INCOME TAX TREATY.
U.S. Tax Status of Diversified Energy
Pursuant to Section 7874 of the Code, we believe we are
and will continue to be treated as a U.S. corporation for all
purposes under the Code. Since we will be treated as a U.S.
corporation for all purposes under the Code, we will not be
treated as a “passive foreign investment company,” as such
rules apply only to non-U.S. corporations for U.S. federal
income tax purposes.
U.S. Holders
For purposes of this discussion, a “U.S. Holder” is any
beneficial owner of an ordinary share that, for U.S. federal
income tax purposes, is or is treated as any of the following:
—an individual who is a citizen or resident of the United
States;
—a corporation created or organized under the laws of the
United States, any state thereof, or the District of
Columbia;
—an estate, the income of which is subject to U.S. federal
income tax regardless of its source; or

—a trust that (1) is subject to the primary supervision of a
U.S. court and the control of one or more “United States
persons” (within the meaning of Section 7701(a)(30) of
the Code), or (2) has a valid election in effect to be
treated as a United States person for U.S. federal income
tax purposes.
Distributions
Distributions, if any, made on the ordinary shares, generally
will be included in a U.S. Holder’s income as ordinary
dividend income to the extent of the Group’s current or
accumulated earnings and profits. Distributions in excess of
the Group’s current and accumulated earnings and profits
will be treated as a tax-free return of capital to the
extent of a U.S. Holder’s tax basis in the ordinary shares and
thereafter as capital gain from the sale or exchange of such
ordinary shares. Dividends received by a corporate U.S.
Holder may be eligible for a dividends-received deduction,
subject to applicable limitations. Dividends received by
certain non-corporate U.S. Holders (including individuals)
are generally taxed at the lower applicable long-term
capital gains rates, provided certain holding period and
other requirements are satisfied.
Sales, Certain Redemptions or Other Taxable Dispositions of
Ordinary Shares
Upon the sale, certain redemption or other taxable
disposition of an ordinary share, a U.S. Holder generally will
recognize gain or loss equal to the difference between the
amount realized and the U.S. Holder’s tax basis in the
ordinary shares. Any gain or loss recognized on a taxable
disposition of an ordinary share will be capital gain or loss.
Such capital gain or loss will be long-term capital gain or
loss if a U.S. Holder’s holding period at the time of the sale,
redemption or other taxable disposition of the ordinary
shares is longer than one year. Long-term capital gains
recognized by certain non-corporate U.S. Holders
(including individuals) are generally subject to a reduced
rate of U.S. federal income tax. The deductibility of capital
losses is subject to limitations.
Non-U.S. Holders
For purposes of this discussion, a “Non-U.S. Holder” is any
beneficial owner of an ordinary share that is neither a U.S.
Holder nor an entity or arrangement treated as a
partnership for U.S. federal income tax purposes.
Distributions
If the Group makes distributions of cash or property on the
ordinary shares, such distributions will constitute dividends
for U.S. federal income tax purposes to the extent paid from
the Group’s current or accumulated earnings and profits, as
determined under U.S. federal income tax principles.
Amounts not treated as dividends for U.S. federal income
tax purposes will constitute a return of capital and first be
applied against and reduce a Non-U.S. Holder’s adjusted tax
basis in its ordinary shares, but not below zero. Generally, a
distribution that constitutes a return of capital will be
subject to U.S. federal withholding tax at a rate of 15% if the
Non-U.S. Holders’ ordinary shares constitute a U.S. real
property interest (“USRPI”). However, we may elect to
withhold at a rate of up to 30% of the entire amount of the
distribution, even if the Non-U.S. Holders’ ordinary shares
do not constitute a USRPI. For additional information
regarding when a Non-U.S. Holder may treat its ownership
of the ordinary shares as not constituting a USRPI, refer to
the subsection below titled Sale or Other Taxable
Disposition. However, because a Non-U.S. Holder would not
have any U.S. federal income tax liability with respect to a
return of capital distribution, a Non-U.S. Holder would be
entitled to request a refund of any U.S. federal income tax
that is withheld from a return of capital distribution
(generally by timely filing a U.S. federal income tax return
for the taxable year in which the tax was withheld). Any
excess will be treated as capital gain and will be treated as
described below under the subsection titled Sale or Other
Taxable Disposition.
Subject to the discussion below on effectively connected
income, dividends paid to a Non-U.S. Holder of an ordinary
share will be subject to U.S. federal withholding tax at a rate
of 30% of the gross amount of the dividends (or such lower
rate specified by an applicable income tax treaty, provided
the Non-U.S. Holder furnishes a valid IRS Form W-8BEN or
W-8BEN-E (or other applicable documentation) certifying
qualification for the lower treaty rate). A Non-U.S. Holder
that does not timely furnish the required documentation,
but that qualifies for a reduced treaty rate, may obtain a
refund of any excess amounts withheld by timely filing an
appropriate claim for refund with the IRS. Non-U.S. Holders
should consult their tax advisors regarding their entitlement
to benefits under any applicable income tax treaty.
If dividends paid to a Non-U.S. Holder are effectively
connected with the Non-U.S. Holder’s conduct of a trade or
business within the United States (and, if required by an
applicable income tax treaty, the Non-U.S. Holder maintains
a permanent establishment in the United States to which
such dividends are attributable), the Non-U.S. Holder will be
exempt from the U.S. federal withholding tax described
above. To claim the exemption, the Non-U.S. Holder must
furnish to the applicable withholding agent a valid IRS Form
W-8ECI, certifying that the dividends are effectively
connected with the Non-U.S. Holder’s conduct of a trade or
business within the United States.
Any such effectively connected dividends will be subject to
U.S. federal income tax on a net income basis at the regular
rates. A Non-U.S. Holder that is a corporation also may be
subject to a branch profits tax at a rate of 30% (or such
lower rate specified by an applicable income tax treaty) on
such effectively connected dividends, as adjusted for
certain items. Non-U.S. Holders should consult their tax
advisors regarding any applicable tax treaties that may
provide for different rules.
Sale or Other Taxable Disposition
Subject to the discussion below on information reporting,
backup withholding and FATCA (as defined below), a Non-
U.S. Holder will not be subject to U.S. federal income tax on
any gain realized upon the sale or other taxable disposition
of an ordinary share unless:
—the gain is effectively connected with the Non-U.S.
Holder’s conduct of a trade or business within the United
States (and, if required by an applicable income tax
treaty, the Non-U.S. Holder maintains a permanent
establishment in the United States to which such gain is
attributable);
—the Non-U.S. Holder is a nonresident alien individual
present in the United States for 183 days or more during
the taxable year of the disposition and certain other
requirements are met; or
—our ordinary shares constitute a USRPI because we are
(or have been during the shorter of the five-year period
ending on the date of the disposition or the Non-U.S.
Holder’s holding period) a U.S. real property holding
corporation (“USRPHC”) for U.S. federal income tax
purposes.
Gain described in the first bullet point above generally will
be subject to U.S. federal income tax on a net income basis
at the regular rates. A Non-U.S. Holder that is a corporation
also may be subject to a branch profits tax at a rate of 30%
(or such lower rate specified by an applicable income tax
treaty) on such effectively connected gain, as adjusted for
certain items.
A Non-U.S. Holder described in the second bullet point
above will be subject to U.S. federal income tax at a rate of
30% (or such lower rate specified by an applicable income
tax treaty) on gain realized upon the sale or other taxable
disposition of our ordinary shares, which may be offset by
U.S. source capital losses of the Non-U.S. Holder (even
though the individual is not considered a resident of the
United States), provided the Non-U.S. Holder has timely
filed U.S. federal income tax returns with respect to
such losses.
With respect to the third bullet point above, due to the
nature of our assets and operations, the Group believes it is
(and will continue to be) a USRPHC under the Code and the
ordinary shares constitute (and we expect the ordinary
shares to continue to constitute) a USRPI. Non-U.S. Holders
generally are subject to a 15% withholding tax on the
amount realized from a sale or other taxable disposition of
a USRPI, such as the ordinary shares, which is required to
be collected from any sale or disposition proceeds.
Furthermore, such Non-U.S. Holders are subject to U.S.
federal income tax (at the regular rates) in respect of any
gain on their sale or disposition of the ordinary shares and
are required to file a U.S. tax return to report such gain and
pay any tax liability that is not satisfied by withholding. Any
gain should be determined in U.S. dollars, based on the
excess, if any, of the U.S. dollar value of the consideration
received over the Non-U.S. Holder’s basis in the ordinary
shares determined in U.S. dollars under the rules applicable
to Non-U.S. Holders. A Non-U.S. Holder may, by filing a U.S.
tax return, be able to claim a refund for any withholding tax
deducted in excess of the tax liability on any gain. However,
if the ordinary shares are considered “regularly traded on
an established securities market” (within the meaning of the
Treasury Regulations) then Non-U.S. Holders will not be
subject to the 15% withholding tax on the disposition of
their ordinary shares, even if such ordinary shares
constitute USRPIs. Moreover, if the ordinary shares are
considered “regularly traded on an established securities
market” (within the meaning of the Treasury Regulations)
and the Non-U.S. Holder actually or constructively owns or
owned, at all times during the shorter of the five-year
period ending on the date of the disposition or the Non-U.S.
Holder’s holding period, 5% or less of the ordinary shares
taking into account applicable constructive ownership rules,
such Non-U.S. Holder may treat its ownership of the
ordinary shares as not constituting a USRPI and will not be
subject to U.S. federal income tax on any gain realized upon
the sale or other taxable disposition of the ordinary shares
(in addition to not being subject to the 15% withholding tax
described above) or U.S. tax return filing requirements. The
Group expects the ordinary shares to be treated as
“regularly traded on an established securities market” so
long as the ordinary shares are listed on the NYSE and
regularly quoted by brokers or dealers making a market in
such ordinary shares.
Non-U.S. Holders should consult their tax advisors
regarding tax consequences of our treatment as a USRPHC
and regarding potentially applicable income tax treaties
that may provide for different rules.
Information Reporting and Backup Withholding
U.S. Holders
Information reporting requirements generally will apply to
payments of distributions on the ordinary shares and the
proceeds of a sale of an ordinary share paid to a U.S. Holder
unless the U.S. Holder is an exempt recipient and, if
requested, certifies as to that status. Backup withholding
generally will apply to those payments if the U.S. Holder
fails to provide an appropriate certification with its correct
taxpayer identification number or certification of exempt
status. Any amounts withheld under the backup
withholding rules will be allowed as a refund or credit
against a U.S. Holder’s U.S. federal income tax liability,
provided the required information is timely furnished to
the IRS.
Non-U.S. Holders
Payments of dividends on the ordinary shares will not be
subject to backup withholding, provided the applicable
withholding agent does not have actual knowledge or
reason to know the Non-U.S. Holder is a United States
person and the Non-U.S. Holder either certifies its non-U.S.
status, such as by furnishing a valid IRS Form W-8BEN,
W-8BEN-E, or W-8ECI, or otherwise establishes an
exemption. However, information returns are required to be
filed with the IRS in connection with any distributions on
our ordinary shares paid to the Non-U.S. Holder, regardless
of whether such distributions constitute dividends or
whether any tax was actually withheld. In addition,
proceeds of the sale or other taxable disposition of our
ordinary shares within the United States or conducted
through certain U.S.-related brokers generally will not be
subject to backup withholding or information reporting if
the applicable withholding agent receives the certification
described above and does not have actual knowledge or
reason to know that such holder is a United States person
or the holder otherwise establishes an exemption. Proceeds
of a disposition of our ordinary shares conducted through a
non-U.S. office of a non-U.S. broker generally will not be
subject to backup withholding or information reporting.
Copies of information returns that are filed with the IRS
may also be made available under the provisions of an
applicable treaty or agreement to the tax authorities of the
country in which the Non-U.S. Holder resides or
is established.
Backup withholding is not an additional tax. Any amounts
withheld under the backup withholding rules may be
allowed as a refund or a credit against a Non-U.S. Holder’s
U.S. federal income tax liability, provided the required
information is timely furnished to the IRS.
Additional Withholding Tax on Payments Made to
Foreign Accounts
Withholding taxes may be imposed under Sections 1471 to
1474 of the Code (such Sections commonly referred to as
the Foreign Account Tax Compliance Act, or “FATCA”) on
certain types of payments made to non-U.S. financial
institutions and certain other non-U.S. entities. Specifically,
a 30% withholding tax may be imposed on dividends on, or
(subject to the proposed Treasury Regulations discussed
below) gross proceeds from the sale or other disposition of,
our ordinary shares paid to a “foreign financial institution”
or a “non-financial foreign entity” (each as defined in the
Code), unless (1) the foreign financial institution undertakes
certain diligence and reporting obligations, (2) the non-
financial foreign entity either certifies it does not have any
“substantial United States owners” (as defined in the Code)
or furnishes identifying information regarding each
substantial United States owner, or (3) the foreign financial
institution or non-financial foreign entity otherwise qualifies
for an exemption from these rules. If the payee is a foreign
financial institution and is subject to the diligence and
reporting requirements in (1) above, it must enter into an
agreement with the U.S. Department of the Treasury
requiring, among other things, that it undertake to identify
accounts held by certain “specified United States persons”
or “United States owned foreign entities” (each as defined
in the Code), annually report certain information about such
accounts, and withhold 30% on certain payments to non-
compliant foreign financial institutions and certain other
account holders. Foreign financial institutions located in
jurisdictions that have an intergovernmental agreement
with the United States governing FATCA may be subject to
different rules.
Under the applicable Treasury Regulations and
administrative guidance, withholding under FATCA
generally applies to payments of dividends on our ordinary
shares. While withholding under FATCA would have applied
also to payments of gross proceeds from the sale or other
disposition of stock, including our ordinary shares, on or
after January 1, 2019, proposed Treasury Regulations
eliminate FATCA withholding on payments of gross
proceeds entirely. Taxpayers generally may rely on these
proposed Treasury Regulations until final Treasury
Regulations are issued.
Prospective investors should consult their tax advisors
regarding the potential application of withholding under
FATCA to their investment in our ordinary shares.
DOCUMENTS ON DISPLAY
The SEC maintains an Internet site that contains reports,
proxy and information statements, and other information
regarding issuers that file electronically with the SEC. All of
the SEC filings made electronically by Diversified are
available to the public on the SEC website at www.sec.gov
(commission file number 001-41870).
We also make our electronic filings with the SEC available
at no cost on our Investor Relations website,
www.ir.div.energy, as soon as reasonably practicable after
we file such material with, or furnish it to, the SEC. Our
website address is www.div.energy. The information
contained on our website is not incorporated by reference
in this document.
CONTROLS AND PROCEDURES
This Annual Report & Form 20-F does not include a report
of management’s assessment regarding internal control
over financial reporting or an attestation report of the
Group’s registered public accounting firm due to a
transition period established by rules of the Securities and
Exchange Commission for newly public companies.
Glossary of Terms
£
British pound sterling
$
U.S. dollar
ABS
Asset-Backed Security
Adjusted EBITDA
Adjusted EBITDA is an APM. Please
& Form 20-F for information on how
this metric is calculated and
reconciled to IFRS measures.
Adjusted EBITDA margin
Adjusted EBITDA margin is an APM.
Additional Information within this
Annual Report & Form 20-F for
information on how this metric is
calculated and reconciled to IFRS
measures.
Adjusted operating cost
Adjusted operating cost is an APM.
Additional Information within this
Annual Report & Form 20-F for
information on how this metric is
calculated and reconciled to
IFRS measures.
Adjusted operating cost per Mcfe
Adjusted operating cost per Mcfe
within this Annual Report & Form 20-
F for information on how this metric
is calculated and reconciled to
IFRS measures.
AIM
Alternative Investment Market
APM
Alternative Performance Measure
Bbl
Barrel or barrels of oil or natural
gas liquids
Bcfe
Billions of cubic fee equivalent
Board or BOD
Board of Directors
Boe
Barrel of oil equivalent, determined
by using the ratio of one Bbl of oil or
NGLs to six Mcf of natural gas. The
ratio of one barrel of oil or NGLs to
six Mcf of natural gas is commonly
used in the industry and represents
the approximate energy equivalence
of oil or NGLs to natural gas, and
does not represent the economic
equivalency of oil and NGLs to natural
gas. The sales price of a barrel of oil
or NGLs is considerably higher than
the sales price of six Mcf of
natural gas.
Boepd
Barrels of oil equivalent per day
Btu
A British thermal unit, which is a
measure of the amount of energy
required to raise the temperature
of one pound of water one
degree Fahrenheit.
CO2
Carbon dioxide
CO2e
Carbon dioxide equivalent
CEO
Chief Executive Officer
CFO
Chief Financial Officer
COO
Chief Operating Officer
DD&A
Depreciation, depletion
and amortization
E&P
Exploration and production
EBITDA
Earnings before interest, tax,
depreciation and amortization
EBITDAX
Earnings before interest, tax,
depreciation, amortization and
exploration expense
Employees, administrative costs and
professional services
Employees, administrative costs and
professional services is an APM.
Additional Information within this
Annual Report & Form 20-F for
information on how this metric is
calculated and reconciled to
IFRS measures.
EPA
Environmental Protection Agency
EPS
Earnings per share
ERM
Enterprise Risk Management
ESG
Environmental, Social
and Governance
EU
European Union
Free cash flow
Free cash flow is an APM. Please refer
& Form 20-F for information on how
this metric is calculated and
reconciled to IFRS measures.
FTSE
Financial Times Stock Exchange
G&A
General and administrative expense
GBP
British pound sterling
Henry Hub
A natural gas pipeline delivery point
that serves as the benchmark natural
gas price underlying NYMEX natural
gas futures contracts.
IAS
International Accounting Standard
IASB
International Accounting
Standards Board
IPO
Initial public offering
IFRS
International Financial
Reporting Standards
KWh
Kilowatt hour
LIBOR
London Inter-bank Offered Rate
LOE
Base lease operating expense is
defined as the sum of employee and
benefit expenses, well operating
expense (net), automobile expense
and insurance cost.
LSE
London Stock Exchange
M&A
Mergers and acquisitions
Mbbls
Thousand barrels
Mboe
Thousand barrels of oil equivalent
Mboepd
Thousand barrels of oil equivalent
per day
Mcf
Thousand cubic feet of natural gas
Mcfe
Thousand cubic feet of natural
gas equivalent
Midstream
Midstream activities include the
processing, storing, transporting and
marketing of natural gas, NGLs
and oil.
Mmboe
Million barrels of oil equivalent
Mmbtu
Million British thermal units
Mmcf
Million cubic feet of natural gas
Mmcfe
Million cubic feet of natural
gas equivalent
Mont Belvieu
A mature trading hub with a high
level of liquidity and transparency
that sets spot and futures prices
for NGLs.
MT CO2e
Metric ton of carbon
dioxide equivalent
Motor Vehicle Accidents (“MVA”)
MVA is the rate of preventable
accidents per million miles driven.
MT
Metric ton
Net debt
Net debt is an APM. Please refer to
& Form 20-F for information on how
this metric is calculated and
reconciled to IFRS measures.
Net zero
Achieving an overall balance between
carbon emissions produced and
carbon emissions taken out of the
atmosphere, which includes making
changes to reduce emissions to the
lowest amount and offsetting as a
last resort. For Diversified net zero
means total Scope 1 and 2
GHG emissions.
NGLs
Natural gas liquids, such as ethane,
propane, butane and natural gasoline
that are extracted from natural gas
production streams.
NYMEX
New York Mercantile Exchange
Oil
Includes crude oil and condensate
PSU
Performance stock unit
PV-10
A calculation of the present value of
estimated future natural gas and oil
revenues, net of forecasted direct
expenses, and discounted at an
annual rate of 10%. This calculation
does not consider income taxes and
utilizes a pricing assumption
consistent with the forward curve at
December 31, 2023.
Realized price
The cash market price less all
expected quality, transportation and
demand adjustments.
RSU
Restricted stock unit
SAM
Smarter Asset Management
SOFR
Secured Overnight Financing Rate
TCFD
Task Force on Climate-Related
Financial Disclosures
Total Recordable Incident Rate
(“TRIR”)
TRIR is the number of work-related
injuries per 200,000 work hours.
Total revenue, inclusive of settled
hedges
Total revenue, inclusive of settled
hedges, is an APM. Please refer to the
& Form 20-F for information on how
this metric is calculated and
reconciled to IFRS measures.
TSR
Total Shareholder Return
TTM
Trailing twelve months
UK
United Kingdom
U.S.
United States
USD
U.S. dollar
WTI
West Texas Intermediate grade crude
oil, used as a pricing benchmark for
sales contracts and NYMEX oil
futures contracts.
Exhibits
The following documents are filed in the Securities and Exchange Commission (“SEC”) EDGAR system, as part of this Annual
Report on Form 20-F, and can be viewed on the SEC’s website.
Exhibit
No.
|
Incorporated by reference
(File No. 001-41870, unless
otherwise indicated)
|
||||
Description |
Form |
Exhibit |
Filing Date |
||
1.1 |
(c) |
20FR12B |
1.1 |
11/16/2023 |
|
1.2 |
(c) |
20FR12B |
1.2 |
11/16/2023 |
|
2.1 |
(c) |
20FR12B |
2.1 |
11/16/2023 |
|
4.1 |
(c)(f) |
20FR12B |
4.1 |
11/16/2023 |
|
4.2 |
(c)(f) |
20FR12B |
4.2 |
11/16/2023 |
|
4.3 |
(c)(f) |
20FR12B |
4.3 |
11/16/2023 |
|
4.4 |
(c)(f) |
20FR12B |
4.4 |
11/16/2023 |
|
4.5 |
(c)(f) |
20FR12B |
4.5 |
11/16/2023 |
|
4.6 |
(c)(f) |
20FR12B |
4.6 |
11/16/2023 |
|
4.7 |
(c)(f) |
20FR12B |
4.7 |
11/16/2023 |
|
4.8 |
(c)(f) |
20FR12B |
4.8 |
11/16/2023 |
|
4.9 |
(c)(f) |
20FR12B |
4.9 |
11/16/2023 |
|
4.10 |
(c)(f) |
20FR12B |
4.10 |
11/16/2023 |
|
4.11 |
(c)(f) |
20FR12B |
4.11 |
11/16/2023 |
|
4.12 |
(c)(f) |
20FR12B |
4.12 |
11/16/2023 |
|
4.13 |
(c)(f) |
20FR12B |
4.13 |
11/16/2023 |
|
Exhibit
No.
|
Incorporated by reference
(File No. 001-41870, unless
otherwise indicated)
|
||||
Description |
Form |
Exhibit |
Filing Date |
||
4.14 |
(c)(f) |
20FR12B |
4.14 |
11/16/2023 |
|
4.15 |
(c)(f) |
20FR12B |
4.15 |
11/16/2023 |
|
4.16 |
(c)(f) |
20FR12B |
4.16 |
11/16/2023 |
|
4.17 |
(c)(f) |
20FR12B |
4.17 |
11/16/2023 |
|
4.18 |
(c)(f) |
20FR12B |
4.18 |
11/16/2023 |
|
4.19 |
(c)(f) |
20FR12B |
4.19 |
11/16/2023 |
|
4.20 |
(c)(f) |
20FR12B |
4.20 |
11/16/2023 |
|
4.21 |
(c)(f) |
20FR12B |
4.21 |
11/16/2023 |
|
4.22 |
(c)(f) |
20FR12B |
4.22 |
11/16/2023 |
|
4.23 |
(c)(f) |
20FR12B |
4.23 |
11/16/2023 |
|
4.24 |
(c)(e)(f) |
20FR12B |
4.24 |
11/16/2023 |
|
4.25 |
(c)(e)(f) |
20FR12B |
4.25 |
11/16/2023 |
|
4.26 |
(c)(e)(f) |
20FR12B |
4.26 |
11/16/2023 |
|
4.27 |
(c)(e)(f) |
20FR12B |
4.27 |
11/16/2023 |
|
4.28 |
(c)(e)(f) |
20FR12B |
4.28 |
11/16/2023 |
|
4.29 |
(c)(e)(f) |
20FR12B |
4.29 |
11/16/2023 |
|
Exhibit
No.
|
Incorporated by reference
(File No. 001-41870, unless
otherwise indicated)
|
||||
Description |
Form |
Exhibit |
Filing Date |
||
4.30 |
(c)(e)(f) |
20FR12B |
4.30 |
11/16/2023 |
|
4.31 |
(c)(e)(f) |
20FR12B |
4.31 |
11/16/2023 |
|
4.32 |
(c)(d) |
20FR12B |
4.32 |
11/16/2023 |
|
4.33 |
(c)(d) |
20FR12B |
4.33 |
11/16/2023 |
|
4.34 |
(c) |
20FR12B |
4.34 |
11/16/2023 |
|
4.35 |
(c) |
20FR12B |
4.35 |
11/16/2023 |
|
8.1 |
(a) |
||||
12.1 |
(a) |
||||
13.1 |
(b) |
||||
15.1 |
(a) |
||||
15.2 |
(a) |
||||
15.3 |
(a) |
||||
99.1 |
(a) |
||||
101 |
Inline XBRL data files. |
||||
104 |
Cover page inline interactive data file (formatted as Inline XBRL and contained
in Exhibit 101).
|
||||
(a)Filed herewith.
(b)Furnished only.
(c)Previously filed.
(d)Management contract.
(e)Certain portions of this exhibit (indicated by “[***]”) have been redacted.
(f)Certain schedules and attachments have been omitted. The registrant hereby undertakes to provide further information regarding such
omitted materials to the Securities and Exchange Commission upon request.
This page intentionally left blank.

Signatures
The registrant hereby certifies that it meets all of the requirements for filing on Form 20-F and that it has duly caused and
authorized the undersigned to sign this annual report on its behalf.
Diversified Energy Company PLC
(Registrant)
/s/ Robert Russell (“Rusty”) Hutson, Jr. |
Robert Russell (“Rusty”) Hutson, Jr.
Chief Executive Officer
March 19, 2024
Diversified Energy Company PLC
1600 Corporate Drive
Birmingham, Alabama,
35242 USA
www.div.energy