10-K: Annual report [Section 13 and 15(d), not S-K Item 405]
Published on February 26, 2026
UNITED STATES SECURITIES AND EXCHANGE COMMISSION
Washington, D.C. 20549
FORM 10-K
(Mark One)
For the fiscal year ended December 31 , 2025
or
For the transition period from to
Commission file number: 001-41870
(Exact name of registrant as specified in its charter) | ||||
State or other jurisdiction of incorporation or organization | (I.R.S. Employer Identification No.) | |||
(Address of principal executive offices) | (Zip Code) | |||
Registrant’s telephone number, including area code: | ( |
Securities registered, pursuant to Section 12(b) of the Act:
Title of each class | Trading Symbol(s) | Name of each exchange on which registered | ||
London Stock Exchange |
Securities registered, pursuant to Section 12(g) of the Act: None
Indicate by check mark if the registrant is a well-known seasoned issuer, as defined in Rule 405 of the Securities Act. Yes þ No ¨
Indicate by check mark if the registrant is not required to file reports pursuant to Section 13 or Section 15(d) of the Act. Yes ¨ No þ
Indicate by check mark whether the registrant (1) has filed all reports required to be filed by Section 13 or 15(d) of the Securities Exchange Act of 1934 during the
preceding 12 months (or for such shorter period that the registrant was required to file such reports), and (2) has been subject to such filing requirements for the past 90
days. Yes þ No ¨
Indicate by check mark whether the registrant has submitted electronically every Interactive Data File required to be submitted pursuant to Rule 405 of Regulation S-T
(§232.405 of this chapter) during the preceding 12 months (or for such shorter period that the registrant was required to submit such files). Yes þ No ¨
Indicate by check mark whether the registrant is a large accelerated filer, an accelerated filer, a non-accelerated filer, a smaller reporting company, or an emerging
growth company. See the definitions of “large accelerated filer,” “accelerated filer,” “smaller reporting company,” and “emerging growth company” in Rule 12b-2 of
the Exchange Act.
þ | Accelerated filer | ¨ | |||
Non-accelerated filer | ¨ | Smaller reporting company | |||
Emerging growth company |
If an emerging growth company, indicate by check mark if the registrant has elected not to use the extended transition period for complying with any new or revised
financial accounting standards provided pursuant to Section 13(a) of the Exchange Act. ¨
Indicate by check mark whether the registrant has filed a report on and attestation to its management’s assessment of the effectiveness of its internal control over
financial reporting under Section 404(b) of the Sarbanes-Oxley Act (15 U.S.C. 7262(b)) by the registered public accounting firm that prepared or issued its audit report.
If securities are registered pursuant to Section 12(b) of the Act, indicate by check mark whether the financial statements of the registrant included in the filing reflect the
correction of an error to previously issued financial statements. ¨
Indicate by check mark whether any of those error corrections are restatements that required a recovery analysis of incentive-based compensation received by any of the
registrant’s executive officers during the relevant recovery period pursuant to §240.10D-1(b). ¨
Indicate by check mark whether the registrant is a shell company (as defined in Rule 12b-2 of the Exchange Act). Yes ¨ No þ
The aggregate market value of the Common Stock held by non-affiliates of the registrant on June 30, 2025, based on the closing price of the Common Stock on the New
York Stock Exchange on such date, was approximately $814 million.
The registrant had 76,070,756 shares of common stock outstanding (excluding shares held by the Employee Benefit Trust) as of February 25, 2026.
DOCUMENTS INCORPORATED BY REFERENCE
Form 10-K. Such definitive proxy statement or an amendment to this Annual Report on Form 10-K will be filed no later than 120 days after December 31, 2025.
Form 10-K | Diversified Energy Company |
Table of Contents
Page | ||
Form 10-K | Diversified Energy Company |
Glossary of Terms
£ - British pound sterling
ABS - Asset-Backed Security
ASU - Accounting Standards Updates
Bbl - Barrel or barrels of oil or natural gas liquids
Board - Board of Directors
Btu - A British thermal unit, which is a measure of the amount
of energy required to raise the temperature of one pound of
water one degree Fahrenheit.
E&P - Exploration and production
EBITDAX - Earnings before interest, tax, depreciation,
amortization and exploration expense
EHS - Environmental, health & safety
EPA - Environmental Protection Agency
EPS - Earnings per share
GAAP - U.S. General Accepted Accounting Principles
GHG - Greenhouse gas
Henry Hub - A natural gas pipeline delivery point that serves
as the benchmark natural gas price underlying NYMEX natural
gas futures contracts.
LSE - London Stock Exchange
Mbbls - Thousand barrels
Mcf - Thousand cubic feet of natural gas
Mcfe - Thousand cubic feet of natural gas equivalent
Midstream - Midstream activities include the processing,
storing, transporting and marketing of natural gas, NGLs
and oil.
Mmbtu - Million British thermal units
Mmcf - Million cubic feet of natural gas
Mmcfe - Million cubic feet of natural gas equivalent
Mont Belvieu - A mature trading hub with a high level of
liquidity and transparency that sets spot and futures prices
for NGLs.
NGLs - Natural gas liquids, such as ethane, propane, butane
and natural gasoline that are extracted from natural gas
production streams.
NYMEX - New York Mercantile Exchange
NYSE - New York Stock Exchange
Oil - Includes crude oil and condensate
OSHA - Occupational Safety and Health Administration
PSU - Performance-based restricted stock unit
PV-10 - PV-10 is a non-GAAP financial measure that
represents the present value of estimated future cash inflows
from proved oil and gas reserves, less future development and
production costs, discounted at 10% per annum to reflect the
timing of future cash flows and utilizes an SEC pricing
assumption. PV-10 is derived from the standardized measure of
discounted future net cash flows (the “Standardized Measure”),
which is the most comparable financial measure calculated in
accordance with GAAP. PV-10 differs from the Standardized
Measure in that PV-10 excludes the effects of income taxes on
future net revenues. We believe the presentation of PV-10 is
relevant and useful to investors because it provides the
discounted future net cash flows attributable to our proved
reserves without regard to any of our specific income tax
characteristics and is a useful measure for evaluating the
relative monetary significance of our oil and natural gas
properties. Investors may use PV-10 as a basis for comparing
the relative size and value of our proved reserves to that of
other companies. PV-10 should not be considered as a
substitute for, or more meaningful than, the Standardized
Measure. Neither PV-10 nor the Standardized Measure
represents an estimate of the fair market value of our oil and
natural gas properties.
Realized price - The cash market price less all expected
quality, transportation and demand adjustments.
ROU - Right-of-use asset
RSU - Restricted stock unit
SOFR - Secured Overnight Financing Rate
TSR - Total Shareholder Return
UK - United Kingdom
Upstream - Upstream activities include exploration, discovery,
and extracting of natural gas, NGLS, and oil. Often referred to
as exploration and production activities, or E&P.
WTI - West Texas Intermediate grade crude oil, used as a
pricing benchmark for sales contracts and NYMEX oil
futures contracts.
Form 10-K | Diversified Energy Company |
Explanatory Note
On November 21, 2025, Diversified Energy Company PLC, a public company limited by shares, incorporated under the laws of
England and Wales, completed a redomestication to the United States, which was approved by the shareholders of Diversified Energy
Company PLC, resulting in Diversified Energy Company, a Delaware corporation, becoming our publicly traded parent company (the
“U.S. Domestication”). Immediately prior to the effective time of the U.S. Domestication, existing shares of Diversified Energy
Company PLC were exchanged on a one-for-one basis for newly issued shares of corresponding common stock of Diversified Energy
Company, and all issued and outstanding equity awards of Diversified Energy Company PLC were assumed by Diversified Energy
Company and were converted into rights to acquire Diversified Energy Company shares of common stock on the same terms. As a
result, all outstanding shareholders of Diversified Energy Company PLC became common stockholders of Diversified Energy
Company. Following the U.S. Domestication, the listing of the common stock of Diversified Energy Company on the New York Stock
Exchange and the equity shares (International Commercial Companies Secondary Listing) category of the Official List of the FCA and
the trading on the London Stock Exchange’s main market for listed securities became effective on November 24, 2025. Throughout
this Annual Report on Form 10-K, references to “Diversified,” “DEC”, the “Company,” “our,” “we” and “us” (i) for periods until the
completion of the U.S. Domestication, refer to Diversified Energy Company PLC and (ii) for periods at or after the completion of the
U.S. Domestication, refer to Diversified Energy Company.
Forward-Looking Statements
This Annual Report on Form 10-K contains forward-looking statements that can be identified by the following terminology, including
the terms “may,” “might,” “will,” “could,” “would,” “should,” “expect,” “plan,” “anticipate,” “intend,” “seek,” “believe,” “estimate,”
“predict,” “potential,” “continue,” “contemplate,” “possible,” or the negative of these terms or other variations or comparable
terminology, or by discussions of strategy, plans, objectives, goals, future events or intentions. These forward-looking statements
include all matters that are not historical facts. They appear in a number of places throughout this Annual Report on Form 10-K and
include, but are not limited to, statements regarding our intentions, beliefs or current expectations concerning, among other things, our
results of operations, financial positions, liquidity, prospects, growth, strategies and the natural gas and oil industry. By their nature,
forward-looking statements involve risk and uncertainty because they relate to future events and circumstances.
Forward-looking statements are not guarantees of future performance and the actual results of our operations, financial position and
liquidity, and the development of the markets and the industry in which we operate, may differ materially from those described in, or
suggested by, the forward-looking statements contained in this Annual Report on Form 10-K. In addition, even if the results of
operations, financial position and liquidity, and the development of the markets and the industry in which we operate are consistent
with the forward-looking statements contained in this Annual Report on Form 10-K, those results or developments may not be
indicative of results or developments in subsequent periods. A number of factors could cause results and developments to differ
materially from those expressed or implied by the forward-looking statements including, without limitation, general economic and
business conditions, the behavior of other market participants, industry trends, competition, commodity prices, changes in regulation,
currency fluctuations, our ability to recover our reserves, our ability to successfully integrate acquisitions, our ability to obtain
financing to meet liquidity needs, changes in our business strategy, political and economic uncertainty.
Forward-looking statements may, and often do, differ materially from actual results. Any forward-looking statements in this Annual
Report on Form 10-K speak only as of the date of this Annual Report on Form 10-K, reflect our current view with respect to future
events and are subject to risks relating to future events and other risks, uncertainties and assumptions relating to our operations, results
of operations, growth strategy and liquidity. Investors should specifically consider the factors identified in this Annual Report on Form
10-K which could cause actual results to differ before making an investment decision. Subject to the requirements of the Public Offers
and Admissions to Trading Regulations 2024, the Prospectus Rules: Admission to Trading on a Regulated Market of the Financial
Conduct Authority, we explicitly disclaim any obligation or undertaking to revise any forward-looking statements in this Annual
Report on Form 10-K that may occur due to any change in our expectations or to reflect events or circumstances after the date of this
Annual Report on Form 10-K except as may be required by applicable law.
4
Form 10-K | Diversified Energy Company |
PART I
Item 1. Business
Business Overview
We are engaged in the production, transportation, and marketing of natural gas, NGLs, and oil, managing a diversified portfolio of
mature, long-life assets. Our assets are located in the United States within the following geographical operating areas:
•Appalachian Region, which spans Ohio, Pennsylvania, Virginia, West Virginia, Kentucky, Tennessee and Alabama;
•Central Region, which includes Texas, Oklahoma, New Mexico, Louisiana and Arkansas;
•Other, which includes Florida and Wyoming.
Our business model emphasizes responsible stewardship and operational excellence, focusing on maximizing value from existing
reserves.
Our disciplined, full-lifecycle asset management approach is central to our success. We focus on optimizing and extending the
productive life of existing wells, using advanced monitoring technologies and data analytics to drive operational efficiency and safety.
In addition to our work on our producing wells, we have an extensive and innovative asset retirement program that consists of a
vertically integrated plugging company based in our Appalachian Region. With over 69,000 total net productive wells, we produced
an annual average of 1,086 MMcfepd during the year ended December 31, 2025, and we are well-positioned to maximize asset value
while maintaining a sound balance sheet and upholding high standards for safety and environmental responsibility.
Our strategy is designed to deliver consistent shareholder returns and long-term value through disciplined growth and operational
excellence.
•We maintain a diversified asset base that supports stable and predictable production.
•Our efficient capital investment process enables us to pursue growth opportunities and optimize returns.
•Operational reliability is enhanced by robust infrastructure and a focus on preventative maintenance.
•We execute a disciplined commodity hedging program that is designed to mitigate price volatility.
•Our experienced leadership team drives disciplined execution and strategic decision-making.
•We have a proven track record of integrating new assets efficiently and realizing operational synergies.
2025 Highlights
•Average daily production of 1,086 MMcfepd representing an increase of 37% when compared to 791 MMcfepd for the same
period in 2024;
•In November 2025, we acquired Canvas Energy Inc. (“Canvas”) for total consideration of approximately $533 million. The
transaction was funded through the issuance of 3,718,209 shares of common stock and approximately $399 million in cash. The
cash portion of the consideration was primarily funded through the issuance of the ABS XI Notes with a total principal amount of
$400 million. The ABS XI Notes are secured by certain upstream producing assets acquired in the Canvas acquisition;
•In November 2025, we completed the U.S. Domestication, resulting in Diversified Energy Company, a Delaware corporation,
becoming our publicly traded parent company;
•In October 2025, we launched a well plugging fund with the state of West Virginia dedicated to retiring oil and gas wells. Over
the initial 20 year period of the agreement, we plan to invest $70 million, which is held and guaranteed by OneNexus, an
insurance provider for asset retirement obligations, to ensure we have provided financial assurance so that all of our wells in the
state are safely retired. The State of West Virginia is a third party beneficiary of the plugging fund;
•In April 2025, we issued $300 million of new senior secured notes in the Nordic bond market at a 2% discount, resulting in net
proceeds of $294 million (the “Nordic Bonds”);
•In March 2025, we acquired Maverick Natural Resources, LLC (“Maverick”) for net consideration of $666 million. The gross
value of the transaction was approximately $1.3 billion and was funded through the issuance of 21,194,213 shares of common
stock direct to the unitholders of Maverick, and approximately $211 million in cash. The transaction also included the assumption
of approximately $518 million of ABS Maverick Notes outstanding and the payoff of $202 million outstanding on Maverick’s
credit facility on the acquisition date;
•In March 2025, concurrent with the Maverick acquisition, we amended and restated the credit agreement governing our revolving
loan facility (the “Credit Facility”), increasing the borrowing base to $900 million and extending the maturity to March 2029.
During our semi-annual redetermination in October 2025, the borrowing base was reduced to $825 million;
•In February 2025, we formed Diversified ABS Phase X LLC, a limited-purpose, bankruptcy-remote, wholly-owned subsidiary
(“ABS X”), to issue asset-backed securities with a total principal amount of $530 million (the “ABS X Notes”);
5
Form 10-K | Diversified Energy Company |
•In February 2025 , we issued 8,500,000 shares of common stock at $14.50 per share to raise gross proceeds of $123 million;
•In February 2025, we acquired certain upstream assets and related infrastructure in the Appalachian Region from Summit Natural
Resources, LLC (“Summit”) for $42 million; and
•In 2025, we divested certain non-core undeveloped acreage across our operating footprint for consideration of approximately
$160 million.
Refer to Notes 3, 11, and 15 in the Notes to the Consolidated Financial Statements for additional information regarding acquisitions,
common stock, and debt.
Geographical Operating Areas
Our operations are primarily concentrated within the Appalachian and Central regions of the United States. Our Appalachian Region
spans Pennsylvania, Ohio, Virginia, West Virginia, Kentucky, Tennessee and Alabama and consists of multiple productive, shallow
conventional formations and two productive, deeper unconventional shale formations, the Marcellus Shale and the slightly deeper
Utica Shale. Our Central Region consists of the Bossier and Haynesville shale formations and the Cotton Valley sandstones in East
Texas and West Louisiana, the Barnett Shale in North Texas and the Mid-Continent producing areas across Central Texas, along with
the Anadarko Basin across North Texas and Oklahoma and Permian Basin in West Texas and New Mexico.
Reserve Data
Summary of Reserves
The following table sets forth summary information with respect to our estimated proved reserves, standardized measure of discounted
future net cash flows (“Standardized Measure”) and PV-10 as of December 31, 2025. Our estimated proved reserves were prepared by
Netherland, Sewell & Associates, Inc. (“NSAI”), our independent third-party reserve engineers. A copy of the reserve report is
included as an exhibit to this Annual Report on Form 10-K. We used SEC pricing in the calculation of our estimated proved reserves
and PV-10.
As of December 31, 2025 | |
Proved developed reserves | |
Natural gas (MMcf) | 4,224,112 |
NGLs (MBbls) | 159,025 |
Oil (MBbls) | 87,041 |
Total proved developed reserves (MMcfe)(a) | 5,700,508 |
Proved undeveloped reserves | |
Natural gas (MMcf) | 201,621 |
NGLs (MBbls) | 5,950 |
Oil (MBbls) | 24,109 |
Total proved undeveloped reserves (MMcfe)(a) | 381,975 |
Total proved reserves | |
Natural gas (MMcf) | 4,425,733 |
NGLs (MBbls) | 164,975 |
Oil (MBbls) | 111,150 |
Total proved reserves (MMcfe)(a) | 6,082,483 |
Proved developed reserves % | 94% |
Proved undeveloped reserves % | 6% |
12-Month Average Realized Prices(b) | |
Natural gas ($/Mmbtu) | $3.39 |
Oil and NGLs ($/Bbl) | $66.01 |
6
Form 10-K | Diversified Energy Company |
As of December 31, 2025 | |
Standardized measure of discounted future net cash flows (GAAP) (in thousands) | $4,182,484 |
PV-10 (Non-GAAP)(in thousands) | |
Proved developed PV-10 | $4,825,578 |
Proved undeveloped PV-10 | 353,873 |
Total PV-10 (Non-GAAP)(c) | $5,179,451 |
(a)The basis for converting oil and NGL volumes (MBbls) to natural gas equivalent volumes (MMcfe) is determined by using the
ratio of one Bbl of oil or NGLs to six Mcf of natural gas.
(b)Our estimated net proved reserves were determined using average first-day-of-the-month prices for the prior 12 months in
accordance with SEC guidance. For natural gas, NGLs, and oil volumes, the average Henry Hub spot price and WTI price were
adjusted for gravity, quality, local conditions, gathering and transportation fees, and distance from market. All prices are held
constant throughout the lives of the properties.
(c)The PV-10 of our proved reserves were prepared without giving effect to taxes or hedges. PV-10 is a non-GAAP financial
measure and generally differs from Standardized Measure, the most directly comparable GAAP measure, because it does not
include the effects of income taxes on future net cash flows. We believe that the presentation of PV-10 is relevant and useful to our
investors as supplemental disclosure to the Standardized Measure because it presents the discounted future net cash flows
attributable to our reserves prior to taking into account future corporate income taxes and our current tax structure. While the
Standardized Measure is free cash dependent on the unique tax situation of each company, PV-10 is based on a pricing
methodology and discount factors that are consistent for all companies. Because of this, PV-10 can be used within the industry
and by creditors and securities analysts to evaluate estimated net cash flows from proved reserves on a more comparable basis.
Investors should be cautioned that neither PV-10 nor the Standardized Measure represents an estimate of the fair market value of
our proved reserves.
Reconciliation of Standardized Measure (GAAP) to PV-10 (Non-GAAP)
(in thousands) | As of December 31, 2025 |
Standardized measure of discounted future net cash flows (GAAP) | $4,182,484 |
Add: present value of future income taxes discounted at 10% per annum | 996,967 |
PV-10 (Non-GAAP) | $5,179,451 |
Proved Reserves
As of December 31, 2025, our estimated proved reserves totaled 6,082,483 MMcfe, an increase of 68% from the prior year-end, with a
Standardized Measure of $4.2 billion. Natural gas constituted approximately 73% of our total estimated proved reserves and 74% of
our total estimated proved developed reserves. The following table provides a summary of the changes in our proved reserves during
the year ended December 31, 2025.
Total (MMcfe)(a) | |
Total proved reserves as of December 31, 2024 | 3,627,589 |
Extensions and discoveries | 16,341 |
Revisions to previous estimates | 793,516 |
Purchase of reserves in place | 2,041,296 |
Sales of reserves in place | — |
Production | (396,259) |
Total proved reserves as of December 31, 2025 | 6,082,483 |
(a)The basis for converting oil and NGL volumes (MBbls) to natural gas equivalent volumes (MMcfe) is determined by using the
ratio of one Bbl of oil or NGLs to six Mcf of natural gas.
Revisions to Previous Estimates
During 2025, we recorded 793,516 MMcfe in revisions to previous estimates. The upward revisions were primarily associated with
changes in the trailing 12-month average realized Henry Hub first day of the month spot price, which increased approximately 59% as
compared to December 31, 2024.
7
Form 10-K | Diversified Energy Company |
Purchase of Reserves in Place
During 2025, 2,041,296 MMcfe of purchases of reserves in place were associated with the Summit, Maverick, and Canvas
acquisitions. Refer to Note 3 in the Notes to the Consolidated Financial Statements for additional information about acquisitions and
divestitures.
Proved Undeveloped Reserves (“PUDs”)
We aim to obtain proved developed producing wells through acquisitions in accordance with our growth strategy rather than through
development activities. We accordingly contribute limited capital to development activities. From time to time, when acquiring
packages of wells, we also acquire certain locations that are in development by the acquiree at the time of the acquisition or could be
developed in the future. When economic, we may engage third parties to complete the existing development activities or may
participate in the development of acquired non-operated locations, and such reserves are included below as PUDs. As of December 31,
2025, we are actively engaged or have plans to engage in developing certain locations acquired in the Maverick and Canvas
acquisitions. Therefore, we have classified these undrilled locations as PUDs.
The following table summarizes the changes in our estimated PUDs during the year ended December 31, 2025:
Total (MMcfe) | |
Proved undeveloped reserves as of December 31, 2024 | — |
Extensions and discoveries | 16,341 |
Revisions to previous estimates | — |
Purchase of reserves in place | 365,634 |
Sales of reserves in place | — |
Converted to proved developed reserves | — |
Proved undeveloped reserves as of December 31, 2025 | 381,975 |
Purchase of Reserves in Place
During 2025, there were 365,634 MMcfe of purchases of PUDs in place related to the Maverick and Canvas acquisitions. Refer to
Note 3 in the Notes to the Consolidated Financial Statements for additional information about acquisitions and divestitures.
Preparation of Reserve Estimates
Our reserve estimates as of December 31, 2025 included in this Annual Report on Form 10-K were prepared by our independent
reserves auditors, Netherland, Sewell & Associates, Inc. (“NSAI”), in accordance with petroleum engineering and evaluation
standards published by The Petroleum Resources Management System jointly sponsored by the Society of Petroleum Engineers, the
World Petroleum Council, the American Association of Petroleum Geologists and the Society of Petroleum Evaluation Engineers.
These estimates have been prepared in accordance with the definitions and regulations of the SEC.
Our internal staff of petroleum engineers and geoscience professionals work diligently to ensure the integrity, accuracy and timeliness
of data furnished to our independent reserves auditors for their reserve evaluation process. Our technical team regularly meets with the
independent reserves auditors to review properties and discuss methods and assumptions used to prepare reserve estimates. The
reserve estimates and related reports are reviewed and approved by our Vice President of Reservoir Engineering. The Vice President
of Reservoir Engineering holds a Bachelor of Science in Petroleum Engineering and has been with the Company since 2018 with 27
years of experience in petroleum engineering and over 24 years of experience evaluating natural gas and oil reserves. Prior to joining
the Company in 2018, our Vice President of Reservoir Engineering, who is an active member of the Society of Petroleum Engineers,
served in various reservoir engineering roles for public companies engaged in exploration and production operations.
Estimation of Proved Reserves
Proved reserves are quantities of natural gas or oil which, by analysis of geoscience and engineering data, can be estimated with
reasonable certainty to be commercially recoverable from known reservoirs under existing economic and operating conditions. The
term “reasonable certainty” implies a high degree of confidence that the quantities of natural gas or oil actually recovered will equal or
exceed the estimate. To achieve reasonable certainty, DEC and the independent reserves auditors employed technologies that have
been demonstrated to yield results with consistency and repeatability. The technologies and economic data used in the estimation of
our proved reserves may include, but are not limited to, well logs, geologic maps and available downhole and production data, and
well-test data.
Reserves engineering is and must be recognized as a subjective process of estimating volumes of economically recoverable oil and
natural gas that cannot be measured in an exact manner. The accuracy of any reserve estimate is a function of the quality of available
data and of engineering and geological interpretation. As a result, the estimates of different engineers often vary. In addition, the
results of drilling, testing and production may justify revisions of such estimates. Accordingly, reserve estimates often differ from the
8
Form 10-K | Diversified Energy Company |
quantities of natural gas, NGLs and oil that are ultimately recovered. Estimates of economically recoverable natural gas, NGLs and oil
and of future net cash flows are based on a number of variables and assumptions, all of which may vary from actual results, including
geologic interpretation, prices and future production rates and costs. See Item 1A. Risk Factors for additional information.
Developed and Undeveloped Acreage
The following table sets forth certain information regarding the total developed and undeveloped acreage in which we owned an
interest as of December 31, 2025. Developed acres are acres spaced or assigned to productive wells and do not include undrilled
acreage held by production under the terms of the lease. Undeveloped acres are acres on which wells have not been drilled or
completed to a point that would permit the production of commercial quantities of oil or natural gas, regardless of whether such
acreage contains proved reserves. Approximately 99.5% of our acreage was held by production at December 31, 2025.
Developed Acreage | Undeveloped Acreage | Total Acreage | ||||
Gross(a) | Net(b) | Gross(a) | Net(b) | Gross(a) | Net(b) | |
As of December 31, 2025 | 18,728,541 | 8,331,729 | 813,981 | 462,473 | 19,542,522 | 8,794,202 |
(a)A gross acre is an acre in which a working interest is owned. The number of gross acres is the total number of acres in which a
working interest is owned.
(b)A net acre is deemed to exist when the sum of the fractional ownership working interests in gross acres equals one. The number of
net acres is the sum of the fractional working interests owned in gross acres expressed as whole numbers and fractions thereof.
The undeveloped acreage numbers presented in the table above have been compiled using best efforts to review and determine acreage
that is not currently drilled but may be available for drilling at the current time under certain circumstances. Whether or not undrilled
acreage may be drilled and thereafter produce economic quantities of oil or gas is related to many factors which may change over
time, including natural gas and oil prices, service vendor availability, regulatory regimes, midstream markets, end user demand, and
macro and micro financial conditions; the undeveloped acreage described herein is presented without an opinion as to economic
viability, as a result of the aforesaid factors. Additionally, it is noted that certain formations on a land tract may be already developed
while other formations are undeveloped.
The following table sets forth the number of total gross and net undeveloped acres as of December 31, 2025 that will expire in 2026,
2027 and 2028 unless production is established within the spacing units covering the acreage prior to the expiration dates or unless
such acreage is extended or renewed.
Gross | Net | |
2026 | 55,654 | 796 |
2027 | 63,962 | 2,813 |
2028 | 988 | 225 |
Our primary focus is to operate our existing producing assets safely, efficiently and responsibly. However we also evaluate areas
nearing lease expiration for potential development opportunities when it is prudent to do so.
Productive Wells
Productive wells consist of producing wells, wells capable of production and wells awaiting connection to production facilities. Gross
wells are the total number of producing wells in which we have an interest, operated and non-operated, and net wells are the sum of
our fractional working interest owned in gross wells. The following table summarizes our productive natural gas and oil wells as of
December 31, 2025.
As of December 31, 2025 | |
Natural gas wells | 80,212 |
Oil wells | 10,465 |
Total gross productive wells | 90,677 |
Natural gas wells | 64,404 |
Oil wells | 4,752 |
Total net productive wells | 69,156 |
9
Form 10-K | Diversified Energy Company |
As of December 31, 2025 | |
Total gross in progress wells | 288 |
Total net in progress wells | 97 |
Exploratory and Development Drilling Activities
Information regarding our drilling and development activities for the year ended December 31, 2025 is set forth below:
Development | ||||||
Productive Wells | Dry Wells | Total | ||||
Year | Gross | Net | Gross | Net | Gross | Net |
2025 | 59 | 10 | — | — | 59 | 10 |
2024 | 4 | 4 | — | — | 4 | 4 |
2023 | 3 | 1 | — | — | 3 | 1 |
We drilled no exploratory wells (productive or dry) during the years ended December 31, 2025, 2024 and 2023.
During 2023, we completed the development of two of the seven Appalachian wells that were under development as of December 31,
2022. The remaining five Appalachian wells were divested in connection with the sale of 80% of the equity interest in DP Lion Equity
Holdco LLC in December 2023. On March 1, 2023, we also completed the Tanos II acquisition, which included five wells in the
Central Region that were under development at the date of acquisition. During 2023, we completed one of these five wells. Four
Central Region development wells remained in progress as of December 31, 2023.
During 2024, we completed the development of the four remaining wells acquired in the Tanos II acquisition that had been under
development as of December 31, 2023. As of December 31, 2024, we had zero development wells in progress.
In March 2025, we completed the Maverick acquisition, which included 71 wells that were under development at the time of purchase.
During 2025, through a joint development agreement with an experienced development company, we brought 57 of these wells to
completion. In addition, we completed two wells located adjacent to the Maverick acquisition wells. As of December 31, 2025, 14
development wells from the acquisition remained in progress.
Refer to Note 3 in the Notes to the Consolidated Financial Statements for additional information regarding the acquisitions and
divestitures.
Production Volumes, Average Sales Prices and Operating Costs
For the Year Ended December 31, | |||
2025 | 2024 | 2023 | |
Production | |||
Natural Gas (MMcf) | 295,723 | 244,298 | 256,378 |
NGLs (MBbls) | 8,821 | 5,980 | 5,832 |
Oil (MBbls) | 7,935 | 1,568 | 1,377 |
Total production (MMcfe) | 396,259 | 289,586 | 299,632 |
Average realized sales price | |||
(excluding impact of derivatives settled in cash) | |||
Natural gas (Mcf) | $2.81 | $1.90 | $2.17 |
NGLs (Bbls) | 23.57 | 25.17 | 24.23 |
Oil (Bbls) | 63.10 | 74.71 | 75.46 |
Total (Mcfe) | $3.88 | $2.53 | $2.68 |
Average realized sales price | |||
(including impact of derivatives settled in cash) | |||
Natural gas (Mcf) | $2.80 | $2.57 | $2.86 |
NGLs (Bbls) | 23.34 | 24.32 | 26.05 |
Oil (Bbls) | 66.80 | 69.54 | 68.44 |
Total (Mcfe) | $3.94 | $3.05 | $3.27 |
10
Form 10-K | Diversified Energy Company |
For the Year Ended December 31, | |||
2025 | 2024 | 2023 | |
Operating costs per Mcfe | |||
LOE | $1.15 | $0.80 | $0.71 |
Production taxes | 0.22 | 0.12 | 0.21 |
Midstream operating expense | 0.20 | 0.25 | 0.24 |
Transportation expense | 0.29 | 0.31 | 0.32 |
Total operating expense per Mcfe | $1.86 | $1.48 | $1.48 |
Significant Fields
We operate in three primary producing areas:
(i)Appalachian Region, covering Pennsylvania, Ohio, Virginia, West Virginia, Kentucky, Tennessee, and Alabama;
(ii)Central Region, covering Oklahoma, Texas, New Mexico, Louisiana, and Arkansas; and
(iii)Other, includes Florida and Wyoming.
The following tables present production volumes, realized prices, and per-unit operating costs for our significant fields that account for
15% or more of our total proved reserves. Both the Appalachian Region and the Mid-Continent field, which is one of four separate
fields within the Central Region, meet the criteria for significance.
For the Year Ended December 31, | |||
APPALACHIA | 2025 | 2024 | 2023 |
Production | |||
Natural Gas (MMcf) | 132,100 | 139,900 | 167,930 |
NGLs (MBbls) | 2,655 | 2,931 | 3,018 |
Oil (MBbls) | 369 | 390 | 394 |
Total production (MMcfe) | 150,244 | 159,826 | 188,402 |
Average realized sales prices | |||
Natural gas (Mcf) | $3.17 | $2.12 | $2.31 |
NGLs (Bbls) | 20.94 | 24.07 | 21.58 |
Oil (Bbls) | 61.72 | 72.61 | 74.81 |
Total (Mcfe) | $3.31 | $2.47 | $2.57 |
Operating costs per Mcfe | |||
LOE | $0.67 | $0.59 | $0.56 |
Production taxes | 0.15 | 0.09 | 0.18 |
Midstream operating expense | 0.41 | 0.40 | 0.35 |
Transportation expense | 0.37 | 0.29 | 0.29 |
Total operating expense per Mcfe | $1.60 | $1.37 | $1.38 |
11
Form 10-K | Diversified Energy Company |
For the Year Ended December 31, | |||
MID-CONTINENT | 2025 | 2024 | 2023 |
Production | |||
Natural Gas (MMcf) | 71,859 | 24,661 | 20,254 |
NGLs (MBbls) | 3,920 | 1,285 | 980 |
Oil (MBbls) | 5,026 | 951 | 715 |
Total production (MMcfe) | 125,535 | 38,077 | 30,424 |
Average realized sales prices | |||
Natural gas (Mcf)(a) | $2.12 | $0.97 | $1.42 |
NGLs (Bbls) | 21.90 | 26.10 | 24.21 |
Oil (Bbls) | 58.54 | 65.71 | 68.45 |
Total (Mcfe) | $4.24 | $3.15 | $3.33 |
Operating costs per Mcfe | |||
LOE(a) | $1.00 | $0.69 | $0.55 |
Production taxes | 0.23 | 0.18 | 0.20 |
Transportation expense | 0.18 | 0.12 | 0.17 |
Total operating expense per Mcfe | $1.41 | $0.99 | $0.92 |
(a)Processing fees of approximately $0.85-$1.25 per Mcfe are classified as revenue deductions as opposed to operating expenses.
Delivery Commitments
We have contractually agreed to deliver firm quantities of natural gas to various customers, which we expect to fulfill with production
from existing reserves. We regularly monitor our proved developed reserves to ensure sufficient availability to meet these
commitments. The following table summarizes our total gross commitments, compiled using best estimates based on our sales
strategy, as of December 31, 2025.
2026 | 2027 | 2028 | 2029 | 2030 | Thereafter | Total | |
Natural gas (MMcf) | 169,054 | 49,203 | 25,942 | 15,727 | 15,727 | 275,622 | 551,275 |
Transportation and Marketing
Diversified Energy Marketing, LLC, our wholly owned marketing subsidiary, focuses on commodity marketing, asset optimization,
producer services and strategic management of our transportation portfolio. The focus of our marketing team is to enhance operational
efficiency and profitability by leveraging market insights, operational expertise and strategic asset management to ensure reliable flow
of our products to attractive available markets.
We offer a comprehensive suite of services, including the marketing of natural gas, NGL’s and oil, risk management, logistical
support and strategic transportation management. This approach maximizes market presence, financial outcomes and consistent
product flow, capitalizing on our transportation infrastructure and vertically integrated midstream systems. Our midstream
infrastructure and strategic arrangements provide access to high-demand markets, particularly in the U.S. Gulf Coast, while utilizing
low-cost transportation in Appalachia. This synergy with our asset profile provides advantageous pricing and flow assurance
supported by strategic firm transportation agreements. As of December 31, 2025, our transportation arrangements provide access to
375 MMcfepd of takeaway capacity.
As a dedicated arm of DEC, our marketing team aligns closely with our broader goals of optimizing free cash flow generation. With
experienced professionals and a deep understanding of the energy market, we are committed to delivering value and reliability to our
stakeholders, navigating industry complexities to achieve operational excellence.
Competition
The natural gas and oil industry is highly competitive, and we compete with other companies in all aspects of our business to acquire,
operate, and market our production. Operating conditions may be affected by future legislation and regulations as the United States
regulatory environment modernizes. In addition, some of our competitors may have a competitive advantage when responding to
factors that affect demand for natural gas and oil production, such as changing prices, domestic and foreign political conditions,
weather conditions, the proximity and capacity of natural gas pipelines and other transportation facilities and overall economic
conditions. Our industry and our company can also be impacted by alternative energy sources, including wind, solar, and electric
power. Our ability to acquire properties in the future will depend on our ability to evaluate and select suitable properties and to finalize
transactions in a highly competitive environment.
12
Form 10-K | Diversified Energy Company |
Major Customers
Our production is generally sold on month-to-month contracts at prevailing market prices.
During the years ended December 31, 2025, 2024 and 2023, no customers individually comprised more than 10% of total revenues.
Given the availability of alternative purchasers for oil and natural gas, we believe that losing any single purchaser would not
materially impact our ability to sell future production. To mitigate potential credit risk, we may occasionally require customers to
provide financial security.
Seasonality
Demand for natural gas typically decreases in spring and fall, and increases in summer and winter. However, seasonal anomalies and
consumer procurement initiatives can mitigate these fluctuations. Seasonal anomalies can also heighten competition for equipment,
supplies, and personnel, potentially causing shortages, increased costs or, operational delays.
Title to Properties
We believe we hold satisfactory title to our active properties, adhering to industry standards. Our properties are subject to customary
royalties, contracts, consents, preferential purchase rights, tax liens, laws and other encumbrances, which we believe do not materially
affect their use or value. Before acquiring producing wells, we conduct title investigations consistent with industry standards. For
properties we operate, we address significant title defects as needed. We believe our title reviews are reasonable and protective for a
representative cross-section of our wells.
Human Capital Resources
As of December 31, 2025, the Company employed 1,987 full-time individuals across 23 U.S. states. Our employees are fundamental
to the execution of our operational strategy, and we focus on maintaining robust operating standards with an emphasis on EHS
practices to promote the well‑being of our workforce and the communities in which we operate.
We are committed to fostering an inclusive work environment and making recruitment, development, and promotion decisions based
solely on merit, qualifications, and business needs. We are an equal opportunity employer and do not discriminate against legally
protected classes. Employees have access to a confidential, externally managed whistleblower hotline and a compliance website that
enables direct reporting of concerns to senior leadership.
Our employees are our most important asset. We invest in employee engagement and development through regular communication,
site visits, structured feedback mechanisms, and regular training. We offer a comprehensive compensation package with base pay,
discretionary bonus and equity incentive opportunities, paid time off, 401(k) matching contributions, an employee stock purchase plan
and an affordable and comprehensive health insurance program, among other benefits. In 2025, our CEO and senior leadership team
met directly with approximately 950 employees through our “Winning Language” town halls. Additionally, the Company conducted
its annual Employee Engagement Survey, which received an 80% participation rate from the 1,922 surveys distributed. The survey
assesses organizational alignment, communication effectiveness, leadership, and overall employee engagement. Results from our
Employee Engagement Survey will be used to inform our human capital initiatives and priorities for 2026.
We offer a comprehensive suite of employee benefits designed to support physical, mental, and financial well‑being. In 2025, we
expanded our benefits program to include paid adoption assistance and launched an integrated wellness platform that provides
individualized tools for health tracking, fitness goal setting, and preventive care. Our financial wellness resources include bi‑monthly
educational seminars and complimentary one‑on‑one consultations through our third‑party investment advisors. Participation in the
Company’s 401(k) retirement savings plan reached 93% in 2025, with the Company providing a dollar‑for‑dollar match on employee
contributions up to 7%. Employees also have access to the Company’s Employee Stock Purchase Plan, which allows participants to
purchase Company stock at a discounted rate.
The Company is committed to supporting the communities in which we operate. In 2025, we contributed approximately $1.8 million
to local organizations, programs, and initiatives focused on health, education, student athletics, public safety, and municipal services.
Our community impact efforts included distributing winter coats and shoes to more than 4,240 children and providing support to foster
care organizations. Our Community Relations Committee oversees these initiatives and promotes employee volunteerism throughout
our operating areas. We remain committed to maintaining a safe, inclusive workplace and to positively contributing to the
communities we serve.
13
Form 10-K | Diversified Energy Company |
Government Regulation
General
Our operations in the United States are subject to various U.S. federal, state and local (including county and municipal level) laws and
regulations. These laws and regulations cover virtually every aspect of our operations including, among other things: use of public
roads; construction of well pads, impoundments, tanks and roads; pooling and unitizations; water withdrawal and procurement for well
stimulation purposes; wastewater discharge, well drilling, casing and hydraulic fracturing; stormwater management; well production;
well plugging; venting or flaring of natural gas; pipeline construction and the compression and transportation of natural gas and
liquids; reclamation and restoration of properties after natural gas and oil operations are completed; handling, storage, transportation
and disposal of materials used or generated by natural gas and oil operations; the calculation, reporting and payment of taxes on
natural gas and oil production; and gathering of natural gas production. Various governmental permits, authorizations and approvals
under these laws and regulations are required for exploration and production as well as midstream operations. These laws and
regulations, and the permits, authorizations and approvals issued pursuant to such laws and regulations are intended to protect, among
other things: air quality; ground water and surface water resources, including drinking water supplies; wetlands; waterways; protected
plants and animal species; natural resources; and the health and safety of our employees and the communities in which we operate.
We endeavor to conduct our operations in compliance with all applicable U.S. federal, state and local laws and regulations. However,
because of extensive and comprehensive regulatory requirements against a backdrop of variable geologic and seasonal conditions,
non-compliance during operations can occur. Certain non-compliance may result in fines or penalties, but depending on the nature of
the non-compliance could also result in civil or criminal enforcement actions, additional restrictions on our operations, or make it
more difficult for us to obtain necessary permits in the future. The possibility exists that new laws or regulations may be adopted
which could have a significant impact on our operations or on our customers’ ability to use our natural gas, natural gas liquids and oil,
and may require us or our customers to change their operations significantly or incur substantial costs.
Environmental Laws
Many of the U.S. laws and regulations vary according to the jurisdiction in which we conduct our operations. In addition to state or
local laws and regulations, our operations are also subject to numerous federal environmental laws and regulations. Below is a
discussion of some of the more significant federal laws and regulations applicable to our operations.
Clean Air Act
The federal Clean Air Act and associated federal and state regulations regulate air emissions through permitting and/or emissions
control requirements. These regulations affect the entire value chain from oil and natural gas production, to gathering, to processing, to
transmission and storage, and then to distribution operations. Various equipment and activities in our assets are subject to regulation,
including compressors, engines, dehydrators, storage tanks, pneumatic devices, fugitive components, and blowdowns. We obtain
permits, typically from state or local authorities, or document exemptions necessary to authorize these activities. Further, we are
required to obtain pre-approval for construction or modification of certain facilities, and/or to use specific equipment, technologies or
best management practices to control emissions. Some states also require a separate operating permit to be obtained for on-going
operations.
Federal and state governmental agencies continue to review and revise the air quality regulations affecting oil and natural gas
activities, and expanded regulations could increase our cost or otherwise affect our ability to produce.
Clean Water Act
The federal Clean Water Act (“CWA”) and corresponding state laws affect our operations by regulating storm water or other
discharges of substances, including pollutants, sediment, and spills and releases of oil, brine and other substances, into surface waters,
and in certain instances imposing requirements to dispose of produced wastes and other oil and gas wastes at approved disposal
facilities. The discharge of pollutants into jurisdictional waters is prohibited, except in accordance with the terms of a permit issued by
the EPA, the U.S. Army Corps of Engineers, or a delegated state agency. These permits require regular monitoring and compliance
with effluent limitations, and include reporting requirements. Federal and state regulatory agencies can impose administrative, civil
and/or criminal penalties for non-compliance with discharge permits or other requirements of the CWA and analogous state laws and
regulations.
Endangered Species and Migratory Birds
The Endangered Species Act and related state laws and regulations protect plant and animal species that are threatened or endangered.
The Migratory Bird Treaty Act and the Bald and Golden Eagle Protection Act provide similar protections to migratory birds and bald
and golden eagles, respectively. Some of our operations are located in areas that are or may be designated as protected habitats for
endangered or threatened species, or in areas where migratory birds or bald and golden eagles are known to exist. Laws and
regulations intended to protect threatened and endangered species, migratory birds, or bald and golden eagles could have a seasonal
impact on our construction activities and operations. New or additional species that may be identified as requiring protection or
consideration could also lead to delays in obtaining permits and/or other restrictions, including operational restrictions.
14
Form 10-K | Diversified Energy Company |
Safety of Gas Transmission and Gathering Pipelines
Natural gas pipelines serving our operations are subject to regulation by the U.S. Department of Transportation’s Pipeline and
Hazardous Materials Safety Administration (“PHMSA”) pursuant to the Natural Gas Pipeline Safety Act of 1968 (“NGPSA”), as
amended by the Pipeline Safety Act of 1992, the Accountable Pipeline Safety and Partnership Act of 1996, the Pipeline Safety
Improvement Act of 2002 (“PSIA”), the Pipeline Inspection, Protection, Enforcement and Safety Act of 2006, and the 2011 Pipeline
Safety Act. The NGPSA regulates safety requirements in the design, construction, operation and maintenance of natural gas pipeline
facilities, while the PSIA establishes mandatory inspections for all U.S. oil and natural gas transmission pipelines in high-consequence
areas. Additionally, certain states, such as West Virginia, also maintain jurisdiction over intrastate natural gas lines. PHMSA has over
the years finalized rules that, collectively, impose additional safety requirements on natural gas transmission pipelines and certain
onshore gas gathering pipelines.
The adoption of laws or regulations that apply more comprehensive or stringent safety standards can increase the expenses we incur
for gathering service.
Resource Conservation and Recovery Act
The Federal Resource Conservation and Recovery Act (“RCRA”) and corresponding state laws and regulations impose requirements
for the management, treatment, storage and disposal of hazardous and non-hazardous wastes, including wastes generated by our
operations. Drilling fluids, produced waters and most of the other wastes associated with the exploration, development and production
of natural gas and oil are currently regulated under RCRA’s solid (non-hazardous) waste provisions. Future changes in the law could
result in the reclassification of certain natural gas and oil exploration and production wastes as “hazardous wastes,” which would make
such wastes subject to much more stringent handling, disposal and clean-up requirements. A change in the RCRA exclusion for
drilling fluids, produced waters and related wastes could result in an increase in our costs to manage and dispose of generated wastes,
which could have a material adverse effect on the industry as well as on our results of operations and financial position.
Comprehensive Environmental Response, Compensation, and Liability Act
The Comprehensive Environmental Response, Compensation, and Liability Act (“CERCLA” or “Superfund”) imposes joint and
several liability for costs of investigation and remediation, and for natural resource damages without regard to fault or the legality of
the original conduct, on certain classes of persons with respect to the release into the environment of substances designated under
CERCLA as hazardous substances. These classes of persons, called potentially responsible parties (“PRP”), include the current and
past owners or operators of a site where the release occurred and anyone who disposed, transported, or arranged for the disposal,
transportation, or treatment of a hazardous substance found at the site. CERCLA also authorizes the EPA and, in some instances, third
parties to take actions in response to threats to public health or the environment, and to seek to recover from PRPs for the costs of such
action. Many states, including states in which we operate, have adopted comparable state statutes.
Although CERCLA generally exempts “petroleum” from regulation, in the course of our operations we have generated and will
generate wastes that may fall within CERCLA’s definition of hazardous substances, and may have disposed of these wastes at disposal
sites owned and operated by others. We may also be the owner or operator of sites on which hazardous substances have been released.
In the event contamination is discovered at a site on which we are or have been an owner or operator, or to which we have sent
hazardous substances, we could be jointly and severally liable for the costs of investigation and remediation, and for natural resource
damages. Further, it is not uncommon for neighboring landowners and other third parties to file claims for personal injury and
property damage allegedly caused by hazardous substances or other pollutants released into the environment.
Oil Pollution Act
The primary federal law related to oil spill liability is the Oil Pollution Act (“OPA”), which amends and augments oil spill provisions
of the CWA and imposes certain duties and liabilities on certain “responsible parties” related to the prevention of oil spills and
damages resulting from such spills in or threatening waters of the United States or adjoining shorelines. A liable “responsible party”
includes the owner or operator of a facility, vessel or pipeline that is a source of an oil discharge or that poses the substantial threat of
discharge. The OPA assigns joint and several liability, without regard to fault, to each responsible party for oil removal costs and a
variety of public and private damages. Although defenses exist to the liability imposed by the OPA, they are limited. In the event of an
oil discharge or substantial threat of discharge, we may be liable for costs and damages.
Regulation of the Sale and Transportation of Natural Gas, NGLs and Oil
The transportation and sale, or resale, of natural gas in interstate commerce are regulated by the Federal Energy Regulatory
Commission (“FERC”) under the Natural Gas Act of 1938, the Natural Gas Policy Act of 1978, and regulations issued under those
statutes. FERC regulates interstate natural gas transportation rates, and the terms and conditions of service, which affects the
marketing of natural gas that we produce, as well as the revenues we receive for sales of our natural gas. FERC regulations require that
rates, terms and conditions of service for interstate service pipelines that transport crude oil and refined products and certain other
liquids be just and reasonable and must not be unduly discriminatory or confer any undue preference upon any shipper. FERC
regulations also require interstate common carrier petroleum pipelines to file with FERC and publicly post tariffs stating their
interstate transportation rates, terms and conditions of service.
15
Form 10-K | Diversified Energy Company |
Section 1(b) of the Natural Gas Act exempts from regulation by FERC facilities used for the production and gathering of natural gas.
However, the distinction between federally unregulated gathering facilities and FERC regulated transmission facilities is a fact-based
determination, and the classification of facilities has recently been the subject of regulatory dispute. We own certain natural gas
pipeline facilities that we believe meet the traditional tests FERC has used to establish a pipeline’s primary function as “gathering,”
thus exempting it from the jurisdiction of FERC under the Natural Gas Act.
Intrastate natural gas transportation is also subject to regulation by state regulatory agencies. The basis for intrastate regulation of
natural gas transportation and the degree of regulatory oversight and scrutiny given to intrastate natural gas pipeline rates and services
varies from state to state. Like the regulation of interstate transportation rates, the regulation of intrastate transportation rates affects
the marketing of natural gas that we produce, as well as the revenues we receive for sales of our natural gas.
FERC regulates the rates and terms and conditions of service for transportation of oil and NGLs on interstate pipelines under the
provisions of the Interstate Commerce Act, the Energy Policy Act of 1992 and amendments to and regulations issued under those
statutes. Intrastate transportation of oil, NGLs and other products is dependent on pipelines whose rates, terms and conditions of
service are subject to regulation by state regulatory bodies under state statutes.
The price of natural gas, NGLs, and crude oil are currently not directly regulated, but Congress historically has been active in the area
of natural gas, NGLs and crude oil regulation. We cannot predict whether new legislation to regulate sales and commodity prices
might be enacted in the future or what effect, if any, such legislation might have on our operations.
Health and Safety Laws
Our operations are subject to regulation under the federal Occupational Safety and Health Act (“OSHA”) and comparable state laws in
some states, all of which regulate health and safety of employees at our operations. Additionally, OSHA’s hazardous communication
standard, the EPA community right-to-know regulations under Title III of the federal Superfund Amendment and Reauthorization Act,
and comparable state laws require that information be maintained about hazardous materials used or produced by our operations and
that this information be provided to employees, state and local governments and the public.
Emissions Laws and Regulations
There are a number of proposed and recently-enacted laws and regulations at the international, federal, state, regional and local level
that seek to limit or require disclosure regarding greenhouse gas emissions (“GHG”) and other climate-related matters. Such laws and
regulations could increase our costs, including requirements that necessitate the installation of new equipment or the purchase of
emission allowances. These laws and regulations could also impact our customers, including the electric generation industry, making
alternative sources of energy more competitive and thereby decreasing demand for the natural gas and oil we produce. Additional
regulation could also lead to permitting delays and additional monitoring and administrative requirements, in turn impacting electricity
generating operations.
At the international level, the UN-sponsored “Paris Agreement,” for nations to limit their GHG emissions through non-binding,
individually-determined reduction goals every five years after 2020. In November 2021, the international community gathered in
Glasgow at the 26th Conference of the Parties to the UN Framework Convention on Climate Change, during which multiple
announcements were made, including a call for parties to eliminate certain natural gas and oil subsidies and pursue further action on
non-carbon dioxide GHGs. In a related gesture, the United States and the European Union jointly announced the launch of the “Global
Methane Pledge,” which aims to cut global methane pollution by at least 30% by 2030 relative to 2020 levels, including “all feasible
reductions” in the energy sector. Such commitments were re-affirmed at the 27th Conference of the Parties in Sharm El Sheikh.
However, on January 2025, President Trump issued an Executive Order directing the U.S. Ambassador to the United Nations to
withdraw from the Paris Agreement. Accordingly, the UN Secretary General issued a depositary notification of the U.S. withdrawal
from the Paris Agreement, effective January 27, 2026. More recently, in February 2026, the U.S. Environmental Protection Agency
finalized a regulation rescinding its prior finding that certain GHG emissions endangered public health and welfare, which had served
as the basis for certain GHG emission regulation by the agency. This and other changes undertaken by the Trump Administration have
or may in the future reverse or rescind climate-related initiatives and regulations and focus on driving increased U.S. energy
production. In response, several U.S. states separately expressed their commitment to the Paris Agreement and its goals, while others
have pursed emissions reporting regulations. Although it is not possible at this time to predict how legislation or new regulations that
may be adopted pursuant to the Paris Agreement to address GHG emissions, including state emission reduction targets or reporting,
would impact our business, any such future laws and regulations imposing reporting obligations on, or limiting emissions of GHGs
from, our equipment and operations could require us to incur costs to implement such measures associated with our operations.
In addition, activists that are not supportive of our energy producing products have directed their attention at sources of funding for
energy companies, which has resulted in certain financial institutions, funds and other sources of capital restricting or eliminating their
investment in natural gas and oil activities. Ultimately, this could make it more difficult to secure funding for exploration and
production activities. Litigation risks are also a potential concern, as a number of cities and other local governments have sought to
bring suits against the largest oil and natural gas exploration and production companies in state or federal court, alleging, among other
things, that such companies created public nuisances by producing fuels that contributed to global weather events, and therefore are
responsible for roadway and infrastructure and other damages, or alleging that the companies have been aware of the unsubstantiated
effects of weather pattern changes for some time.
16
Form 10-K | Diversified Energy Company |
Available Information
Our corporate office is located at 1600 Corporate Drive, Birmingham, Alabama 35242, and our telephone number at that location is
(205) 408-0909. Our website address is www.div.energy. The information contained on our website is not incorporated by reference
into this Annual Report on Form 10-K and should not be considered part of this report.
We make available, free of charge, through our website, our annual reports on Form 10-K, quarterly reports on Form 10-Q, current
reports on Form 8-K, and amendments to those reports filed or furnished pursuant to Section 13(a) or 15(d) of the Securities Exchange
Act of 1934 as soon as reasonably practicable after we electronically file such material with, or furnish it to, the Securities and
Exchange Commission (“SEC”). The SEC maintains an internet site that contains reports, proxy and information statements, and other
information regarding issuers that file electronically with the SEC at www.sec.gov (Commission File Number: 001-41870).
Required UK Regulatory Disclosures
As required as a result of our membership on the London Stock Exchange, we make the following disclosures:
Board Composition
The Board’s composition prioritizes a broad range of perspectives, emphasizing relevant professional experience and industry
knowledge aligned with our strategic objectives.
As required to be presented in accordance with UK Listing Rule 14.3.30R, as of December 31, 2025, the Board’s composition did not
align with the UK Listing Rules’ numerical targets relating to gender and ethnic representation. At that date, women comprised 17%
of the Board, no woman held a senior Board position (defined as Chief Executive Officer, Senior Independent Director, Chair of
Board, or Chief Financial Officer; although it is noted that a woman chaired two of the Company’s committees), and there was no
director from a minority ethnic background.
Board and Executive Management Composition
As required to be presented in accordance with UK Listing Rule 14.3.30R(2) as of December 31, 2025:
Number of Board Members | Percentage of the Board | Number of Senior Positions on the Board (Defined under UK Listing Rules as CEO, CFO, SID & Chair)(a) | Number of Executive Management | Percentage of Executive Management | |
Gender Identity or Sex(a) | |||||
Male | 5 | 83% | 2 | 6 | 100% |
Female | 1 | 17% | 0 | 0 | 0% |
Other categories | 0 | 0% | 0 | 0 | 0% |
Not specified/prefer not to say | 0 | 0% | 0 | 0 | 0% |
Ethnic Background | |||||
White British or other White (including minority-white groups) | 6 | 100% | 2 | 6 | 100% |
Mixed/Multiple Ethnic Groups | 0 | 0% | 0 | 0 | 0% |
Asian/Asian British | 0 | 0% | 0 | 0 | 0% |
Black/African/Caribbean/ Black British | 0 | 0% | 0 | 0 | 0% |
Other ethnic group, including Arab | 0 | 0% | 0 | 0 | 0% |
Not specific/prefer not to say | 0 | 0% | 0 | 0 | 0% |
(a)Data reported on the basis of gender identity.
The Board’s Directors are from the U.S. as well as the UK, bringing a range of domestic and international experience to the Board.
The Board’s diverse range of experience and expertise covers not only a wealth of experience of operating in the natural gas and oil
industry but also extensive technical, operational, financial, legal and environmental expertise.
17
Form 10-K | Diversified Energy Company |
Other Regulatory UK Disclosures
As a company admitted to listing on the Equity Shares (International Commercial Companies Secondary Listing) category of the
Official List of the Financial Conduct Authority and to trading on the Main Market of the London Stock Exchange, the Company is
required to make certain disclosures under the U.K. Listing Rules (the “UKLRs”) and the Disclosure, Guidance and Transparency
Rules (the “DTRs”).
Set out below are details of where such disclosures can be found:
•As required under DTR 7.2, the Company’s Corporate Governance Statement is available on its website at https://
www.div.energy/about-us/corporate-governance/;
•As required under UKLR 14.3.30R, the UK Board Diversity Statement and associated numerical data can be found in the
Board and Executive Management Composition section herein;
•In accordance with UKLR 14.3.24R, the Company will include in its 2025 Sustainability Report weather-related disclosures
consistent with the four recommendations and the eleven recommended disclosures set out in Figure 4 of Section C of the
report entitled “Recommendations of the Task Force on Climate-related Financial Disclosures” published in June 2017 by the
Task Force on Climate-related Financial Disclosures. For ease of review and given the detailed and technical content of these
disclosures, the Company considered the 2025 Sustainability Report to be the most appropriate location for the disclosures.
•The 2025 Sustainability Report provides an overview of our commitments to responsible conduct and sustainable business
practices, as well as our sustainability priorities. It will be made available on our website; and
•As required under DTR 4.1.12R, each member of the Board of Directors of the Company confirms that to the best of their
knowledge:
(a)The consolidated financial statements, prepared in accordance with U.S. GAAP, give a true and fair view of the
assets, liabilities, financial position and profit or loss of the Company and its wholly-owned subsidiaries taken as a
whole; and
(b)Management’s discussion and analysis of financial condition and results of operations includes a fair review of the
development and performance of the business and the position of the Company and its wholly-owned subsidiaries
taken as a whole, together with a description of the risks and uncertainties that they face.
Item 1A. Risk Factors
You should carefully consider the risks described below, together with all of the other information in this Annual Report on Form 10-
K. The risks and uncertainties below are not the only ones we face. Additional risks and uncertainties not presently known to us or that
we believe to be immaterial may also adversely affect our business. If any of the following risks occur, our business, financial
condition, and results of operations could be seriously harmed and you could lose all or part of your investment. This Annual Report
on Form 10-K also contains forward-looking statements that involve risks and uncertainties. Our actual results may differ materially
from those anticipated in these forward-looking statements as a result of various factors, including the risks described below and
elsewhere in this Annual Report on Form 10-K.
Summary of Risk Factors
We are subject to a variety of risks and uncertainties which could have a material adverse effect on our business, financial condition,
and results of operations. The summary below is not exhaustive and is qualified by reference to the full set of risk factors set forth in
this “Risk Factors” section.
•Volatility and future changes in natural gas, NGLs and oil prices could materially and adversely affect our business, results of
operations, financial condition, cash flows or prospects.
•We face production risks and hazards that may affect our ability to produce natural gas, NGLs and oil at expected levels, quality
and costs that may result in additional liabilities to us.
•The levels of our natural gas and oil reserves and resources and their quality and production volumes may be lower than estimated
or expected.
•PV-10 will not necessarily be the same as the current market value of our estimated natural gas, NGL and oil reserves.
•We may face unanticipated increased or incremental costs in connection with decommissioning obligations such as plugging.
•We may not be able to keep pace with technological developments in our industry or be able to implement them effectively.
•Deterioration in the economic conditions in any of the industries in which our customers operate, a domestic or worldwide
financial downturn, or negative credit market conditions could have a material adverse effect on our liquidity, results of
operations, business and financial condition that we cannot predict.
•Our operations are subject to a series of risks relating to weather events.
•We rely on third-party infrastructure that we do not control and/or are subject to tariff charges that we do not control.
18
Form 10-K | Diversified Energy Company |
•Failure by us, our contractors or our primary offtakers to obtain access to necessary equipment and transportation systems could
materially and adversely affect our business, results of operations, financial condition, cash flows or prospects.
•A proportion of our equipment has substantial prior use and significant expenditure may be required to maintain operability and
operations integrity.
•We depend on our directors, key members of management, independent experts, and technical and operational service providers
and on our ability to retain and hire such persons to effectively manage our growing business.
•We may face unanticipated water and other waste disposal costs.
•We may incur significant costs and liabilities resulting from performance of pipeline integrity programs and related repairs.
•Inflation may adversely affect us by increasing costs beyond what we can recover through price increases and limit our ability to
enter into future debt financing.
•There are risks inherent in our acquisitions of natural gas and oil assets.
•We may not have good title to all our assets and licenses.
•Restrictions in our existing and future debt agreements could limit our growth and our ability to engage in certain activities.
•The securitizations of our limited purpose, bankruptcy-remote, wholly owned subsidiaries may expose us to financing and other
risks, and there can be no assurance that we will be able to access the securitization market in the future, which may require us to
seek more costly financing.
•We are subject to regulation and liability under environmental, health and safety regulations, the violation of which may affect our
financial condition and operations.
•Our operations are dependent on our compliance with obligations under permits, licenses, contracts and field development plans.
•Our internal systems and website may be subject to intentional and unintentional disruption, and our confidential information may
be misappropriated, stolen or misused, which could adversely impact our reputation and future sales.
•Our operations are subject to the risk of litigation.
•Failure to comply with requirements to design, implement and maintain effective internal control over financial reporting could
have a material adverse effect on our business.
•We are subject to certain tax risks, including changes in tax legislation in the United States.
Risks Related to Our Business, Operations and Industry
Volatility and future changes in natural gas, NGLs and oil prices could materially and adversely affect our business, results of
operations, financial condition, cash flows or prospects.
Our business, results of operations, financial condition, cash flows or prospects depend substantially upon prevailing natural gas, NGL
and oil prices, which may be adversely impacted by unfavorable global, regional and national macroeconomic conditions, including
but not limited to instability related to the military conflicts in Ukraine and the Middle East. Natural gas, NGLs and oil are
commodities for which prices are determined based on global and regional demand, supply and other factors, all of which are beyond
our control.
Historically, prices for natural gas, NGLs and oil have fluctuated widely for many reasons, including:
•Global and regional supply and demand, and expectations regarding future supply and demand, for gas and oil products;
•Global and regional economic conditions;
•Evolution of stocks of oil and related products;
•Increased production due to new extraction developments and improved extraction and production methods;
•Geopolitical uncertainty;
•Threats or acts of terrorism, war or threat of war, which may affect supply, transportation or demand;
•Weather events, natural disasters and environmental incidents;
•Access to pipelines, storage platforms, shipping vessels and other means of transporting, storing and refining gas and oil,
including without limitation, changes in availability of, and access to, pipeline ullage;
•Prices and availability of alternative fuels;
•Prices and availability of new technologies affecting energy consumption;
•Increasing competition from alternative energy sources;
•The ability of OPEC and other oil-producing nations, to set and maintain specified levels of production and prices;
•Political, economic and military developments in gas and oil producing regions generally;
19
Form 10-K | Diversified Energy Company |
•Governmental regulations and actions, including the imposition of tariffs, export restrictions and taxes and environmental
requirements and restrictions as well as anti-hydrocarbon production policies;
•Trading activities by market participants and others either seeking to secure access to natural gas, NGLs and oil or to hedge
against commercial risks, or as part of an investment portfolio; and
•Market uncertainty, including fluctuations in currency exchange rates, and speculative activities by those who buy and sell natural
gas, NGLs and oil on the world markets.
It is impossible to accurately predict future gas, NGL and oil price movements. Historically, natural gas prices have been highly
volatile and subject to large fluctuations in response to relatively minor changes in the demand for natural gas.
The economics of producing from some wells and assets may also result in a reduction in the volumes of our reserves which can be
produced commercially, resulting in decreases to our reported reserves. Additionally, further reductions in commodity prices may
result in a reduction in the volumes of our reserves. We might also elect not to continue production from certain wells at lower prices,
or our license partners may not want to continue production regardless of our position.
Each of these factors could result in a material decrease in the value of our reserves, which could lead to a reduction in our natural gas,
NGLs and oil development activities and acquisition of additional reserves. In addition, certain development projects or potential
future acquisitions could become unprofitable as a result of a decline in prices and could result in us postponing or canceling a planned
project or potential acquisition, or if it is not possible to cancel, to carry out the project or acquisition with negative economic impacts.
Further, a reduction in natural gas, NGL or oil prices may lead our producing fields to be shut in and to be entered into the
decommissioning phase earlier than estimated.
Our revenues, cash flows, operating results, profitability, dividends, future rate of growth and the carrying value of our gas and oil
properties depend heavily on the prices we receive for natural gas, NGLs and oil sales. Commodity prices also affect our cash flows
available for capital investments and other items, including the amount and value of our gas and oil reserves. In addition, we may face
gas and oil property impairments if prices fall significantly. In light of the continuing increase in supply coming from the Utica and
Marcellus shale plays of the Appalachian Basin, no assurance can be given that commodity prices will remain at levels which enable us
to do business profitably or at levels that make it economically viable to produce from certain wells and any material decline in such
prices could result in a reduction of our net production volumes and revenue and a decrease in the valuation of our production
properties, which could negatively impact our business, results of operations, financial condition, cash flows or prospects.
We conduct our business in a highly competitive industry.
The gas and oil industry is highly competitive. The key areas in which we face competition include:
•Engagement of third-party service providers whose capacity to provide key services may be limited;
•Acquisition of other companies that may already own licenses or existing producing assets;
•Acquisition of assets offered for sale by other companies;
•Access to capital (debt and equity) for financing and operational purposes;
•Purchasing, leasing, hiring, chartering or other procuring of equipment that may be scarce; and
•Employment of qualified and experienced skilled management and gas and oil professionals and field operations personnel.
Competition in our markets is intense and depends, among other things, on the number of competitors in the market, their financial
resources, their degree of geological, geophysical, engineering and management expertise and capabilities, their degree of vertical
integration and pricing policies, their ability to develop properties on time and on budget, their ability to select, acquire and develop
reserves and their ability to foster and maintain relationships with the relevant authorities. The cost to attract and retain qualified and
experienced personnel has increased and may increase substantially in the future.
Our competitors also include those entities with greater technical, physical and financial resources than us. Finally, companies and
certain private equity firms not previously investing in natural gas and oil may choose to acquire reserves to establish a firm supply or
simply as an investment. Any such companies will also increase market competition which may directly affect us.
If we are unsuccessful in competing against other companies, our business, results of operations, financial condition, cash flows or
prospects could be materially adversely affected.
20
Form 10-K | Diversified Energy Company |
We may experience delays in production, transportation and marketing.
Various production, transportation and marketing conditions may cause delays in natural gas, NGLs and oil production and adversely
affect our business. For example, the gas gathering systems that we own connect to other pipelines or facilities which are owned and
operated by third parties. These pipelines and other midstream facilities and others upon which we rely may become unavailable
because of testing, turnarounds, line repair, reduced operating pressure, lack of operating capacity, regulatory requirements,
curtailments of receipt or deliveries due to insufficient capacity or because of damage. Our largest processor of NGLs is the MarkWest
Energy Partners, L.P. (“MarkWest”) plant located in Langley, Kentucky. If we were to lose the ability to process NGLs at MarkWest’s
plant during a period of high pricing, our revenues would be negatively impacted. As a short-term measure, we could divert the natural
gas through other pipeline routes; however, certain pipeline operators would eventually decline to transport the gas due to its liquid
content at a level that would exceed tariff specifications for those pipelines. The lack of available capacity on third-party systems and
facilities could reduce the price offered for our production or result in the shut-in of producing wells. Any significant changes
affecting these infrastructure systems and facilities, as well as any delays in constructing new infrastructure systems and facilities,
could delay our production, which could negatively impact our business, results of operations, financial condition, cash flows or
prospects.
We face production risks and hazards that may affect our ability to produce natural gas, NGLs and oil at expected levels,
quality and costs that may result in additional liabilities to us.
Our natural gas and oil production operations are subject to numerous risks common to our industry, including, but not limited to,
premature decline of reservoirs, incorrect production estimates, invasion of water into producing formations, geological uncertainties
such as unusual or unexpected rock formations and abnormal geological pressures, low permeability of reservoirs, contamination of
natural gas and oil, blowouts, oil and other chemical spills, explosions, fires, equipment damage or failure, challenges relating to
transportation, pipeline infrastructure, natural disasters, uncontrollable flows of oil, natural gas or well fluids, adverse weather
conditions, shortages of skilled labor, delays in obtaining regulatory approvals or consents, pollution and other environmental risks.
If any of the above events occur, environmental damage, including biodiversity loss or habitat destruction, injury to persons or
property and other species and organisms, loss of life, failure to produce natural gas, NGLs and oil in commercial quantities or an
inability to fully produce discovered reserves could result. These events could also cause substantial damage to our property or the
property of others and our reputation and put at risk some or all of our interests in licenses, which enable us to produce, and could
result in the incurrence of fines or penalties, criminal sanctions potentially being enforced against us and our management, as well as
other governmental and third-party claims. Consequent production delays and declines from normal field operating conditions and
other adverse actions taken by third parties may result in revenue and cash flow levels being adversely affected.
Moreover, should any of these risks materialize, we could incur legal defense costs, remedial costs and substantial losses, including
those due to injury or loss of life, human health risks, severe damage to or destruction of property, natural resources and equipment,
environmental damage, unplanned production outages, clean-up responsibilities, regulatory investigations and penalties, increased
public interest in our operational performance and suspension of operations, which could negatively impact our business, results of
operations, financial condition, cash flows or prospects.
The levels of our natural gas and oil reserves and resources, their quality and production volumes may be lower than
estimated or expected.
The reserves data as of December 31, 2025, 2024 and 2023 contained in this Annual Report on Form 10-K has been audited by NSAI
unless stated otherwise. The standards utilized to prepare the reserves information may be different from the standards of reporting
adopted in other jurisdictions. Investors, therefore, should not assume that our reserves information as set forth in this Annual Report
on Form 10-K is directly comparable to similar information that has been prepared in accordance with the reserve reporting standards
of other jurisdictions.
In general, estimates of economically recoverable natural gas, NGLs and oil reserves are based on a number of factors and
assumptions made as of the date on which the reserves estimates were determined, such as geological, geophysical and engineering
estimates (which have inherent uncertainties), historical production from the properties or analogous reserves, the assumed effects of
regulation by governmental agencies and estimates of future commodity prices, operating costs, gathering and transportation costs and
production related taxes, all of which may vary considerably from actual results.
Underground accumulations of hydrocarbons cannot be measured in an exact manner and estimates thereof are a subjective process
aimed at understanding the statistical probabilities of recovery. Estimates of the quantity of economically recoverable natural gas and
oil reserves, rates of production and, where applicable, the timing of development expenditures depend upon several variables and
assumptions.
Many of the factors in respect of which assumptions are made when estimating reserves are beyond our control and therefore these
estimates may prove to be incorrect over time. Evaluations of reserves necessarily involve multiple uncertainties. The accuracy of any
reserves evaluation depends on the quality of available information and natural gas, NGLs and oil engineering and geological
interpretation. Interpretation, testing and production after the date of the estimates may require substantial upward or downward
21
Form 10-K | Diversified Energy Company |
revisions in our reserves and resources data. Moreover, different reserves engineers may make different estimates of reserves and cash
flows based on the same available data. Actual production, revenues and expenditures with respect to reserves will vary from
estimates and the variances may be material.
If the assumptions upon which the estimates of our natural gas and oil reserves prove to be incorrect or if the actual reserves available
to us (or the operator of an asset in we have an interest) are otherwise less than the current estimates or of lesser quality than expected,
we may be unable to recover and produce the estimated levels or quality of natural gas, NGLs or oil set out in this document and this
may materially and adversely affect our business, results of operations, financial condition, cash flows or prospects.
The PV-10 of our reserves will not necessarily be the same as the current market value of our estimated natural gas, NGL and
oil reserves.
You should not assume that the present value of future net cash flows from our reserves is the current market value of our estimated
natural gas, NGL and oil reserves. Actual future net cash flows from our natural gas and oil properties will be affected by factors such
as:
•Actual prices we receive for natural gas, NGL and oil;
•Actual cost of development and production expenditures;
•The amount and timing of actual production;
•Transportation and processing; and
•Changes in governmental regulations or taxation.
The timing of both our production and our incurrence of expenses in connection with the development and production of our natural
gas and oil properties will affect the timing and amount of actual future net cash flows from reserves, and thus their actual present
value. In addition, the 10% discount factor we use when calculating discounted future net cash flows may not be the most appropriate
discount factor based on interest rates in effect from time to time and risks associated with us or the natural gas and oil industry in
general. Actual future prices and costs may differ materially from those used in the present value estimate.
We may face unanticipated increased or incremental costs in connection with decommissioning obligations such as plugging.
In the future, we may become responsible for costs associated with abandoning and reclaiming wells, facilities and pipelines which we use
for the processing of natural gas and oil reserves. With regards to plugging, we are party to agreements with regulators in the states of
Ohio, West Virginia, Kentucky and Pennsylvania, four of our largest wellbore states, setting forth plugging and abandonment schedules
spanning a period ranging from 10 to 100 years. We will incur such decommissioning costs at the end of the operating life of some of our
properties or in the future period that wells are scheduled to be plugged. The ultimate decommissioning costs are uncertain and cost
estimates can vary in response to many factors including changes to relevant legal requirements, the emergence of new restoration
techniques, the shortage of plugging vendors, difficult terrain or weather conditions or experience at other well locations. The expected
timing and amount of expenditure can also change, for example, in response to changes in reserves, wells losing commercial viability
sooner than forecasted or changes in laws and regulations or their interpretation. As a result, there could be significant adjustments to the
provisions established which would affect future financial results. The use of other funds to satisfy such decommissioning costs may
impair our ability to focus capital investment in other areas of our business, which could materially and adversely affect our business,
results of operations, financial condition, cash flows or prospects.
We may not be able to keep pace with technological developments in our industry or be able to implement them effectively.
The natural gas and oil industry is characterized by rapid and significant technological advancements and introductions of new
products and services using new technologies, such as emissions controls and processing technologies. Rapid technological
advancements in information technology and operational technology domains require seamless integration. Failure to integrate these
technologies efficiently may result in operational inefficiencies, security vulnerabilities, and increased costs. During mergers and
acquisitions, integrating technology assets from acquired companies can be complex. Poor integration may lead to data
inconsistencies, security gaps and operational disruptions. Technology systems are also susceptible to cybersecurity threats, including
malware, denial-of-service attacks, data breaches, hacking, social engineering or "phishing", deepfake attacks, computer viruses,
employee or insider threats, malfeasance, supply chain attacks, physical breaches, vendor email compromise, payment fraud, and
ransomware attacks. These threats may disrupt operations, compromise sensitive data and lead to significant financial losses. Further,
inefficient data management practices may result in data breaches, data loss and missed opportunities for operational insights. The
presence of legacy technology systems can also pose challenges, as they may lack modern security features, making them vulnerable
to cyber threats and necessitating costly upgrades. As others use or develop new technologies (including technologies related to
artificial intelligence), we may be placed at a competitive disadvantage or may be forced by competitive pressures to implement those
new technologies at substantial costs. In addition, other natural gas and oil companies may have greater financial, technical and
personnel resources that allow them to enjoy technological advantages, which may in the future allow them to implement new
technologies before we can. Additionally, reliance on global supply chains for information technology hardware, software and
operational technology equipment exposes the industry to supply chain disruptions, shortages and cybersecurity risks.
22
Form 10-K | Diversified Energy Company |
Our operations are subject to a series of risks relating to weather events.
Continued public concern regarding weather events and potential mitigation through regulation could have a material impact on our
business. International agreements, national, regional, state and local legislation, and regulatory measures to limit GHG emissions or
mandate related disclosures are currently in place or in various stages of discussion or implementation. Given that some of our
operations are associated with emissions of GHGs, these and other GHG emissions-related laws, policies and regulations may result in
substantial capital, compliance, operating and maintenance costs. The level of expenditure required to comply with these laws and
regulations is uncertain and is expected to vary depending on the laws enacted by particular countries, states, provinces and
municipalities.
Additionally, regulatory, market and other changes to respond to weather events may adversely impact our business, financial
condition or results of operations. Reporting expectations are also increasing, with a variety of customers, capital providers and
regulators seeking increased information on weather-related risks. For example, U.S. states have adopted or proposed weather-related
disclosures rules that may require us to incur significant costs to assess and disclose on a range of weather-related data and risks.
Internationally, the United Nations-sponsored “Paris Agreement” requires member nations to individually determine and submit non-
binding emissions reduction targets every five years after 2020. In November 2021, the international community gathered in Glasgow
at the 26th Conference of the Parties to the UN Framework Convention on Climate Change, during which multiple announcements
were made, including a call for parties to eliminate certain natural gas and oil subsidies and pursue further action on non-carbon
dioxide GHGs. Relatedly, the United States and European Union jointly announced the launch of the “Global Methane Pledge,” which
aims to cut global methane pollution at least 30% by 2030 relative to 2020 levels, including “all feasible reductions” in the energy
sector. Such commitments were re-affirmed at the 27th Conference of the Parties in Sharm El Sheikh. However, on January 20, 2025,
President Trump issued an Executive Order directing the U.S. Ambassador to the United Nations to withdraw from the Paris
Agreement. Accordingly, the UN Secretary General issued a depositary notification of the U.S. withdrawal from the Paris Agreement,
effective January 27, 2026. More recently, in February 2026, the U.S. Environmental Protection Agency rescinded its prior finding
that certain GHG emissions endangered public health and welfare, which had served as the basis for certain GHG emission regulation
by the agency. This, and other changes undertaken by the Trump Administration have or may in the future reverse or rescind weather-
related initiatives and regulations and focus on driving increased U.S. energy production. The emission reduction targets and other
provisions of legislative or regulatory initiatives and policies enacted in the future by the states in which we operate, could adversely
impact our business by imposing increased costs in the form of higher taxes or increases in the prices of emission allowances, limiting
our ability to develop new gas and oil reserves, transport hydrocarbons through pipelines or other methods to market, decreasing the
value of our assets, or reducing the demand for hydrocarbons and refined petroleum products. With increased pressure to reduce GHG
emissions by replacing natural gas and oil energy generation with alternative energy generation, it is possible that peak demand for gas
and oil will be reached, and gas and oil prices will be adversely impacted as and when this happens. Further, the consequences of the
effects of global weather events and patterns, and the continued political and societal attention afforded to mitigating the effects of
weather events and patterns, may generate adverse investor and stakeholder sentiment towards the hydrocarbon industry and
negatively impact the ability to invest in the sector. Similarly, longer term reduction in the demand for hydrocarbon products due to
the pace of commercial deployment of alternative energy technologies or due to shifts in consumer preference for lower GHG
emissions products could reduce the demand for the hydrocarbons that we produce.
Further, in response to concerns related to weather events, companies in the natural gas and oil sector may be exposed to increasing
financial risks. Financial institutions, including investment advisors and certain sovereign wealth, pension and endowment funds, may
elect in the future to shift some or all of their investment into non-natural gas and oil related sectors. Institutional lenders who provide
financing to fossil-fuel energy companies have also become more attentive to sustainable lending practices, and some of them may elect
in the future not to provide funding for natural gas and oil energy companies. A material reduction in the capital available to the natural
gas and oil industry could make it more difficult to secure funding for exploration, development, production, and transportation activities,
which could in turn negatively affect our operations.
The Company may also be subject to activism from environmental non-governmental organizations (“NGOs”) campaigning against
natural gas and oil extraction or negative publicity from media alleging inadequate remedial actions to retire non-producing wells
effectively, which could affect our reputation, disrupt our programs, require us to incur significant, unplanned expense to respond or react
to intentionally disruptive campaigns or media reports, create blockades to interfere with operations or otherwise negatively impact our
business, results of operations, financial condition, cash flows or prospects. Litigation risks are also increasing as a number of entities
have sought to bring suit against various oil and natural gas companies in state or federal court, alleging among other things, that such
companies created public nuisances by producing fuels that contributed to weather events or alleging that the companies have been aware
of the adverse effects of weather events and patterns for some time.
Finally, our operations are subject to disruption from the physical effects that may be caused or aggravated by weather events. These
include risks from extreme weather events, such as hurricanes, severe storms, floods, heat waves, and ambient temperature increases,
as well as wildfires.
23
Form 10-K | Diversified Energy Company |
We rely on third-party infrastructure that we do not control and/or, in each case, are subject to tariff charges that we do not
control.
A significant portion of our production passes through third-party owned and controlled infrastructure. If these third-party pipelines or
liquids processing facilities experience any event that causes an interruption in operations or a shut-down such as mechanical problems,
an explosion, adverse weather conditions, a terrorist attack or labor dispute, our ability to produce or transport natural gas could be
severely affected. For example, we have an agreement with a third-party where approximately 28% of the NGLs we sold during the
year ending December 31, 2025 were processed at the third-party’s facility in Kentucky. Any material decreases in our ability to
process or transport our natural gas through third-party infrastructure could have a material adverse effect on our business, results of
operations, financial condition, cash flows or prospects.
Our use of third-party infrastructure may be subject to tariff charges. Although we seek to manage our flow via our midstream
infrastructure, we may not always be able to avoid higher tariffs or basis blowouts due to the lack of interconnections. In such instances,
the tariff charges can be substantial and the cost is not subject to our direct control, although we may have certain contractual or
governmental protections and rights. Generally, the operator of the gathering or transmission pipelines sets these tariffs and expenses on a
cost sharing basis according to our proportionate hydrocarbon through-put of that facility. A provisional tariff rate is applied during the
relevant year and then finalized the following year based on the actual final costs and final through-put volumes. Such tariffs are
dependent on continued production from assets owned by third parties and, may be priced at such a level as to lead to production from
our assets ceasing to be economic and thus may have a material adverse effect on our business, results of operations, financial condition,
cash flows or prospects.
Furthermore, our use of third-party infrastructure exposes us to the possibility that such infrastructure will cease to be operational or
be decommissioned and therefore require us to source alternative export routes and/or prevent economic production from our assets.
This could also have a material adverse effect on our business, results of operations, financial condition, cash flows or prospects.
Failure by us, our contractors or our primary offtakers to obtain access to necessary equipment and transportation systems
could materially and adversely affect our business, results of operations, financial condition, cash flows or prospects.
We rely on our natural gas and oil field suppliers and contractors to provide materials and services that facilitate our production
activities, including plugging and abandonment contractors. Any competitive pressures on the oil field suppliers and contractors could
result in a material increase of costs for the materials and services required to conduct our business and operations. For example, we
are dependent on the availability of plugging vendors to help us satisfy abandonment schedules that we have agreed to with the states
of Ohio, West Virginia, Kentucky and Pennsylvania. Such personnel and services can be scarce and may not be readily available at the
times and places required. Future cost increases could have a material adverse effect on our asset retirement liability, operating
income, cash flows and borrowing capacity and may require a reduction in the carrying value of our properties, our planned level of
spending for development and the level of our reserves. Prices for the materials and services we depend on to conduct our business
may not be sustained at levels that enable us to operate profitably.
We and our offtakers rely, and any future offtakers will rely, upon the availability of pipeline and storage capacity systems, including
such infrastructure systems that are owned and operated by third parties. As a result, we may be unable to access or source alternatives
for the infrastructure and systems which we currently use or plan to use, or otherwise be subject to interruptions or delays in the
availability of infrastructure and systems necessary for the delivery of our natural gas, NGLs and oil to commercial markets. In
addition, such infrastructure may be close to its design life and decisions may be taken to decommission such infrastructure or perform
life extension work to maintain continued operations. Any of these events could result in disruptions to our projects and thereby
impact our ability to deliver natural gas, NGLs and oil to commercial markets and/or may increase our costs associated with the
production of natural gas, NGLs and oil reliant upon such infrastructure and systems. Further, our offtakers could become subject to
increased tariffs imposed by government regulators or the third-party operators or owners of the transportation systems available for
the transport of our natural gas, NGLs and oil, which could result in decreased offtaker demand and downward pricing pressure.
If we are unable to access infrastructure systems facilitating the delivery of our natural gas, NGLs and oil to commercial markets due
to our contractors or primary offtakers being unable to access the necessary equipment or transportation systems, our operations will
be adversely affected. If we are unable to source the most efficient and expedient infrastructure systems for our assets then delivery of
our natural gas, NGLs and oil to the commercial markets may be negatively impacted, as may our costs associated with the production
of natural gas, NGLs and oil reliant upon such infrastructure and systems.
A proportion of our equipment has substantial prior use and significant expenditure may be required to maintain operability
and operations integrity.
A part of our business strategy is to optimize or refurbish producing assets where possible to maximize the efficiency of our operations
while avoiding significant expenses associated with purchasing new equipment. Our producing assets and midstream infrastructure
require ongoing maintenance to ensure continued operational integrity. For example, some older wells may struggle to produce
suitable line pressure and will require the addition of compression to push natural gas. Despite our planned operating and capital
expenditures, there can be no guarantee that our assets or the assets we use will continue to operate without fault and not suffer
24
Form 10-K | Diversified Energy Company |
material damage in this period through, for example, wear and tear, severe weather conditions, natural disasters or industrial accidents.
If our assets, or the assets we use, do not operate at or above expected efficiencies, we may be required to make substantial
expenditures beyond the amounts budgeted. Any material damage to these assets or significant capital expenditure on these assets for
improvement or maintenance may have a material adverse effect on our business, results of operations, financial condition, cash flows
or prospects. In addition, as with planned operating and capital expenditure, there is no guarantee that the amounts expended will
ensure continued operation without fault or address the effects of wear and tear, severe weather conditions, natural disasters or
industrial accidents. We cannot guarantee that such optimization or refurbishment will be commercially feasible to undertake in the
future and we cannot provide assurance that we will not face unexpected costs during the optimization or refurbishment process.
We depend on our directors, key members of management, independent experts, and technical and operational service
providers and on our ability to retain and hire such persons to effectively manage our growing business.
Our future operating results depend in significant part upon the continued contribution of our directors, key senior management and
technical, financial and operations personnel. Management of our growth will require, among other things, stringent control of
financial systems and operations, the continued development of our control environment, the ability to attract and retain sufficient
numbers of qualified management and other personnel, the continued training of such personnel and the presence of adequate
supervision.
In addition, the personal connections and relationships of our directors and key management are important to the conduct of our
business. If we were to unexpectedly lose a member of our key management or fail to maintain one of the strategic relationships of our
key management team, our business, results of operations, financial condition, cash flows or prospects could be materially adversely
affected. In particular, we are very dependent on our Chief Executive Officer, Robert Russell (“Rusty”) Hutson, Jr. Acquisitions are a
key part of our strategy, and Mr. Hutson has been instrumental in sourcing them and securing their financing. Furthermore, as our
founder, Mr. Hutson is strongly associated with our success, and if he were to cease being the Chief Executive Officer, perception of
our future prospects may be diminished.
Attracting and retaining additional skilled personnel will be fundamental to the continued growth and operation of our business. We
require skilled personnel in the areas of development, operations, engineering, business development, natural gas, NGLs and oil
marketing, finance and accounting relating to our projects. Personnel costs, including salaries, are increasing as industry wide demand
for suitably qualified personnel increases. We may not successfully attract new personnel and retain existing personnel required to
continue to expand our business and to successfully execute and implement our business strategy.
We may face unanticipated water and other waste disposal costs.
We may be subject to regulation that restricts our ability to discharge water produced as part of our natural gas, oil and NGL
production operations. Productive zones frequently contain water that must be removed for the natural gas, oil and NGL to produce,
and our ability to remove and dispose of sufficient quantities of water from the various zones will determine whether we can produce
natural gas, oil and NGL in commercial quantities. The produced water must be transported from the leasehold and/or injected into
disposal wells. The availability of disposal wells with sufficient capacity to receive all of the water produced from our wells may
affect our ability to produce our wells. Also, the cost to transport and dispose of that water, including the cost of complying with
regulations concerning water disposal, may reduce our profitability. We have entered into various water management services
agreements in the Appalachian Region which provide for the disposal of our produced water by established counterparties with large
integrated pipeline networks. If these counterparties fail to perform, we may have to shut in wells, reduce drilling activities, or upgrade
facilities for water handling or treatment. The costs to dispose of this produced water may increase for a number of reasons, including
if new laws and regulations require water to be disposed in a different manner.
In 2016, the EPA adopted effluent limitations for the treatment and discharge of wastewater resulting from onshore unconventional
natural gas, oil and NGL extraction facilities to publicly owned treatment works. In addition, the injection of fluids gathered from
natural gas, oil and NGL producing operations in underground disposal wells has been identified by some groups and regulators as a
potential cause of increased seismic events in certain areas of the country, including the states of West Virginia, Ohio and Kentucky in
the Appalachian Region as well as Oklahoma, Texas and Louisiana in our Central Region. Certain states, including those located in
the Appalachian Region have adopted, or are considering adopting, laws and regulations that may restrict or prohibit oilfield fluid
disposal in certain areas or underground disposal wells, and state agencies implementing those requirements may issue orders directing
certain wells in areas where seismic events have occurred to restrict or suspend disposal well permits or operations or impose certain
conditions related to disposal well construction, monitoring, or operations. Any of these developments could increase our cost to
dispose of our produced water.
We may incur significant costs and liabilities resulting from performance of pipeline integrity programs and related repairs.
Pursuant to the authority under the Natural Gas Pipeline Safety Act of 1968 (“NGPSA”) and Hazardous Liquid Pipeline Safety Act of
1979 (“HLPSA”), as amended by the Pipeline Safety Improvement Act of 2002 (“PSIA”), the Pipeline Inspection, Protection,
Enforcement and Safety Act of 2006 (“PIPESA”) and the Pipeline Safety, Regulatory Certainty, and Job Creation Act of 2011 (the
“2011 Pipeline Safety Act”), the PHMSA has promulgated regulations requiring pipeline operators to develop and implement integrity
25
Form 10-K | Diversified Energy Company |
management programs for certain gas and hazardous liquid pipelines that, in the event of a pipeline leak or rupture could affect high
consequence areas (“HCAs”), which are areas where a release could have the most significant adverse consequences, including high-
population areas, certain drinking water sources and unusually sensitive ecological areas. These regulations require operators of
covered pipelines to:
•Perform ongoing assessments of pipeline integrity;
•Identify and characterize applicable threats to pipeline segments that could impact HCAs;
•Improve data collection, integration and analysis;
•Repair and remediate the pipeline as necessary; and
•Implement preventive and mitigating actions.
In addition, states have adopted regulations similar to existing PHMSA regulations for certain intrastate gas and hazardous liquid
pipelines. At this time, we cannot predict the ultimate cost of compliance with applicable pipeline integrity management regulations,
as the cost will vary significantly depending on the number and extent of any repairs found to be necessary as a result of pipeline
integrity testing, but the results of these tests could cause us to incur significant and unanticipated capital and operating expenditures
for repairs or upgrades deemed necessary to ensure the safe and reliable operation of our pipelines.
At this time, we cannot predict the cost of such requirements, but they could be significant. Moreover, federal and state legislative and
regulatory initiatives relating to pipeline safety that require the use of new or more stringent safety controls or result in more stringent
enforcement of applicable legal requirements could subject us to increased capital costs, operational delays and costs of operation.
Moreover as of January 2025, the maximum civil penalties PHMSA can impose are $272,926 per pipeline safety violation per day,
with a maximum of $2,729,245 for a related series of violations. The safety enhancement requirements and other provisions of the
2011 Pipeline Safety Act as well as any implementation of PHMSA regulations thereunder or any issuance or reinterpretation of
guidance by PHMSA or any state agencies with respect thereto could require us to install new or modified safety controls, pursue
additional capital projects or conduct maintenance programs on an accelerated basis, any or all of which tasks could result in our
incurring increased operating costs that could have a material adverse effect on our results of operations or financial position. States
are also pursuing regulatory programs intended to safely build pipeline infrastructure. The adoption of new or amended regulations by
PHMSA or the states that result in more stringent or costly pipeline integrity management or safety standards could have a significant
adverse effect on us and similarly situated midstream operators.
Risks Relating to Our Financing, Acquisitions, Investment and Indebtedness
Inflation may adversely affect us by increasing costs beyond what we can recover through price increases and limit our ability
to enter into future debt financing.
Inflation can adversely affect us by increasing costs of materials, equipment, labor and other services. In addition, inflation is often
accompanied by higher interest rates. Continued inflationary pressures could impact our profitability. Though we believe that the rates
of inflation in recent years, including the 12 months ended December 31, 2025, have not had a significant impact on our operations, a
continued increase in inflation, including inflationary pressure on labor, could result in increases to our operating costs, and we may be
unable to pass these costs on to our customers. These inflationary pressures could also adversely impact our ability to procure
materials and equipment in a cost-effective manner, which could result in reduced margins and production delays and, as a result, our
business, financial condition, results of operations and cash flows could be materially and adversely affected. We continue to
undertake actions and implement plans to address these inflationary pressures and protect the requisite access to materials and
equipment. With respect to our costs of capital, our ABS Notes (as defined in the Notes to the Consolidated Financial Statements) are
fixed-rate instruments (described in Note 15 in the Notes to the Consolidated Financial Statements) and as of February 25, 2026, we
had $243 million outstanding on our Credit Facility and $500 million of 9.75% senior secured bonds due 2029. Nevertheless, inflation
may also affect our ability to enter into future debt financing, including refinancing of our Credit Facility or issuing additional SPV-
level asset backed securities, as high inflation may result in a relative increase in the cost of debt capital.
We are taking efforts to mitigate inflationary pressures, by working closely with other suppliers and service providers to ensure
procurement of materials and equipment in a cost-effective manner. However, these mitigation efforts may not succeed or may be
insufficient.
Concerns about global economic growth have had a significant adverse impact on global financial markets and commodity prices. If
the economic climate in the United States or abroad deteriorates, worldwide demand for petroleum products could diminish further,
which could impact the price at which natural gas, NGLs and oil can be sold, which could affect our results of operations, financial
condition, cash flows and prospects.
There are risks inherent in our acquisitions of natural gas and oil assets.
Acquisitions are an essential part of our strategy for protecting and growing cash flow, particularly in relation to the risk that some of
our wells may have a higher than anticipated production decline rate. Over the past several years, we have undertaken a number of
26
Form 10-K | Diversified Energy Company |
acquisitions of natural gas and oil assets (and of companies holding such assets). Our ability to complete future acquisitions will
depend on us being able to identify suitable acquisition candidates and negotiate favorable terms for their acquisition, in each case,
before any attractive candidates are purchased by other parties such as private equity firms, some of whom have substantially greater
financial and other resources than we do. We may face competition for attractive acquisition targets that may also increase the price of
the target business. As a result, there is no assurance that we will always be able to source and execute acquisitions in the future at
attractive valuations.
Furthermore, an acquisition in a new area in which we lack experience may present unanticipated risks and challenges that were not
accounted for or previously experienced. Ordinarily, our due diligence efforts are focused on higher valued and material properties or
assets. Even an in-depth review of all properties and records may not reveal all existing or potential problems, nor will such review
always permit a buyer to become sufficiently familiar with the properties to fully assess their deficiencies and capabilities. Generally,
physical inspections are not performed on every well or facility, and structural or environmental problems are not necessarily
observable even when an inspection is undertaken.
There can be no assurance that our prior acquisitions or any other potential acquisition will perform operationally as anticipated or be
profitable. We could fail to appropriately value any acquired business and the value of any business, company or property that we
acquire or invest in may actually be less than the amount paid for it or its estimated production capacity. We may be required to
assume pre-closing liabilities with respect to an acquisition, including known and unknown title, contractual, and environmental and
decommissioning liabilities, and may acquire interests in properties on an “as is” basis without recourse to the seller of such interest or
the seller may have limited resources to provide post-sale indemnities.
In addition, successful acquisitions of gas and oil assets require an assessment of a number of factors, including estimates of
recoverable reserves, the time of recovering reserves, exploration potential, future natural gas, NGLs and oil prices and operating
costs. Such assessments are inexact, and we cannot guarantee that we make these assessments with a high degree of accuracy. In
connection with assessments, we perform a review of the acquired assets. However, such a review will not reveal all existing or
potential problems. Furthermore, review may not permit us to become sufficiently familiar with the assets to fully assess their
deficiencies and capabilities.
We may be unable to make attractive acquisitions or successfully integrate acquired businesses, and any inability to do so may
disrupt our business and hinder our ability to grow.
In the future we may make acquisitions of businesses that complement or expand our current business. However, we may not be able
to identify attractive acquisition opportunities. Even if we do identify attractive acquisition opportunities, we may not be able to
complete the acquisition or do so on commercially acceptable terms.
The success of any completed acquisition will depend on our ability to integrate effectively the acquired business into our existing
operations. The process of integrating acquired businesses may involve unforeseen difficulties and may require a disproportionate
amount of our managerial and financial resources. In addition, possible future acquisitions may be larger and for purchase prices
significantly higher than those paid for earlier acquisitions. No assurance can be given that we will be able to identify additional
suitable acquisition opportunities, negotiate acceptable terms, obtain financing for acquisitions on acceptable terms or successfully
acquire identified targets. Our failure to achieve consolidation savings, to integrate the acquired businesses and assets into our existing
operations successfully or to minimize any unforeseen operational difficulties could have a material adverse effect on our financial
condition and results of operations.
Our Credit Facility and other debt agreements also limit our ability to incur certain indebtedness, which could indirectly limit our
ability to engage in acquisitions of businesses.
The Company’s success will be impacted by its ability to fully integrate Canvas and deliver the value of the combined
underlying businesses; the full financial benefits expected from the Company may not be fully achieved.
While the Company believes that the financial benefits of the Canvas acquisition and the costs associated with the Canvas acquisition
have been reasonably estimated, unanticipated events or liabilities may arise or become apparent which may, in turn, result in a delay
or reduction in the benefits anticipated to be derived from the Canvas acquisition, or in costs significantly in excess of those estimated.
No assurance can be given that the integration process will deliver all or substantially all of the expected benefits or realize any such
benefits within the assumed timeframe, or that the costs to integrate and achieve the financial benefits will not be higher than
anticipated.
Further, the demands that the integration process may have on management time could result in diversion of the attention of the
Company's management and employees from ongoing operations, pursuing other potential business opportunities and may cause a
delay in other projects currently contemplated by the Company. To the extent that the combined company is unable to efficiently
integrate the operations of the Company and Canvas, realize anticipated financial benefits, retain key personnel and avoid unforeseen
costs or delay, there may be a material adverse effect on the business, results of operations, financial condition, cash flows or
prospects of the Company.
27
Form 10-K | Diversified Energy Company |
We may not have good title to all our assets and licenses.
Although we believe that we take due care and conduct due diligence on new acquisitions in a manner that is consistent with industry
practice, there can be no assurance that we have good title to all our assets and the rights to develop and produce natural gas and oil
from our assets. Such reviews are inherently incomplete and it is generally not feasible to review in depth every individual well or
field involved in each acquisition. There can be no assurance that any due diligence carried out by us or by third parties on our behalf
in connection with any assets that we acquire will reveal all of the risks associated with those assets, and the assets may be subject to
preferential purchase rights, consents and title defects that were not apparent at the time of acquisition. We may acquire interests in
properties on an “as is” basis without recourse to the seller of such interest or the seller may have limited resources to provide post-
sale indemnities. In addition, changes in law or change in the interpretation of law or political events may arise to defeat or impair our
claim to certain properties which we currently own or may acquire which could result in a material adverse effect on our business,
results of operations, financial condition, cash flows or prospects.
Restrictions in our existing and future debt agreements could limit our growth and our ability to engage in certain activities.
Our Credit Facility and other debt agreements contain a number of significant covenants that may limit our ability to, among other
things:
•Incur additional indebtedness;
•Incur liens;
•Sell assets;
•Make certain debt payments;
•Enter into agreements that restrict or prohibit the payment of dividends;
•Limits our subsidiaries’ ability to make certain payments with respect to their equity, based on the pro forma effect thereof on
certain financial ratios, which would be the source of distributable profits and available cash from which we may issue a dividend;
and
•Conduct hedging activities.
In addition, our Credit Facility and other debt agreements require us to maintain compliance with certain financial covenants.
We may also be prevented from taking advantage of business opportunities that arise because of the limitations from the restrictive
covenants under our Credit Facility and other debt agreements. These restrictions may limit our ability to obtain future financings to
withstand a future downturn in our business or the economy in general, or to otherwise conduct necessary corporate activities.
A material uncured breach of any covenant in our Credit Facility and other debt agreements will result in a default under the
agreement and may result in an event of default if such default is not cured during any applicable grace period. An event of default, if
not waived, could result in acceleration of the indebtedness outstanding and in an event of default with respect to, and an acceleration
of, the indebtedness outstanding under any other debt agreements to which we are a party. Any such accelerated indebtedness would
become immediately due and payable. If that occurs, we may not be able to make all of the required payments or borrow sufficient
funds to refinance such indebtedness. Even if new financing were available at that time, it may not be on terms that are acceptable to
us.
Any significant reduction in our borrowing base under our Credit Facility as a result of periodic borrowing base
redeterminations or otherwise may negatively impact our ability to fund our operations.
Our Credit Facility limits the amounts we can borrow up to a borrowing base amount, which the lenders, in their sole discretion,
unilaterally determine based upon our reserve reports for the applicable period and other data and reports. Such determinations will be
made on a regular basis semi-annually (each a “Scheduled Redetermination”) and at the option of the lenders with more than 66.6% of
the loans and commitments under the Credit Facility, no more than one time in between each Scheduled Redetermination. As of
February 25, 2026, our borrowing base was $825 million.
In the future, we may not be able to access adequate funding under our Credit Facility as a result of a decrease in our borrowing base
due to the issuance of new indebtedness, the outcome of a borrowing base redetermination, or an unwillingness or inability on the part
of lending counterparties to meet their funding obligations and the inability of other lenders to provide additional funding to cover a
defaulting lender’s portion. Declines in commodity prices from their current levels could result in a determination to lower the
borrowing base and, in such a case, we could be required to repay any indebtedness in excess of the redetermined borrowing base. As
a result, we may be unable to make acquisitions or otherwise carry out business plans, which could have a material adverse effect on
our business, results of operations, financial condition, cash flows or prospects.
28
Form 10-K | Diversified Energy Company |
The securitizations of our limited purpose, bankruptcy-remote, wholly owned subsidiaries may expose us to financing and
other risks, and there can be no assurance that we will be able to access the securitization market in the future, which may
require us to seek more costly financing.
Through limited purpose, bankruptcy-remote, wholly owned subsidiaries (“SPVs”), we have securitized and expect to securitize in the
future, certain of our assets to generate financing. In such transactions, we convey a pool of assets to an SPV, that, in turn, issues
certain securities or enters into certain debt agreements. The securities issued by the SPVs are each collateralized by a pool of assets.
In exchange for the transfer of finance receivables to the SPV, we typically receive the cash proceeds from the sale of the securities or
entering into term loans.
Although our SPVs have completed securitizations in connection with the ABS IV Notes, ABS VI Notes, ABS VII Notes, ABS VIII
Notes (which now covers ABS III Notes and ABS V Notes), ABS IX Notes, ABS X Notes (which now covers Term Loan I, ABS I
Notes, and ABS II Notes) (each as defined herein), and ABS XI Notes, there can be no assurance that we, through our SPVs, will be
able to complete additional securitizations, particularly if the securitization markets become constrained. In addition, the value of any
securities that our limited purpose, bankruptcy-remote, wholly owned subsidiaries retain in our securitizations, including securities
retained to comply with applicable risk retention rules, might be reduced or, in some cases, eliminated as a result of an adverse change
in economic conditions or the financial markets. In addition, our ABS IV Notes, ABS VI Notes, ABS VII Notes, ABS VIII Notes
(which now covers ABS III Notes and ABS V Notes), ABS IX Notes, ABS X Notes (which now covers Term Loan I, ABS I Notes,
and ABS II Notes), and ABS XI Notes are subject to customary accelerated amortization events, including events tied to the failure to
maintain stated debt service coverage ratios.
If it is not possible or economical for us to securitize our assets in the future, we would need to seek alternative financing to support
our operations and to meet our existing debt obligations, which may be less efficient and more expensive than raising capital via
securitizations and may have a material adverse effect on our results of operations, financial condition, cash flows and liquidity.
An increase in interest rates would increase the cost of servicing our indebtedness and could reduce our profitability, decrease
our liquidity and impact our solvency.
Our Credit Facility provides for, and our future debt agreements may provide for, debt incurred thereunder to bear interest at variable
rates. As of February 25, 2026, we had $243 million outstanding on our Credit Facility. Increases in interest rates would increase the
cost of servicing indebtedness under our Credit Facility or under future debt agreements subject to interest at variable rates, and
materially reduce our profitability, decrease our liquidity and impact our solvency.
Our hedging activities could result in financial losses or could reduce our net income.
To achieve more predictable cash flows, we employ a hedging strategy involving opportunistically hedging a majority of our first two
years of production as well as hedging a significant percentage of production beyond our first two years of forecasted production.
Even so, the remainder of our production that is unhedged is exposed to the continuing and prolonged declines in the prices of natural
gas, NGLs and oil. Our results of operations and financial condition would be negatively impacted if the prices of natural gas, NGLs
or oil were to remain depressed or decline materially from current levels. To achieve more predictable cash flows and to reduce our
exposure to fluctuations in the prices of natural gas, NGLS and oil, we may enter into additional hedging arrangements for a
significant portion of our production.
Our derivative contracts may result in substantial gains or losses. For example, we reported income from operations of $535 million
for the year ended December 31, 2025, compared to a loss of $97 million for the year ended December 31, 2024 and income of
$1.1 billion for the year ended December 31, 2023. While our earnings are impacted by a variety of factors as described in Results of
Operations, a key driver of our year-over-year change from a loss to income was attributable to a change of $255 million in the mark-
to-market valuation adjustment on our derivative financial instrument valuations to a gain of $218 million in 2025 from a loss of $38
million in 2024. There can be no assurance that we will not realize additional losses due to our hedging activities in the future. In
addition, if we enter into any derivative contracts and experience a sustained material interruption in our production, we might be
forced to satisfy all or a portion of our hedging obligations without the benefit of the cash flows from our sale of the underlying
physical commodity, resulting in a substantial diminution of our liquidity. Our ability to use hedging transactions to protect us from
future natural gas, NGL and oil price volatility will be dependent upon natural gas, NGL and oil prices at the time we enter into future
hedging transactions and our future levels of hedging and, as a result, our future net cash flows may be more sensitive to commodity
price changes. In addition, if commodity prices remain low, we will not be able to replace our hedges or enter into new hedges at
favorable prices.
Our price hedging strategy and future hedging transactions will be determined at our discretion, subject to the terms of certain
agreements governing our indebtedness. The prices at which we hedge our production in the future will be dependent upon commodity
prices at the time we enter into these transactions, which may be substantially higher or lower than current prices. Accordingly, our
price hedging strategy may not protect us from significant declines in prices received for our future production. Conversely, our
hedging strategy may limit our ability to realize cash flows from commodity price increases. It is also possible that a substantially
29
Form 10-K | Diversified Energy Company |
larger percentage of our future production will not be hedged as compared with the next few years, which would result in our natural
gas, NGL and oil revenues becoming more sensitive to commodity price fluctuations.
The failure of our hedge counterparties to meet their obligations to us may adversely affect our financial results.
An attendant risk exists in hedging activities that the counterparty in any derivative transaction cannot or will not perform under the
instrument and that we will not realize the benefit of the hedge. Disruptions in the financial markets could lead to sudden decreases in
a counterparty’s liquidity, which could make them unable to perform under the terms of the derivative contract and we may not be
able to realize the benefit of the derivative contract. Any default by the counterparty to these derivative contracts when they become
due would have a material adverse effect on our results of operations, financial condition, cash flows and prospects.
We may not be able to enter into commodity derivatives on favorable terms or at all.
To achieve a more predictable cash flow, we employ a hedging strategy involving opportunistically hedging a majority of our first two
years of production as well as hedging a significant percentage of production beyond our first two years of forecasted production. If
we are unable to maintain sufficient hedging capacity with our counterparties, we could have greater exposure to changes in
commodity prices and interest rates, which could have a material adverse impact on our business, results of operations, financial
condition, cash flows or prospects.
Risks Relating to Legal, Tax, Environmental and Regulatory Matters
We are subject to regulation and liability under environmental, health and safety regulations, the violation of which may affect
our financial condition and operations.
We operate in an industry that has certain inherent hazards and risks, and consequently we are subject to stringent and comprehensive
laws and regulations, especially with regard to the protection of health, safety and the environment. For example, we are subject to
laws and regulations related to occupational safety and health, hydraulic fracturing activities, air emissions, soil and water quality, the
protection of threatened and endangered plant and animal species, biodiversity and ecosystems, and the safety of our assets and
employees. Although we believe that we have adequate procedures in place to mitigate operational risks, there can be no assurances
that these procedures will be adequate to address every potential health, safety and environmental hazard, and a failure to adequately
mitigate risks may result in loss of life, injury, or adverse impacts on the health of employees, contractors and third-parties or the
environment. Any failure by us or one of our subcontractors, whether inadvertent or otherwise, to comply with applicable legal or
regulatory requirements may give rise to civil, administrative and/or criminal liabilities, civil fines and penalties, delays or restrictions
in acquiring or disposing of assets and/or delays in securing or maintaining required permits, licenses and approvals. Further, a lack of
regulatory compliance may lead to denial, suspension, or termination of permits, licenses, or approvals that are required to operate our
sites or could result in other operational restrictions or obligations. Our health, safety and environmental policies require us to observe
local, state and national legal and regulatory requirements and to apply generally accepted industry best practices where legislation or
regulation does not exist.
The terms and conditions of licenses, permits, regulatory orders, approvals or permissions may include more stringent operational,
environmental and/or health and safety requirements. Obtaining development or production licenses and permits may become more
difficult or may be delayed due to federal, regional, state or local governmental constraints, considerations, or requirements on issuing.
Furthermore, third-parties such as environmental NGOs may administratively or judicially contest or protest licenses and permits
already granted by relevant authorities or applications for the same and operations may be subject to other administrative or judicial
challenges.
In addition, under certain environmental laws and regulations, we could be subject to joint and several strict liability for the removal or
remediation of previously released materials, pollution, or property contamination regardless of whether we were responsible for the
release or contamination or whether the operations were in compliance with all applicable laws at the time those actions were taken.
Private parties, including the owners of properties on or adjacent to well sites and facilities where petroleum hydrocarbons or wastes
are taken for reclamation or disposal, may also have the right to pursue legal actions as well as to seek damages for non-compliance
with environmental laws and regulations or for personal injury or property damage. In addition, the risk of accidental spills or releases
of pollutants or contaminants could expose us to significant liabilities that could have a material adverse effect on our business,
financial condition and results of operations.
We incur, and expect to continue to incur, capital and operating costs in an effort to comply with increasingly complex operational
health and safety and environmental laws and regulations. New laws and regulations, the imposition of more stringent requirements in
permits and licenses, increasingly strict enforcement of, or new interpretations of, existing laws, regulations and permits and licenses,
or the discovery of previously unknown contamination or hazards may require further costly expenditures to, for example:
•Modify operations, including an increase in plugging and abandonment operations;
•Install or upgrade pollution or emissions control equipment;
•Perform site clean ups, including the remediation and reclamation of gas and oil sites;
•Curtail or cease certain operations;
30
Form 10-K | Diversified Energy Company |
•Provide financial securities, bonds, and/or take out insurance; or
•Pay fees or fines or make other payments for pollution, discharges to the environment or other breaches of environmental or
health and safety requirements or consent agreements with regulatory agencies.
We cannot predict with any certainty the full impact of any new laws, regulations, or policies on our operations or on the cost or
availability of insurance to cover the risks associated with such operations. The costs of such measures and liabilities related to
potential operational health and safety or environmental risks associated with the Company may increase, which could materially and
adversely affect our business, results of operations, financial condition, cash flows or prospects. In addition, it is not possible to predict
what future operational health and safety or environmental laws and regulations will be enacted or how current or future operational,
health, safety or environmental laws and regulations will be applied or enforced. We may have to incur significant expenditure for the
installation and operation of additional systems and equipment for monitoring and carry out remedial measures in the event that
operational health and, safety and environmental regulations become more stringent or costly reform is implemented by regulators.
Any such expenditure may have a material adverse effect on our business, results of operations, financial condition, cash flows or
prospects. No assurance can be given that compliance with occupational health and safety and environmental laws or regulations in the
regions where we operate will not result in a curtailment of production or a material increase in the cost of production or development
activities.
Heightened attention to sustainability matters may impact our business and financial results.
In recent years, heightened attention has been given to corporate activities related to sustainability matters in public discourse and the
investment community. A number of advocacy groups, both domestically and internationally, have previously campaigned for
governmental and private action to promote change at public companies related to sustainability matters, including through the
investment and voting practices of investment advisers, public pension funds, activist investors, universities and other members of the
investing community. These activities include attention and demands for action related to weather events and promoting the use of
alternative forms of energy. These activities may result in demand shifts for oil and natural gas products and additional governmental
investigations and private litigation against us. In addition, stakeholder views continue to evolve and vary, and our initiatives related to
these matters, which rely on standards for measuring progress that are subject to change, are unlikely to satisfy all stakeholders. Our
failure to comply with evolving investor or customer expectations and standards (which may support or disfavor sustainability
initiatives) or if we are perceived to not have responded appropriately to the growing concern for sustainability issues, regardless of
whether there is a legal requirement to do so, could cause reputational harm to our business, increase our risk of litigation, including as
a result of heightened scrutiny of and challenges to sustainability initiatives and related claims, and could have a material adverse
effect on our results of operation.
In addition, organizations that provide information to investors on corporate governance and related matters have developed ratings
systems for evaluating companies on their approach to sustainability matters. These ratings are used by some investors to inform their
investment and voting decisions. Unfavorable sustainability ratings may lead to increased negative investor sentiment toward us and
our industry and to the diversion of investment to other companies or industries, which could have a negative impact on our stock
price and our access to and costs of capital. Also, institutional lenders may decide not to provide funding for oil and natural gas
companies based on weather event-related concerns, which could affect our access to capital for potential growth projects.
The U.S. administration, acting through the executive branch and/or in coordination with Congress, could enact or rescind
rules and regulations that may impact our operations.
Governmental, scientific and public concern over the threat of weather events has resulted in increasing political risks in the United
States, including weather event-related commitments and uncertainty expressed by some officials and political candidates who are
now, or may in the future be, in political office.
While our operations are largely not conducted on federal lands, we may in the future consider acquisitions of natural gas and oil
assets located in areas in which the development of such assets would require permits and authorizations to be obtained from or issued
by federal agencies. To conduct these operations, we may be required to file applications for permits, seek agency authorizations and
comply with various other statutory and regulatory requirements. Further, new oil and gas leasing on public lands has been the subject
of recent proposed executive action rescinding weather event-related initiatives and requirements. Complying with these evolving
requirements may adversely affect our ability to conduct operations at the costs and in the time periods anticipated, and may
consequently adversely impact our anticipated returns from our operations.
Any such measures or increased costs could have a material adverse effect on our business, results of operations, financial condition,
cash flows or prospects.
31
Form 10-K | Diversified Energy Company |
Our operations are dependent on our compliance with obligations under permits, licenses, contracts and field development
plans.
Our operations must be carried out in accordance with the terms of permits, licenses, operating agreements, annual work programs and
budgets. Fines, penalties, or enforcement actions may be imposed and a permit or license may be suspended or terminated if a permit
or license holder, or party to a related agreement, fails to comply with its obligations under such permit, license or agreement, or fails
to make timely payments of levies and taxes for the licensed activity, or fails to provide the required geological information or meet
other reporting requirements. It may from time to time be difficult to ascertain whether we have complied with obligations under
permits or licenses as the extent of such obligations may be unclear or ambiguous and regulatory authorities in jurisdictions in which
we do business, or in which we may do business in the future, may not be forthcoming with confirmatory statements that work
obligations have been fulfilled, which can lead to further operational uncertainty.
In addition, we and our commercial partners, as applicable, have obligations to operate assets in accordance with specific requirements
under certain licenses and related agreements, field development agreements, laws and regulations. If we or our partners were to fail to
satisfy such obligations with respect to a specific field, the license or related agreements for that field may be suspended, revoked or
terminated. Although we have in the past acquired and may in the future acquire shale assets, a significant source of our natural gas
and crude oil remains conventional wells. In some instances, these conventional wells are located on the same property as
unconventional wells that produce shale oil and gas. In these cases, the rights to access the shale layers of the property will typically
be conditioned on the ongoing productivity of conventional wells on the property. Furthermore, the shale rights may be owned by a
third party, and in such instances, we will enter into a joint use agreement with the third party. This joint use agreement may stipulate
that in consideration for permission to operate the conventional wells, we are to use reasonable efforts to maintain production so that the
third party retains the shale licenses. If we fail to maintain production in the conventional wells, under the joint use agreement, we may
be liable to the third party for replacing the lost land rights. The relevant authorities are typically authorized to, and do from time to time,
inspect to verify compliance by us or our commercial partners, as applicable, with relevant laws and the licenses or the agreements
pursuant to which we conduct our business. There can be no assurance that the views of the relevant government agencies regarding the
development of the fields that we operate or the compliance with the terms of the licenses pursuant to which we conduct such operations
will coincide with our views, which might lead to disagreements that may not be resolved.
The suspension, revocation, withdrawal or termination of any of the permits, licenses or related agreements pursuant to which we may
conduct business, as well as any delays in the continuous development of or production at our fields caused by the issues detailed
above could materially and adversely affect our business, results of operations, financial condition, cash flows or prospects. In
addition, failure to comply with the obligations under the permits, licenses or agreements pursuant to which we conduct business,
whether inadvertent or otherwise, may lead to fines, penalties, restrictions, enforcement actions brought by governmental authorities,
withdrawal of licenses and termination of related agreements.
We do not insure against certain risks and our insurance coverage may not be adequate for covering losses arising from
potential operational hazards and unforeseen interruptions.
We insure our operations in accordance with industry practice and plan to continue to insure the risks we consider appropriate for our
needs and circumstances. However, we may elect not to have insurance for certain risks, due to the high premium costs associated
with insuring those risks or for various other reasons, including an assessment in some cases that the risks are remote.
Our insurance may not be adequate to cover all losses or liabilities we may suffer. We cannot assure that we will be able to obtain
insurance coverage at reasonable rates (or at all), or that any coverage we or the relevant operator obtain, and any proceeds of
insurance, will be adequate and available to cover any claims arising. We may become subject to liability for pollution, blow-outs or
other hazards against which we have not insured or cannot insure, including those in respect of past activities for which we were not
responsible. Any indemnities we may receive from sub-contractors, operators or joint venture partners may be difficult to enforce if
such sub-contractors, operators or joint venture partners lack adequate resources.
Operational insurance policies are usually placed in one year contracts and the insurance market can withdraw cover for certain risks
due to events occurring in other parts of the industry, thus greatly increasing the costs of risk transfer. For example, in September
2018, a gas pipeline operated by another midstream company exploded in Beaver County, Pennsylvania, a state in which we have
operations. The explosion resulted in the destruction of residential property and motor vehicles as well as the evacuation of nearby
households. Catastrophic events such as these may cause the insurance costs for our midstream operations to rise, despite us not being
involved in the catastrophic event. In the event that insurance coverage is not available or our insurance is insufficient to fully cover
any losses, including losses incurred due to lost revenues resulting from third party operations or processing plants, claims and/or
liabilities incurred, or indemnities are difficult to enforce, our business and operations, financial results or financial position may be
disrupted and adversely affected.
The payment by our insurers of any insurance claims may result in increases in the premiums payable by us for our insurance coverage
and could adversely affect our financial performance. In the future, some or all of our insurance coverage may become unavailable or
prohibitively expensive.
32
Form 10-K | Diversified Energy Company |
Our internal systems and website may be subject to intentional and unintentional disruption, and our confidential information
may be misappropriated, stolen or misused, which could adversely impact our reputation and future sales.
We have faced, and may in the future continue to face, cyber-attacks and data security breaches. Such cyber-attacks and breaches may
come from criminal hackers, state-sponsored threat actors, industrial espionage or employee malfeasance and are designed to penetrate
our network security or the security of our internal systems, misappropriate proprietary information and/or cause interruptions to our
services. We expect to continue to face similar threats in the future, and cannot guarantee that we will be able to successfully prevent all
future attacks. Such future attacks could include malware, denial-of-service attacks, data breaches, hacking, social engineering or
"phishing", deepfake attacks, computer viruses, employee or insider threats, malfeasance, supply chain attacks, physical breaches,
vendor email compromise, payment fraud and ransomware attacks. If an actual or perceived breach of our network security occurs, it
could adversely affect our business or reputation, and may trigger governmental notice requirements and public disclosure, and expose
us to the loss of information, fines, regulatory actions, sanctions, litigation and possible liability. An actual security breach could also
impair our ability to operate our business and provide products and services to our customers. Additionally, malicious attacks,
including cyber-attacks, may damage our assets, prevent production at our producing assets, cause disruptions in business operations,
lead to injury to people or harm to the environment and otherwise significantly affect corporate activities. For example, we utilize
electronic monitoring of meters and flow rate devices to monitor pressure build-up in our production wells. If there were a cyber-attack
that penetrated our monitoring systems such that they provided false readings, this could result in an unknown pressure build-up,
creating a dangerous situation which could lead to an explosion. As techniques used to obtain unauthorized access to or to sabotage
systems change frequently and may not be known until launched against us or our third-party service providers, we may be unable to
anticipate or implement adequate measures to protect against these attacks and our service providers may likewise be unable to do so.
Additionally, artificial intelligence has contributed to an increase in the number and sophistication of cyber-attacks. As there continue
to be advances in artificial intelligence, threat actors will develop increasingly sophisticated cyber-attack strategies. This may include
the use of artificial intelligence to enhance and automate phishing schemes, advance malware, or carry out cyber-attacks that are more
effective and more difficult to detect or stop. Such an outcome would have a material adverse impact on our business, results of
operations, financial condition, cash flows or prospects.
In addition, confidential or financial payment information that we maintain may be subject to misappropriation, theft and deliberate or
unintentional misuse by current or former employees, third-party contractors or other parties who have had access to such information.
Any such misappropriation and/or misuse of our information could result in the Company, among other things, being in breach of
certain data protection requirements and related legislation as well as incurring liability to third parties. We expect that we will need to
continue closely monitoring the accessibility and use of confidential information in our business, educate our employees and third-
party contractors about the risks and consequences of any misuse of confidential information and, to the extent necessary, pursue legal
or other remedies to enforce our policies and deter future misuse. If our confidential information is misappropriated, stolen or misused
as a result of a disruption to our website or internal systems this could have a material adverse effect on our business, results of
operations, financial condition, cash flows or prospects.
Although we maintain insurance to protect against losses resulting from certain of data protection breaches and cyber-attacks, our
coverage for protecting against such risks may not be sufficient.
Our operations are subject to the risk of litigation.
From time to time, we may be subject, directly or indirectly, to litigation arising out of our operations and the regulatory environments
in our areas of operations. Historically, categories of litigation that we have faced included actions by royalty owners over payment
disputes, personal injury claims and property related claims, including claims over property damage, trespass or nuisance. Although
we currently face no material litigation that is reasonably expected to have an adverse material impact for which we are not
sufficiently indemnified or insured, damages claimed under such litigation in the future may be material or may be indeterminate, and
the outcome of such litigation, if determined adversely to us, could individually or in the aggregate, be reasonably expected to have a
material and adverse effect on our business, financial position or results of operations. While we assess the merits of each lawsuit and
defend ourselves accordingly, we may be required to incur significant expenses or devote significant resources to defend against such
litigation. In addition, the adverse publicity surrounding such claims may have a material adverse effect on our business.
We are subject to certain tax risks.
Tax legislation may be enacted in the future that could negatively impact our current or future tax structure and effective tax rates.
Following the completion of the U.S. Domestication, our public holding company is a U.S. corporation. Accordingly, any changes in
U.S. federal income tax law could negatively impact our effective tax rate and cash flows, which could cause our business, results of
operations, financial condition, cash flows or prospects to be materially adversely affected.
We are subject to income taxes in the United States, and there can be no certainty that the current taxation regime in the United States
or other jurisdictions within which we currently operate or may operate in the future will remain in force or that the current levels of
corporation taxation will remain unchanged. For example, the U.S. government has imposed a minimum tax on corporations and
proposed and may enact significant changes to the taxation of business entities, including, among others, an increase in the U.S.
33
Form 10-K | Diversified Energy Company |
federal income tax rate applicable to corporations, like us, and surtaxes on certain types of income. Certain U.S. localities also
maintain a severance tax or impact fee on the removal of oil and natural gas from the ground, and such tax rates may be increased or
new severance taxes or impact fees may be implemented.
Our domestic tax liabilities are subject to the allocation of expenses in differing jurisdictions. Our effective tax rate could be adversely
affected by changes in the mix of earnings and losses in taxing jurisdictions with differing statutory tax rates, certain non-deductible
expenses, the valuation of deferred tax assets and liabilities and changes in federal or state tax laws and accounting principles.
Increases in our effective tax rate could materially affect our net financial results. Although we believe that our income tax liabilities
are reasonably estimated and accounted for in accordance with applicable laws and principles, an adverse resolution of one or more
uncertain tax positions in any period could have a material adverse effect on our business, results of operations, financial condition,
cash flows or prospects.
In the past, we have been able to offset a large portion of our U.S. federal income tax burden with marginal well tax credits that are
available to qualified producers who operate lower-volume wells during a low commodity pricing environment. There can be no
assurance that there will be no amendment to the existing taxation laws applicable to us, which may have a material adverse effect on
our financial position. Our ability to utilize marginal well tax credits in the United States could be or become subject to limitations (for
example, if we are deemed to undergo an “ownership change” for applicable U.S. federal income tax purposes).
The nature and amount of tax that we expect to pay and the tax attributes expected to be available to us are each dependent upon
several assumptions, any one of which may change and which would, if so changed, affect the nature and amount of tax payable and
tax attributes available.
Risks Relating to Our Common Stock
The expected benefits of the U.S. Domestication may not be realized.
On November 21, 2025, we completed the U.S. Domestication following our Board’s conclusion that the U.S. market is the natural
long term primary listing venue for the Company and that moving to a US primary listing (while retaining a secondary UK listing) is
in the best interests of the business and its stakeholders. We believe that the U.S. Domestication and moving to a U.S. primary listing
will increase access to a broader set of investors, support inclusion in additional stock indices, streamline our corporate structure, and
provide more flexibility in accessing capital and, as a result, will be beneficial to our business and operations, the holders of our
common stock, and other stakeholders. The success of the U.S. Domestication and moving to a U.S. primary listing will depend, in
part, on our ability to realize the anticipated benefits associated with the U.S. Domestication and associated reorganization of our
corporate structure. There can be no assurance that all of the anticipated benefits of the U.S. Domestication and moving to a U.S.
primary listing will be achieved, particularly as the achievement of the benefits are subject to factors that we do not and cannot
control.
We expect to incur additional costs related to the U.S. Domestication, including non-recurring costs as well as recurring costs a
result of financial reporting obligations of being a “domestic issuer” as opposed to a “foreign private issuer” in the United
States.
We will incur additional legal, accounting and other expenses that may exceed the expenses we incurred prior to the U.S.
Domestication. The obligations of being a public company in the U.S. require significant expenditures and will place significant
demands on our management and other personnel, including costs resulting from public company reporting obligations under the
Exchange Act, and the rules and regulations regarding corporate governance practices, including those under the Sarbanes-Oxley Act
of 2002 (the “Sarbanes-Oxley Act”), the Dodd-Frank Wall Street Reform and Consumer Protection Act of 2010, and the listing
requirements of the New York Stock Exchange (“NYSE”). Additionally, as we are retaining a secondary UK listing, we will also need
to continue to comply with certain UK Listing Rules and certain other applicable requirements.
These rules require that we maintain effective disclosure and financial controls and procedures, internal control over financial
reporting and changes in corporate governance practices, among many other complex rules that are often difficult to monitor and
maintain compliance with. While we were subject to many of these requirements prior to the U.S. Domestication, additional legal and
accounting requirements will apply to us following the U.S. Domestication. Our management and other personnel will need to devote
additional time to ensure compliance with all of these requirements and to keep pace with new regulations, otherwise we may fall out
of compliance and risk becoming subject to litigation or being delisted, among other potential problems.
The requirements of being a public company, including additional rules and regulations that we must comply with now that
we are no longer a foreign private issuer, may strain our resources, divert management’s attention, and affect our ability to
attract and retain executive officers and qualified board members.
We are subject to the reporting requirements of the Exchange Act, the Sarbanes-Oxley Act, the Dodd-Frank Wall Street Reform and
Consumer Protection Act of 2010, the listing requirements of the NYSE and other applicable securities rules and regulations, as well
as certain UK Listing Rules. Compliance with these rules and regulations has increased our legal and financial compliance costs,
making some activities more difficult, time-consuming, and costly, and has increased demand on our systems and resources. The
34
Form 10-K | Diversified Energy Company |
Exchange Act requires, among other things, that we file annual reports with respect to our business and results of operations. The
Sarbanes-Oxley Act requires, among other things, that we maintain effective disclosure controls and procedures and internal control
over financial reporting. In order to maintain and, if required, improve our disclosure controls and procedures and internal control over
financial reporting to meet this standard, significant resources and management oversight is required.
Additionally, as of November 21, 2025, we are no longer a foreign private issuer, and we are required to comply with all of the
provisions applicable to a U.S. domestic issuer under the Exchange Act, including filing an annual report on Form 10-K, quarterly
periodic reports and current reports for certain events, complying with the sections of the Exchange Act regulating the solicitation of
proxies, requiring insiders to file public reports of their share ownership and trading activities and insiders being liable for profit from
trades made in a short period of time. We are also no longer exempt from the requirements of Regulation FD promulgated under the
Exchange Act related to selective disclosures. We are also no longer permitted to follow the UK’s rules in lieu of the corporate
governance obligations imposed by the NYSE, and are required to comply with the governance practices required by U.S. domestic
issuers listed on the NYSE. We are also required to comply with all other rules of the NYSE applicable to U.S. domestic issuers. In
addition, we are required to report our financial results under GAAP, including our historical financial results, which have previously
been prepared in accordance with IFRS.
The regulatory and compliance costs associated with the reporting and governance requirements applicable to U.S. domestic issuers
may be significantly higher than the costs we previously incurred as a foreign private issuer. We expect to continue to incur significant
legal, accounting, insurance and other expenses and to expend greater time and resources to comply with these requirements.
Additionally, as a result of the complexity involved in complying with the rules and regulations applicable to public companies, our
management’s attention may be diverted from other business concerns, which could harm our business, results of operations and
financial condition. In addition, the pressures of operating a public company may divert management’s attention to delivering short-
term results, instead of focusing on long-term strategy. In addition, we may need to develop our reporting and compliance
infrastructure and may face challenges in complying with the new requirements applicable to us. If we fall out of compliance, we risk
becoming subject to litigation or being delisted, among other potential problems.
Item 1B. Unresolved Staff Comments
Not applicable.
Item 1C. Cybersecurity
our IT systems could disrupt our businesses, put employees or others at risk, result in the disclosure of confidential information,
damage our reputation, and create significant financial and legal exposure for DEC.
Governance
cybersecurity strategy that is aligned with our technology posture while also accountable for the detection, mitigation and remediation
of cybersecurity incidents. Our Chief Information Security Officer has over 25 years of experience in the oil and gas industry with
Information Security Management Team, which includes certain members of the Senior Leadership Team including the Chief
Financial Officer, Chief Operating Officer, Chief Information Officer, Head of Internal Audit, Chief Information Security Officer,
reports from our Information Security Management Team on information security matters, including assessing risks, efforts to
educated to provide proper oversight over the cybersecurity program utilizing the National Institute of Standards and Technology
framework.
Risk Management & Strategy
Information Security Team uses advanced network security detection with regular threat testing to detect cybersecurity threats and is
responsible for controlling and protecting our confidential information. They are responsible for testing our cybersecurity crisis
management and business continuity teams including conducting tabletop exercises biennially. The Information Security Team
oversees our IT Security Policy, which includes measures to protect against cyber-attacks, and updates it on an annual basis. They also
addition, we have robust mandatory employee training, phishing simulations, and e-learning sessions delivered quarterly by our digital
security team.
35
Form 10-K | Diversified Energy Company |
materially affect the Company or our strategy, financial condition, or results of operations. However, the scope and impact of any
future incident cannot be predicted. Refer to Item 1A. Risk Factors of this Annual Report on Form 10-K for more information on our
cybersecurity related risks.
Item 2. Properties
Information regarding our properties is included in Item 1. Business and in Supplemental Natural Gas & Oil Information in Part II.
Item 3. Legal Proceedings
We are a party to various routine legal proceedings, disputes and claims arising in the ordinary course of our business, including those
that arise from interpretation of federal and state laws and regulations affecting the crude oil and natural gas exploration and
development industry, personal injury claims, title disputes, royalty disputes, contract claims, contamination claims relating to crude
oil and natural gas exploration and development and environmental claims, including claims involving assets previously sold to third
parties and no longer part of our current operations. While the ultimate outcome of the pending proceedings, disputes or claims, and
any resulting impact on us, cannot be predicted with certainty, we believe that none of these matters, if ultimately decided adversely,
will have a material adverse effect on our financial condition, results of operations or cash flows.
Disclosure of certain environmental matters is required when a governmental authority is a party to the proceedings and the
proceedings involve potential monetary sanctions that we reasonably believe could exceed a specified threshold. Pursuant to Item 103
of Regulation S-K, we have elected to apply a threshold of $1.0 million for purposes of determining whether disclosure of any such
proceedings is required. Applying this threshold, we are not aware of any such proceedings.
Item 4. Mine Safety Disclosures
Not applicable.
36
Form 10-K | Diversified Energy Company |
PART II
Item 5. Market for Registrant’s Common Equity, Related Stockholder Matters and Issuer
Purchases of Equity Securities
Market and Stockholders
Our common stock is traded on the New York Stock Exchange under the symbol DEC. In the United Kingdom, our common stock is
traded on the London Stock Exchange. As of February 25, 2026, there were 160 holders of record of our common stock.
Equity Compensation Plan Information
The information required by this item is incorporated herein by reference to our definitive proxy statement which will be filed with the
SEC within 120 days after December 31, 2025.
Repurchases of Common Stock
Following are our monthly share repurchases of common stock for the quarter ended December 31, 2025:
Period | Total Number of Shares Purchased(a) | Average Price Paid Per Share(a) | Total Number of Shares Purchased as Part of Publicly Announced Plans or Programs | Maximum Number of Shares That May Yet Be Purchased Under the Plans or Programs |
October | 358,236 | $13.86 | 358,236 | 4,312,612 |
November | 747,720 | $14.16 | 126,791 | 4,185,821 |
December | 1,482,842 | $14.23 | 1,415,549 | 2,770,272 |
Total | 2,588,798 | $14.08 | 1,900,576 |
(a)Inclusive of shares repurchased by the Employee Benefit Trust (“EBT”). Refer to Note 11 in the Notes to the Consolidated
Financial Statements for additional information.
All repurchases of common stock were made using cash on hand and liquidity at the time of purchase. Our repurchases of common
stock may occur through open market purchases, private transactions, or pursuant to a Rule 10b5-1 trading plan.
At the 2025 Annual General Meeting on April 9, 2025, our stockholders approved a stock repurchase program authorizing the
Company to repurchase up to a maximum of 8,099,015 shares. This stock repurchase program (the “2025 Repurchase Program”)
commenced upon approval and authorized the repurchase of common stock until the conclusion of the 2026 Annual General Meeting
of the Company or June 30, 2026, whichever is earlier.
On February 25, 2026, the Board approved a stock repurchase program (the “2026 Repurchase Program”) authorizing the Company to
repurchase up to 7,800,000 shares, representing approximately 10% of the Company’s issued shares (including those held by the EBT)
as of February 25, 2026. The 2026 Repurchase Program replaces the 2025 Repurchase Program and authorizes the repurchase of
common stock through March 1, 2027. Repurchases of common stock under the program may be made, from time to time, in privately
negotiated transactions, in open market transactions, or by other means, including through trading plans intended to qualify under Rule
10b-18 and/or Rule 10b5-1 of the U.S. Securities Exchange Act of 1934, as amended. The amount and timing of any repurchases
made under the program will be in the Company’s sole discretion and will depend on a variety of factors, including legal
requirements, market conditions, other investment opportunities, available liquidity, and the prevailing market price of the common
stock. The program does not obligate the Company to repurchase any dollar amount or number of shares of common stock, and the
program may be suspended or discontinued at any time at the Company’s discretion.
Dividends
The declaration and payment of dividends are determined by our Board of Directors, subject to applicable laws and contractual
restrictions. While we have a recent history of paying regular quarterly dividends of $0.29 per share, future dividends are not
guaranteed and may vary in amount or be discontinued at any time.
Dividends are waived on shares held in the EBT. Refer to Note 11 in the Notes to the Consolidated Financial Statements for additional
information.
Our ability to pay dividends is subject to certain restrictions under our Credit Facility and other debt agreements. Refer to Note 15 in
the Notes to the Consolidated Financial Statements for additional information.
The payment of future dividends will depend on a number of factors, including our financial condition, results of operations, cash
requirements, and other considerations deemed relevant by the Board of Directors.
37
Form 10-K | Diversified Energy Company |
Recent Sales of Unregistered Securities
On March 14, 2025, the Company issued 21,194,213 shares of common stock in connection with its acquisition of Maverick Natural
Resources.
On November 24, 2025, the Company issued 3,718,209 shares of common stock in connection with its acquisition of Canvas Energy
Inc.
The issuance of these shares were made in reliance on the exemption from the registration requirements of the Securities Act of 1933,
as amended, provided by Section 4(a)(2) thereof as a transaction by an issuer not involving a public offering.
Stock Performance Graph
The following graph compares the cumulative Total Shareholder Return (“TSR”) on our common stock with the cumulative total
return of the Russell 3000 Index and the 2025 Self-Constructed Peer Group for the five-year period ended December 31, 2025. The
graph assumes $100 invested on December 31, 2020, in each of our common stock, the Russell 3000 Index, and the 2025 Self-
Constructed Peer Group, and that all dividends were reinvested.
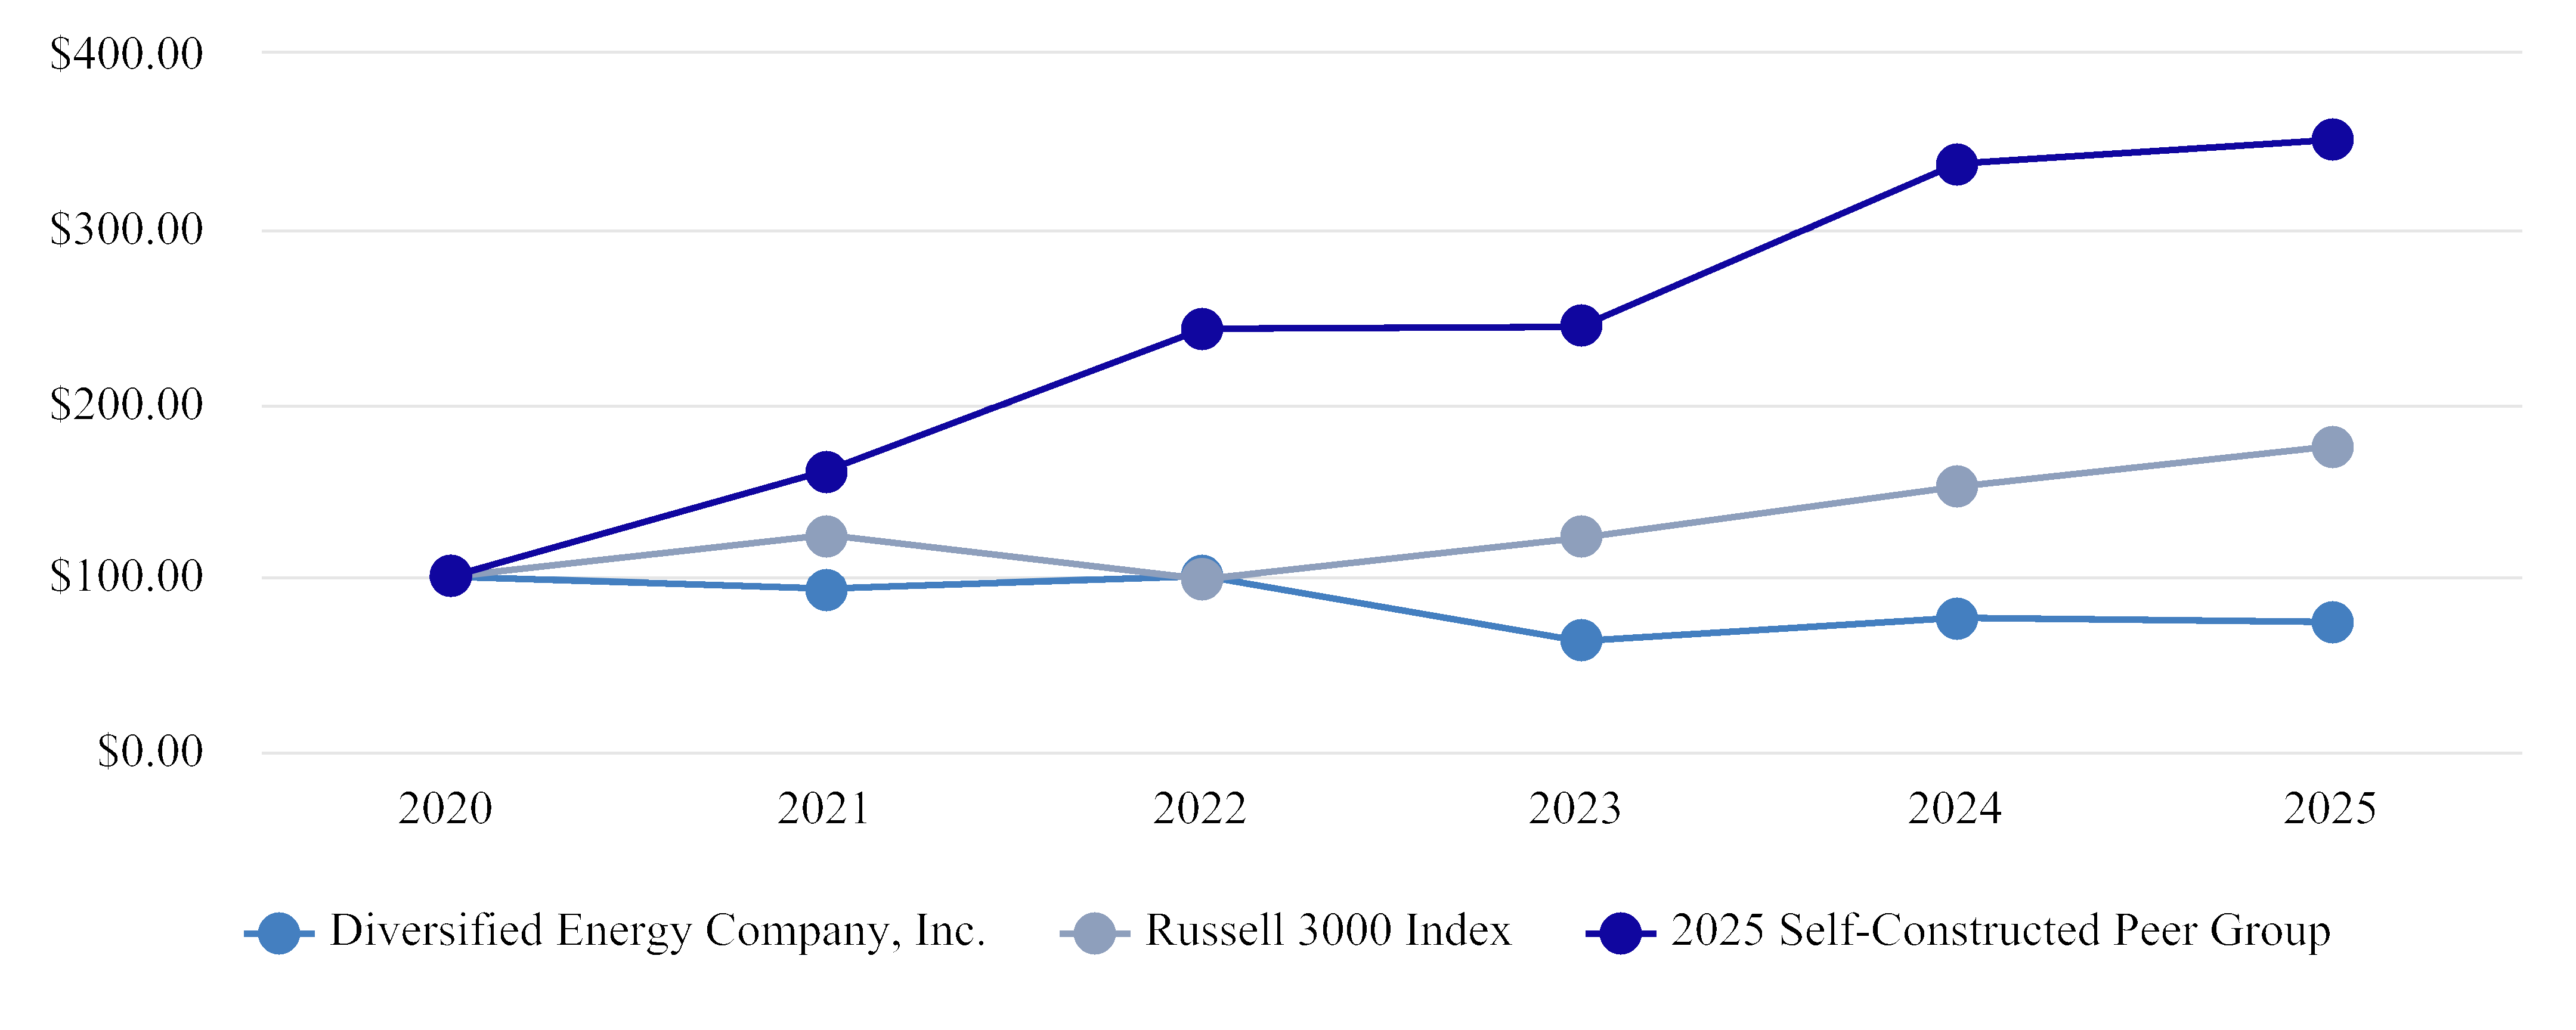
TSR is based on a $100 investment on December 31, 2020 and assumes that dividends were reinvested on the day of issuance.
2020 | 2021 | 2022 | 2023 | 2024 | 2025 | ||
Diversified Energy Company, Inc. | $100.00 | $93.07 | $100.47 | $63.18 | $76.28 | $73.98 | |
Russell 3000 Index | $100.00 | $124.00 | $98.61 | $122.23 | $151.47 | $174.97 | |
2025 Self-Constructed Peer Group | (a) | $100.00 | $160.70 | $242.30 | $243.23 | $336.91 | $350.63 |
(a)The 2025 Self-Constructed Peer Group includes the following companies: BKV Corporation, CNX Resources Corporation,
Gulfport Energy Corporation, Infinity Natural Resources, Inc., Mach Natural Resources LP, Northern Oil and Gas, Inc., Range
Resources Corporation, EQT Corporation, Expand Energy Corporation, Antero Resources Corporation, and Comstock
Resources, Inc.
Item 6. [Reserved]
Item 7. Management’s Discussion and Analysis of Financial Condition and Results of
Operations
The following discussion and analysis of financial condition and results of operations should be read in conjunction with the
Consolidated Financial Statements and the notes thereto included in this report. Unless the context otherwise indicates, references to
“Diversified,” the “Company,” “our,” “we” and “us” (i) for periods until the completion of the U.S. Domestication, refer to
Diversified Energy Company PLC and its consolidated subsidiaries, collectively, and (ii) for periods at or after the completion of the
U.S. Domestication, refer to Diversified Energy Company and its consolidated subsidiaries, collectively. For certain industry specific
In this discussion and analysis of financial condition and results of operations, we address topics such as acquisitions, tax matters,
derivatives, stockholders’ equity, asset retirement obligations, and debt. For more detailed information on these areas, refer to Notes
38
Form 10-K | Diversified Energy Company |
3, 4, 8, 11, 13, and 15 within the Notes to the Consolidated Financial Statements. These notes provide comprehensive disclosures and
explanations that support the analysis presented in this section.
Market Conditions
Our business was influenced by a range of external factors in 2025, including commodity price volatility, geopolitical developments,
regulatory changes, and evolving supply and demand dynamics. As a U.S. domestic energy producer focused primarily on natural gas,
we benefited from strong LNG export demand and colder-than-average weather, which supported an average Henry Hub price of
approximately $3.43 per MMBtu for the year. Prices fluctuated from an average high of $4.42 per MMBtu in December to an average
low of $2.84 per MMBtu in October. Year-end inventories were above the five-year average, contributing to price stability despite
ongoing global tensions.
Geopolitical conflicts, such as the Russia-Ukraine war and instability in the Middle East and Venezuela, continued to disrupt global
energy flows and underscored the strategic importance of U.S. energy production and exports. Domestically, policy shifts created a
more favorable operating environment, although new tariffs on imported energy equipment and materials introduced some uncertainty
for the industry. Our vertically integrated model helped insulate us from direct impacts, and our hedging program played a key role in
mitigating commodity price risk and supporting cash flow stability.
We also monitored inflationary pressures and supply chain challenges, which affected operating costs across the industry. Despite
ongoing market volatility and policy uncertainty, we remain focused on optimizing our asset base, managing costs, and enhancing
operational efficiency. Our integrated model and strategic positioning continue to enable us to navigate market fluctuations and
capitalize on long-term opportunities in the natural gas and oil sector.
Results of Operations for the Year Ended December 31, 2025 Compared to the Year Ended December 31,
2024
Production Volumes
For the Year Ended December 31, | ||||
2025 | 2024 | Change | % Change | |
Net production | ||||
Natural gas (MMcf) | 295,723 | 244,298 | 51,425 | 21% |
NGLs (MBbls) | 8,821 | 5,980 | 2,841 | 48% |
Oil (MBbls) | 7,935 | 1,568 | 6,367 | 406% |
Total production (MMcfe) | 396,259 | 289,586 | 106,673 | 37% |
Average daily production (MMcfepd) | 1,086 | 791 | 295 | 37% |
% Natural gas (Mcfe basis) | 75% | 84% | ||
The increase in production volumes for the year ended December 31, 2025 compared to the year ended December 31, 2024 was
primarily related to the Maverick and Canvas acquisitions in 2025, as well as full year production for Oaktree, Crescent Pass, and East
Texas II acquisitions completed in 2024, partially offset by normal production declines.
Commodity Pricing
Commodity prices fluctuate due to a variety of factors we can neither control nor predict, including increased production in excess of
demand of natural gas, NGLs or oil, weather conditions, political and economic events, and competition from other energy sources.
These factors impact supply and demand, which in turn determine the sales prices for our production. In addition to these factors, the
prices we realize for our production are affected by our derivative activities and commodity trades by non-physical trading entities, as
well as locational differences in market prices, including basis differentials. We will continue to evaluate the commodity price
environment and adjust the pace of our activity in order to maintain appropriate liquidity and financial flexibility.
The following table summarizes our average realized sales prices and benchmark prices for the periods presented:
For the Year Ended December 31, | ||||
2025 | 2024 | Change | % Change | |
Average realized sales prices (before derivative settlements) | ||||
Natural gas (Mcf) | $2.81 | $1.90 | $0.91 | 48% |
NGLs (Bbls) | 23.57 | 25.17 | (1.60) | (6%) |
Oil (Bbls) | 63.10 | 74.71 | (11.61) | (16%) |
Total (Mcfe) | $3.88 | $2.53 | $1.35 | 53% |
39
Form 10-K | Diversified Energy Company |
For the Year Ended December 31, | ||||
2025 | 2024 | Change | % Change | |
Average realized sales prices (after derivative settlements) | ||||
Natural gas (Mcf) | $2.80 | $2.57 | $0.23 | 9% |
NGLs (Bbls) | 23.34 | 24.32 | (0.98) | (4%) |
Oil (Bbls) | 66.80 | 69.54 | (2.74) | (4%) |
Total (Mcfe) | $3.94 | $3.05 | $0.89 | 29% |
Average benchmark prices | ||||
Henry Hub (Mcf) | $3.43 | $2.27 | $1.16 | 51% |
Mont Belvieu (Bbls) | 35.03 | 38.16 | (3.13) | (8%) |
WTI (Bbls) | 64.81 | 75.72 | (10.91) | (14%) |
Commodity Revenue
The following table reconciles the change in commodity revenue (excluding the impact of hedges settled in cash) by reflecting the
effect of changes in volume and in the underlying prices:
(In thousands) | Natural Gas | NGLs | Oil | Total |
Commodity revenue for the year ended December 31, 2024 | $464,600 | $150,513 | $117,146 | $732,259 |
Volume increase (decrease) | 97,708 | 71,508 | 475,679 | 644,895 |
Price increase (decrease) | 267,939 | (14,153) | (92,119) | 161,667 |
Net increase (decrease) | 365,647 | 57,355 | 383,560 | 806,562 |
Commodity revenue for the year ended December 31, 2025 | $830,247 | $207,868 | $500,706 | $1,538,821 |
Commodity revenue of $1,539 million for the year ended December 31, 2025 increased $807 million, or 110%, compared to $732
million for the year ended December 31, 2024. The increase in commodity revenue was primarily related to the 53% increase in
average realized sales prices, excluding the impact of derivatives settled in cash, and the 37% increase in sold volumes primarily due
to acquisitions as discussed above.
Commodity Derivatives
To manage our cash flows in a volatile commodity price environment, we utilize derivative hedging contracts that allow us to fix the
per unit sales prices for our production. As of December 31, 2025, approximately 80% of our production was fixed through derivative
hedging contracts over the next twelve months. The tables below set forth the commodity hedge impact on commodity revenue,
excluding and including cash received for commodity hedge settlements:
(In thousands, except per unit data) | For the Year Ended December 31, 2025 | |||||||
Natural Gas | NGLs | Oil | Total Commodity | |||||
Revenue | Realized $ | Revenue | Realized $ | Revenue | Realized $ | Revenue | Realized $ | |
per Mcf | per Bbl | per Bbl | per Mcfe | |||||
Excluding hedge impact | $830,247 | $2.81 | $207,868 | $23.57 | $500,706 | $63.10 | $1,538,821 | $3.88 |
Commodity hedge impact | (3,683) | (0.01) | (1,998) | (0.23) | 29,390 | 3.70 | 23,709 | 0.06 |
Including hedge impact | $826,564 | $2.80 | $205,870 | $23.34 | $530,096 | $66.80 | $1,562,530 | $3.94 |
(In thousands, except per unit data) | For the Year Ended December 31, 2024 | |||||||
Natural Gas | NGLs | Oil | Total Commodity | |||||
Revenue | Realized $ | Revenue | Realized $ | Revenue | Realized $ | Revenue | Realized $ | |
per Mcf | per Bbl | per Bbl | per Mcfe | |||||
Excluding hedge impact | $464,600 | $1.90 | $150,513 | $25.17 | $117,146 | $74.71 | $732,259 | $2.53 |
Commodity hedge impact | 164,452 | 0.67 | (5,055) | (0.85) | (8,108) | (5.17) | 151,289 | 0.52 |
Including hedge impact | $629,052 | $2.57 | $145,458 | $24.32 | $109,038 | $69.54 | $883,548 | $3.05 |
40
Form 10-K | Diversified Energy Company |
Gain (Loss) on Derivatives
The table below sets forth the impact of settlements and fair value adjustments on derivatives for the periods presented:
For the Year Ended December 31, | ||||
(In thousands) | 2025 | 2024 | $ Change | % Change |
Net gain (loss) on commodity derivatives settlements | $23,709 | $151,289 | $(127,580) | (84%) |
Net gain (loss) on interest rate swaps | 135 | 190 | (55) | (29%) |
Total gain (loss) on settled derivatives(a) | $23,844 | $151,479 | $(127,635) | (84%) |
Gain (loss) on fair value adjustments of unsettled derivatives(b) | 193,843 | (189,030) | 382,873 | (203%) |
Total gain (loss) on derivatives | $217,687 | $(37,551) | $255,238 | (680%) |
(a)Represents the cash settlement of derivatives that settled during the period.
(b)Represents the change in fair value of derivatives net of removing the carrying value of derivatives that settled during the period.
The change in this metric was primarily related to an increase in the value of unsettled derivatives, which had a gain of $194 million in
2025 compared to a loss of $189 million in 2024, a change of $383 million, as a result of decreases along the forward commodity
curve. This change was partially offset by a $128 million decrease in gains on settled derivatives as a result of increased commodity
pricing.
Operating Expenses
For the Year Ended December 31, | ||||||||
(In thousands, except per unit data) | 2025 | Per Mcfe | 2024 | Per Mcfe | Total Change | Per Mcfe Change | ||
Lease operating expenses | $457,593 | $1.15 | $231,651 | $0.80 | $225,942 | 98% | $0.35 | 44% |
Production taxes | 86,709 | 0.22 | 36,043 | 0.12 | 50,666 | 141% | 0.10 | 83% |
Midstream operating expenses | 79,185 | 0.20 | 72,098 | 0.25 | 7,087 | 10% | (0.05) | (20%) |
Transportation expenses | 115,267 | 0.29 | 90,461 | 0.31 | 24,806 | 27% | (0.02) | (6%) |
Accretion of asset retirement obligation | 48,607 | 0.12 | 28,464 | 0.10 | 20,143 | 71% | 0.02 | 20% |
General and administrative expense | 167,626 | 0.42 | 129,745 | 0.45 | 37,881 | 29% | (0.03) | (7%) |
Depreciation, depletion and amortization | 412,506 | 1.04 | 291,995 | 1.01 | 120,511 | 41% | 0.03 | 3% |
(Gain) loss on oil and gas property and equipment | (73,368) | (0.19) | (26,069) | (0.09) | (47,299) | 181% | (0.10) | 111% |
Total operating expenses | 1,294,125 | 3.25 | 854,388 | 2.95 | 439,737 | 51% | 0.30 | 10% |
Lease Operating Expense (“LOE”): LOE includes costs incurred to maintain producing properties. Such costs include direct and
contract labor, repairs and maintenance, water hauling, compression, automobile, insurance, and materials and supplies expenses.
The increase in LOE was driven by the acquisitions of Maverick and Canvas. Specifically, the increase in LOE per Mcfe was
primarily related to a greater exposure to liquids production. Areas with higher liquids output tend to incur elevated operating costs,
although they also benefit from higher realized prices. In 2025, the Company’s liquids production grew by 122% compared to 2024,
primarily driven by the acquisitions of Maverick and Canvas.
Production Taxes: Production taxes include severance and property taxes. Severance taxes are generally paid on produced natural
gas, NGLs and oil production at fixed rates established by federal, state, or local taxing authorities. Property taxes are generally
based on the taxing jurisdictions’ valuation of our natural gas and oil properties and midstream assets.
The increase in production taxes and production taxes per Mcfe was primarily related to an increase in severance and property taxes as
a result of an increase in revenue due to higher commodity prices and the additional value of added oil revenue, as well as additional
property taxes on assets acquired during the year.
Midstream Operating Expense: Midstream operating expenses are costs incurred to operate our owned midstream assets inclusive of
employee and benefit expenses.
The decrease in midstream operating expense per Mcfe was primarily related to maintaining a consistent level of midstream assets
while increasing overall production in 2025, following the acquisitions of Summit, Maverick, and Canvas. By keeping midstream
operations relatively unchanged and expanding production volumes, the per unit cost of midstream operations declined.
41
Form 10-K | Diversified Energy Company |
Transportation Expense: Transportation expenses are costs incurred from third-party systems to gather, process and transport our
natural gas, NGLs and oil.
The increase in transportation expense was driven by the acquisitions of Maverick and Canvas. The decrease in transportation expense
per Mcfe was primarily related to additional liquids production. Transportation costs are primarily associated with the movement of
natural gas volumes. Following the acquisitions of Maverick and Canvas, the proportion of liquids in the Company’s overall
production mix has risen significantly. Specifically, the liquids share increased to 25% in 2025 from 16% in 2024.
Accretion of Asset Retirement Obligation (“Accretion”): Accretion represents the change in the carrying amount of the asset
retirement obligation (“ARO”) over time. This expense reflects the gradual recognition of the future costs associated with retiring
natural gas and oil wells.
The increase in accretion was primarily related to the expanded obligation as a result of the Summit, Maverick, and Canvas
acquisitions during 2025, as well as normal revisions.
General & Administrative Expense (“G&A”): G&A includes overhead, including payroll and benefits for our corporate staff, costs of
maintaining our headquarters, costs of managing our operations, franchise taxes, audit and other professional fees, legal compliance,
equity compensation, and non-recurring costs primarily related to acquisitions.
The increase in G&A was the result of the increase in scale, including increased headcount, due to the Summit, Maverick, and Canvas
acquisitions. The decrease in G&A per Mcfe was primarily related to recognizing administrative synergies and leveraging our existing
infrastructure, which offset the acquisition-related increases.
Depreciation, Depletion & Amortization Expense (“DD&A”): DD&A expenses are non-cash charges that allocate the cost of assets
and natural resources over their useful lives, reflecting their wear and tear, usage, or consumption.
The increase in DD&A was primarily related to an increase in our DD&A rate, as well as a 37% increase in production over the
period. The increase in production and the DD&A rate was due to the Summit, Maverick, and Canvas acquisitions, as these led to an
increase in our depreciable base.
Gain (Loss) on Natural Gas and Oil Properties and Equipment: Gains and (losses) on natural gas and oil properties and equipment
represent the difference between cash proceeds and recorded basis of sales of natural gas and oil properties and equipment.
The increase in this metric was primarily related to increased acreage sales, as we strategically pursue the divestiture of select non-
core, undeveloped acreage within our operating portfolio. In 2025, we recognized a gain of $95 million from acreage sales compared
to $27 million in 2024. Additionally, the disposal of various property, plant and equipment in the normal course of business resulted in
a loss on natural gas and oil properties and equipment of $22 million in 2025, compared to $0.9 million in 2024.
Other Income (Expense)
For the Year Ended December 31, | ||||
(In thousands) | 2025 | 2024 | $ Change | % Change |
Interest expense | $(209,967) | $(136,801) | $(73,166) | 53% |
Loss on debt extinguishment | (26,971) | (16,377) | (10,594) | 65% |
Other income (expense) | 3,270 | 2,338 | 932 | 40% |
Total other income (expense) | $(233,668) | $(150,840) | $(82,828) | 55% |
Interest Expense
For the Year Ended December 31, | ||||
(In thousands) | 2025 | 2024 | $ Change | % Change |
Interest incurred | ||||
Borrowings | $216,132 | $138,829 | $77,303 | 56% |
Other | 1,432 | 554 | 878 | 158% |
Total interest incurred | 217,564 | 139,383 | 78,181 | 56% |
LESS: Capitalized interest | 7,597 | 2,582 | 5,015 | 194% |
Interest expense | $209,967 | $136,801 | $73,166 | 53% |
The increase in interest expense was primarily related to the issuance of the ABS X Notes, the assumption of the Maverick ABS Notes
as a result of the Maverick acquisition, the issuance of the Nordic Bonds, and the issuance of the ABS XI Notes in connection with the
Canvas acquisition. The increase was partially offset by lower outstanding balances on our existing ABS structures.
42
Form 10-K | Diversified Energy Company |
As of December 31, 2025 and 2024, total borrowings were $3.0 billion and $1.7 billion, respectively. For the year ended
December 31, 2025, the weighted average interest rate on borrowings was 7.61% compared to 7.37% for the year ended December 31,
2024. As of December 31, 2025, 73% of our borrowings resided in non-recourse, fixed-rate, hedge-protected, amortizing structures
compared to 83% as of December 31, 2024.
Loss on Debt Extinguishment
In February 2025, the proceeds from the ABS X Notes were used to repay the outstanding principal of the ABS I & II Notes and Term
Loan I, retiring these from our outstanding debt and resulting in a loss on debt extinguishment of $27 million. In 2024, the loss on debt
extinguishment was primarily driven by the use of proceeds from the ABS VIII Notes to repay the outstanding principal of the ABS
III & V Notes, retiring these from our outstanding debt and resulting in a loss on debt extinguishment of $11 million.
Income Tax Benefit (Expense)
The differences between the statutory U.S. federal income tax rate and the effective tax rates are summarized as follows:
For the Year Ended December 31, | ||||
(in thousands) | 2025 | 2024 | ||
U.S. federal statutory tax rates | $(63,283) | 21.0% | $52,067 | 21.0% |
State and local income tax, net of federal (national) income tax effect | (12,558) | 4.2% | 9,201 | 3.7% |
Foreign tax effects | ||||
Statutory tax rate difference between United Kingdom and United States | (3,586) | 1.2% | (3,109) | (1.3)% |
Equity in earnings of foreign subsidiary | (18,825) | 6.2% | (16,324) | (6.6)% |
Nontaxable dividend income | 25,777 | (8.6)% | 21,681 | 8.7% |
Other foreign tax effects | (2,408) | 0.8% | (2,432) | (1.0)% |
Tax credits | ||||
Marginal well credits | 106,319 | (35.3)% | 91,831 | 37.0% |
Nontaxable or nondeductible items | ||||
Other nondeductible items | (244) | 0.1% | (906) | (0.3)% |
Other adjustments | ||||
Other adjustments to deferred taxes | 9,358 | (3.1)% | (7,164) | (2.8)% |
Income tax benefit (expense) / Effective tax rate(a) | $40,550 | (13.5)% | $144,845 | 58.4% |
(a)The impact and the presentation of the federal tax credits on our effective tax rate can be positive or negative based on the
Company’s annual pre-tax income or loss.
The effective tax rates for the years ended December 31, 2025 and 2024 were (13.5%) and 58.4%, respectively. The effective tax rates
can be materially impacted by the recognition of the marginal well tax credit available to qualified producers as reflected in our 2025
effective tax rate. The federal government provides these credits to incentivize companies to continue operating lower-output wells
during periods of low prices. This support helps sustain production, preserve the jobs associated with these operations, and ensures
that communities continue to receive state and local tax income. Such revenue is vital for funding schools, law enforcement, social
initiatives, and other essential public services.
State and local income taxes are more than 50% comprised of Oklahoma and West Virginia.
The provision for income taxes in the Consolidated Statement of Operations is summarized below:
For the Year Ended December 31, | ||||
(In thousands) | 2025 | 2024 | $ Change | % Change |
Income (loss) before taxation | $301,349 | $(247,938) | $549,287 | (222%) |
Effective tax rate | (13.5%) | 58.4% | ||
Income tax benefit (expense) | $40,550 | $144,845 | $(104,295) | (72%) |
Tax benefit of $41 million for the year ended December 31, 2025 decreased $104 million, or 72%, compared to a benefit of $145
million for the year ended December 31, 2024. The change in this metric was primarily related to the change in the income or loss
before taxation and a change in the effective tax rate.
43
Form 10-K | Diversified Energy Company |
Results of Operations for the Year Ended December 31, 2024 Compared to the Year Ended December 31,
2023
Production Volumes
For the Year Ended December 31, | ||||
2024 | 2023 | Change | % Change | |
Net production | ||||
Natural gas (MMcf) | 244,298 | 256,378 | (12,080) | (5%) |
NGLs (MBbls) | 5,980 | 5,832 | 148 | 3% |
Oil (MBbls) | 1,568 | 1,377 | 191 | 14% |
Total production (MMcfe) | 289,586 | 299,632 | (10,046) | (3%) |
Average daily production (MMcfepd) | 791 | 821 | (30) | (4%) |
% Natural gas (Mcfe basis) | 84% | 86% | ||
The decrease in production volumes for the year ended December 31, 2024 compared to the year ended December 31, 2023 was
primarily related to the sale of our equity interest in DP Lion Equity Holdco in December 2023 along with normal declines partially
offset by increased production as a result of the Oaktree, Crescent Pass, and East Texas II acquisitions in 2024.
Commodity Pricing
The following table summarizes our average realized sales prices and benchmark prices for the periods presented:
For the Year Ended December 31, | ||||
2024 | 2023 | $ Change | % Change | |
Average realized sales prices (before derivative settlements) | ||||
Natural gas (Mcf) | $1.90 | $2.17 | $(0.27) | (12%) |
NGLs (Bbls) | 25.17 | 24.23 | 0.94 | 4% |
Oil (Bbls) | 74.71 | 75.46 | (0.75) | (1%) |
Total (Mcfe) | $2.53 | $2.68 | $(0.15) | (6%) |
Average realized sales prices (after derivative settlements) | ||||
Natural gas (Mcf) | $2.57 | $2.86 | $(0.29) | (10%) |
NGLs (Bbls) | 24.32 | 26.05 | (1.73) | (7%) |
Oil (Bbls) | 69.54 | 68.44 | 1.10 | 2% |
Total (Mcfe) | $3.05 | $3.27 | $(0.22) | (7%) |
Average benchmark prices | ||||
Henry Hub (Mcf) | $2.27 | $2.74 | $(0.47) | (17%) |
Mont Belvieu (Bbls) | 38.16 | 34.11 | 4.05 | 12% |
WTI (Bbls) | 75.72 | 77.62 | (1.90) | (2%) |
44
Form 10-K | Diversified Energy Company |
Commodity Revenue
The following table reconciles the change in commodity revenue (excluding the impact of derivatives settled in cash) by reflecting the
effect of changes in volume and in the underlying prices:
(In thousands) | Natural Gas | NGLs | Oil | Total |
Commodity revenue for the year ended December 31, 2023 | $557,167 | $141,321 | $103,911 | $802,399 |
Volume increase (decrease) | (26,214) | 3,586 | 14,413 | (8,215) |
Price increase (decrease) | (66,353) | 5,606 | (1,178) | (61,925) |
Net increase (decrease) | (92,567) | 9,192 | 13,235 | (70,140) |
Commodity revenue for the year ended December 31, 2024 | $464,600 | $150,513 | $117,146 | $732,259 |
Commodity revenue of $732 million for the year ended December 31, 2024 decreased $70 million, or 9%, compared to $802 million
for the year ended December 31, 2023. The decrease in commodity revenue was primarily related to the 6% decrease in average
realized sales prices, excluding the impact of derivatives settled in cash, and the 3% decrease in sold volumes.
Commodity Derivatives
As of December 31, 2024, approximately 86% of our production was fixed through derivative hedging contracts over the next twelve
months. The tables below set forth the commodity derivative impact on commodity revenue, excluding and including cash received for
commodity derivative settlements:
For the Year Ended December 31, 2024 | ||||||||
Natural Gas | NGLs | Oil | Total Commodity | |||||
(In thousands, except per unit data) | Revenue | Realized $ | Revenue | Realized $ | Revenue | Realized $ | Revenue | Realized $ |
per Mcf | per Bbl | per Bbl | per Mcfe | |||||
Excluding hedge impact | $464,600 | $1.90 | $150,513 | $25.17 | $117,146 | $74.71 | $732,259 | $2.53 |
Commodity hedge impact | 164,452 | 0.67 | (5,055) | (0.85) | (8,108) | (5.17) | 151,289 | 0.52 |
Including hedge impact | $629,052 | $2.57 | $145,458 | $24.32 | $109,038 | $69.54 | $883,548 | $3.05 |
For the Year Ended December 31, 2023 | ||||||||
Natural Gas | NGLs | Oil | Total Commodity | |||||
(In thousands, except per unit data) | Revenue | Realized $ | Revenue | Realized $ | Revenue | Realized $ | Revenue | Realized $ |
per Mcf | per Bbl | per Bbl | per Mcfe | |||||
Excluding hedge impact | $557,167 | $2.17 | $141,321 | $24.23 | $103,911 | $75.46 | $802,399 | $2.68 |
Commodity hedge impact | 177,139 | 0.69 | 10,594 | 1.82 | (9,669) | (7.02) | 178,064 | 0.59 |
Including hedge impact | $734,306 | $2.86 | $151,915 | $26.05 | $94,242 | $68.44 | $980,463 | $3.27 |
Gain (Loss) on Derivatives
The table below sets for the impact of settlements and fair value adjustments on derivatives for the periods presented:
For the Year Ended December 31, | ||||
(In thousands) | 2024 | 2023 | $ Change | % Change |
Net gain (loss) on commodity derivatives settlements | $151,289 | $178,064 | $(26,775) | (15%) |
Net gain (loss) on interest rate swaps | 190 | (2,722) | 2,912 | (107%) |
Gain (loss) on foreign currency hedges | — | (521) | 521 | (100%) |
Total gain (loss) on settled derivatives(a) | $151,479 | $174,821 | $(23,342) | (13%) |
Gain (loss) on fair value adjustments of unsettled derivatives(b) | (189,030) | 905,695 | (1,094,725) | (121%) |
Total gain (loss) on derivatives | $(37,551) | $1,080,516 | $(1,118,067) | (103%) |
(a)Represents the cash settlement of derivatives that settled during the period.
(b)Represents the change in fair value of derivatives net of removing the carrying value of derivatives that settled during the period.
The change in this metric was primarily related to losses of $189 million stemming from fair value adjustments on unsettled
derivatives, which were influenced by an increase along the forward commodity curve. The losses were offset by $151 million in gains
45
Form 10-K | Diversified Energy Company |
incurred from settled derivative contracts, as commodity market prices dropped below the predetermined thresholds set in our
derivative arrangements.
Operating Expenses
For the Year Ended December 31, | ||||||||
(In thousands, except per unit data) | 2024 | Per Mcfe | 2023 | Per Mcfe | Total Change | Per Mcfe Change | ||
Lease operating expenses | $231,651 | $0.80 | $213,078 | $0.71 | $18,573 | 9% | $0.09 | 13% |
Production taxes | 36,043 | 0.12 | 61,474 | 0.21 | (25,431) | (41%) | (0.09) | (43%) |
Midstream operating expenses | 72,098 | 0.25 | 71,307 | 0.24 | 791 | 1% | 0.01 | 4% |
Transportation expenses | 90,461 | 0.31 | 96,218 | 0.32 | (5,757) | (6%) | (0.01) | (3%) |
Accretion of asset retirement obligation | 28,464 | 0.10 | 23,903 | 0.08 | 4,561 | 19% | 0.02 | 25% |
General and administrative expense | 129,745 | 0.45 | 128,626 | 0.43 | 1,119 | 1% | 0.02 | 5% |
Depreciation, depletion and amortization | 291,995 | 1.01 | 273,316 | 0.91 | 18,679 | 7% | 0.10 | 11% |
(Gain) loss on oil and gas property and equipment | (26,069) | (0.09) | (28,124) | (0.09) | 2,055 | (7%) | — | —% |
Total operating expenses | $854,388 | $2.95 | $839,798 | $2.81 | $14,590 | 2% | $0.14 | 5% |
Lease Operating Expense (“LOE”): LOE includes costs incurred to maintain producing properties. Such costs include direct and
contract labor, repairs and maintenance, water hauling, compression, automobile, insurance, and materials and supplies expenses.
The increase in LOE per Mcfe was primarily related to the Oaktree, Crescent Pass, and East Texas II acquisitions in 2024.
Specifically, these acquisitions resulted in a greater exposure to liquids production, which tend to incur elevated operating costs.
Production Taxes: Production taxes include severance and property taxes. Severance taxes are generally paid on produced natural
gas, NGLs and oil production at fixed rates established by federal, state, or local taxing authorities. Property taxes are generally
based on the taxing jurisdictions’ valuation of our natural gas and oil properties and midstream assets.
The decrease in production taxes per Mcfe was primarily related to a decrease in severance and property taxes as a result of a decrease
in revenue due to lower production and commodity prices, as well as lower valuations for property taxes experienced during the year.
Midstream Operating Expense: Midstream operating expenses are costs incurred to operate our owned midstream assets inclusive of
employee and benefit expenses.
The increase in midstream operating expense per Mcfe was primarily related to growth in our midstream operations due to Central
Region expansion through the acquisitions of Oaktree, Crescent Pass, and East Texas II.
Transportation Expense: Transportation expenses are costs incurred from third-party systems to gather, process and transport our
natural gas, NGLs and oil.
The decrease in transportation expense per Mcfe was primarily related to decreases in commodity price-linked components of third-
party midstream rates and costs.
Accretion of Asset Retirement Obligation (“Accretion”): Accretion represents the change in the carrying amount of the asset
retirement obligation (“ARO”) over time. This expense reflects the gradual recognition of the future costs associated with retiring
natural gas and oil wells.
The increase in accretion was primarily related to the inclusion of assets from the Oaktree, Crescent Pass, and East Texas II
acquisitions, along with normal declines in production from mature wells.
General & Administrative Expense (“G&A”): G&A includes overhead, including payroll and benefits for our corporate staff, costs of
maintaining our headquarters, costs of managing our operations, franchise taxes, audit and other professional fees, legal compliance,
equity compensation, and non-recurring costs primarily related to acquisitions.
The increase in G&A per MCFe was primarily related to additional administrative costs and professional services to support our
ongoing growth through acquisitions. Additionally, we also experienced increased costs associated with litigation expense. These
increases were partially offset by a reduction in legal and consulting services.
46
Form 10-K | Diversified Energy Company |
Depreciation, Depletion & Amortization Expense (“DD&A”): DD&A expenses are non-cash charges that allocate the cost of assets
and natural resources over their useful lives, reflecting their wear and tear, usage, or consumption.
The increase in DD&A was primarily related to an increase in our DD&A rate, which was partially offset by a 3% decrease in
production over the period. The increase in our DD&A rate was due to the decrease in our estimated proved reserves relative to our
depreciable base, driven primarily by changes in commodity prices year-over-year as well as the sale of equity interest in DP Lion
Equity Holdco LLC in December 2023. The decrease in proved reserves was partially offset by the acquisition of the Oaktree,
Crescent Pass, and East Texas II assets in 2024.
Gain (Loss) on Natural Gas and Oil Properties and Equipment: Gains and (losses) on natural gas and oil properties and equipment
represents the difference between cash proceeds and recorded basis of sales of natural gas and oil properties and equipment.
The change in this metric was primarily related to non-core acreage and asset sales. In 2024, we recognized a gain of $27 million from
acreage sales compared to $24 million in 2023. This increase was offset by the disposal of various property, plant and equipment in
the normal course of business, which resulted in a loss on natural gas and oil properties and equipment of $0.9 million in 2024,
compared to a gain of $4.6 million in 2023.
Other Income (Expense)
For the Year Ended December 31, | ||||
(In thousands) | 2024 | 2023 | $ Change | % Change |
Gain (loss) on sale of equity interest | — | 11,065 | (11,065) | (100%) |
Interest expense | (136,801) | (130,859) | (5,942) | 5% |
Loss on debt extinguishment | (16,377) | — | (16,377) | 100% |
Other income (expense) | 2,338 | 385 | 1,953 | 507% |
Total other income (expense) | $(150,840) | $(119,409) | $(31,431) | 26% |
Gain (Loss) on Sale of Equity Interest
The change in this metric is related to the divestiture of 80% of the equity ownership in DP Lion Equity Holdco LLC to outside
investors, which generated cash proceeds of $30 million. The consideration exceeded the fair value of the Company’s portion of the
assets and liabilities divested resulting in a gain on sale of the equity interest of $11 million.
Interest Expense
For the Year Ended December 31, | ||||
(In thousands) | 2024 | 2023 | $ Change | % Change |
Interest incurred | ||||
Borrowings | $138,829 | $133,142 | $5,687 | 4% |
Other | 554 | 606 | (52) | (9%) |
Total interest incurred | 139,383 | 133,748 | 5,635 | 4% |
LESS: Capitalized interest | 2,582 | 2,889 | (307) | (11%) |
Interest expense | $136,801 | $130,859 | $5,942 | 5% |
The increase in interest expense was primarily related to interest on the new ABS IX Notes, Oaktree Seller’s Note, and Term Loan II.
The increase was partially offset by lower outstanding balances on our existing ABS structures.
As of December 31, 2024 and 2023, total borrowings were $1.7 billion and $1.3 billion, respectively. For the year ended
December 31, 2024, the weighted average interest rate on borrowings was 7.37% compared to 6.03% for the year ended December 31,
2023. As of December 31, 2024, 83% of our borrowings resided in fixed-rate, hedge-protected, amortizing structures compared to
87% as of December 31, 2023.
Loss on Debt Extinguishment
The change in this metric was primarily related to losses recognized on the early retirement of debt in 2024. During the year, we
repaid the ABS III and ABS V notes using proceeds from new ABS VIII issuance, resulting in a loss of $10.6 million. We also repaid
the ABS Facility Warehouse Notes using proceeds from the ABS IX issuance, resulting in a loss of $1.6 million. Additionally, the
amendment and expansion of Term Loan II led to a further loss of $2.5 million. The amendment to the Credit Facility also resulted in
a loss of $1.6 million
47
Form 10-K | Diversified Energy Company |
Other Income (Expense)
The change in this metric was primarily related to $1.1 million in dividend distributions received from our investment in DP Lion
Equity Holdco during 2024, whereas no such distributions were received in 2023.
Income Tax Benefit (Expense)
The differences between the statutory U.S. federal income tax rate and the effective tax rates are summarized as follows:
For the Year Ended December 31, | ||||
(in thousands) | 2024 | 2023 | ||
U.S. federal statutory tax rates | $52,067 | 21.0% | $(207,810) | 21.0% |
State and local income tax, net of federal (national) income tax effect | 9,201 | 3.7% | (29,698) | 3.0% |
Foreign tax effects | ||||
Statutory tax rate difference between United Kingdom and United States | (3,109) | (1.3)% | (3,270) | 0.3% |
Equity in earnings of foreign subsidiary | (16,324) | (6.6)% | (27,241) | 2.8% |
Nontaxable dividend income | 21,681 | 8.7% | 32,357 | (3.3)% |
Tax credits | ||||
Marginal well credits | 91,831 | 37.0% | — | —% |
Changes in valuation allowances | — | —% | 1,504 | (0.2)% |
Nontaxable or nondeductible items | ||||
Other nondeductible items | (906) | (0.3)% | (2,039) | 0.3% |
Other adjustments | ||||
Other adjustments to deferred taxes | (7,164) | (2.8)% | (1,282) | 0.1% |
Income tax benefit (expense) / Effective tax rate(a) | $144,845 | 58.4% | $(239,184) | 24.2% |
(a)The impact and the presentation of the federal tax credits on our effective tax rate can be positive or negative based on the
Company’s annual pre-tax income or loss.
The effective tax rates for the years ended December 31, 2024 and 2023 were 58.4% and 24.2%, respectively. The effective tax rate
can be materially impacted by the recognition of the marginal well tax credit available to qualified producers as reflected in our 2024
effective tax rate. A marginal well tax credit was not available for the 2023 tax year. The federal government provides these credits to
incentivize companies to continue operating lower-output wells during periods of low prices. This support helps sustain production,
preserve the jobs associated with these operations, and ensures that communities continue to receive state and local tax income. Such
revenue is vital for funding schools, law enforcement, social initiatives, and other essential public services.
State and local income taxes are more than 50% comprised of Oklahoma and West Virginia.
The provision for income taxes in the Consolidated Statement of Operations is summarized below:
For the Year Ended December 31, | ||||
(In thousands) | 2024 | 2023 | $ Change | % Change |
Income (loss) before taxation | $(247,938) | $989,573 | $(1,237,511) | (125%) |
Effective tax rate | 58.4% | 24.2% | ||
Income tax benefit (expense) | $144,845 | $(239,184) | $384,029 | (161%) |
Tax benefit of $145 million for the year ended December 31, 2024 changed $384 million, or 161%, compared to an expense of $239
million for the year ended December 31, 2024. The change in this metric was primarily related to the change in the income or loss
before taxation and a change in the effective tax rate.
Liquidity and Capital Resources
Overview
Our primary sources of liquidity are cash generated from operating activities and available capacity under our Credit Facility. As of
December 31, 2025, we had approximately $335 million of liquidity, consisting of $30 million of cash on hand and $305 million of
availability under our Credit Facility. As of February 25, 2026 we had approximately $577 million of liquidity, consisting of $31
million of cash on hand and $546 million of availability under our Credit Facility.
48
Form 10-K | Diversified Energy Company |
When we acquire assets, we typically complement our Credit Facility with long-term, fixed-rate, fully-amortizing, asset-backed debt
secured by certain natural gas and oil assets. The asset-backed debt is non-recourse back to the Company. This financing strategy
aligns with the long-life nature of our assets, offering us lower borrowing rates and a clear path to reduce leverage through scheduled
principal payments. For larger acquisitions that require greater capital outlays, we have in the past and may in the future raise funds
through equity offerings to maintain an appropriate leverage profile.
We closely monitor our working capital to ensure it remains sufficient for business operations, as well as for payment of dividends to
shareholders and repurchases of common stock. Alongside managing working capital, we take a disciplined approach to controlling
operating costs and allocating capital resources. This approach ensures that capital investments generate returns that support our
strategic initiatives.
Capital expenditures were $185 million for the year ended December 31, 2025, compared to $52 million for the year ended
December 31, 2024. The increase in capital expenditures was primarily related to the development of new wells via a non-operated
development agreement that came with the undeveloped locations acquired in the Maverick acquisition. We expect to meet our capital
expenditure needs for the foreseeable future from our operating cash flows and our existing cash and cash equivalents. Our future
capital requirements will depend on several factors, including the pace of our growth, fluctuations in commodity prices, and future
acquisitions.
The majority of our capital expenditures are directed towards upstream and midstream operations, including pipelines and
compression. The remaining expenditures focus on production optimization, technology, plugging requirements, fleet, reducing
emissions, and, when prudent, development activities aimed at replacing production. Our strategy to acquire and operate mature wells
with shallow decline rates allows us to avoid the large capital expenditures associated with drilling and completion activities of
development focused companies.
Looking ahead, we aim to create stable cash flows by maintaining our hedging strategy and capitalizing on market opportunities to
enhance the hedged commodity prices of our production. We plan to preserve our strategic advantages through purposeful growth,
supported by a disciplined capital expenditure program. We believe this approach will help ensure we secure low-cost financing for
acquisitive growth while maintaining appropriate leverage and sufficient liquidity.
With respect to other known current obligations, we believe that our sources of liquidity and capital resources will be sufficient to
meet our existing business needs for at least the next 12 months. However, our ability to satisfy our working capital requirements, debt
service obligations, and planned capital expenditures will depend upon our future operating performance, which will be affected by
prevailing economic conditions in the natural gas and oil industry and other financial and business factors, some of which are beyond
our control.
Liquidity
As of December 31, | |||
(In thousands) | 2025 | 2024 | 2023 |
Cash and cash equivalents | $29,697 | $5,990 | $3,753 |
Available borrowings under the Credit Facility(a) | 304,912 | 86,690 | 134,817 |
Liquidity | $334,609 | $92,680 | $138,570 |
(a)Represents available borrowings under the Credit Facility of $340 million as of December 31, 2025 less outstanding letters of
credit of $35 million as of such date. Represents available borrowings under the Credit Facility of $101 million as of
December 31, 2024 less outstanding letters of credit of $14 million as of such date. Represents available borrowings under the
Credit Facility of $146 million as of December 31, 2023 less outstanding letters of credit of $11 million as of such date.
Debt
As of December 31, 2025, 2024, and 2023, we had $3.0 billion, $1.7 billion and $1.3 billion in total debt outstanding, respectively.
Asset Retirement Obligations
As of December 31, 2025, 2024, and 2023, we had $864 million, $619 million and $463 million in total asset retirement obligations on
a discounted basis, respectively.
49
Form 10-K | Diversified Energy Company |
Cash Flows
For the Year Ended December 31, | ||||
(In thousands) | 2025 | 2024 | $ Change | % Change |
Net cash provided by operating activities | $464,619 | $220,650 | $243,969 | 111% |
Net cash (used in) investing activities | (820,168) | (266,762) | (553,406) | 207% |
Net cash provided by financing activities | 448,400 | 58,366 | 390,034 | 668% |
Net change in cash, cash equivalents and restricted cash | $92,851 | $12,254 | $80,597 | 658% |
Net Cash Provided by Operating Activities
The change in net cash provided by operating activities was primarily related to an increase in production, as a result of current year
acquisitions, and higher prices for the natural gas, NGL, and oil volumes sold.
Net Cash (Used in) Investing Activities
The change in net cash used in investing activities was primarily related to the acquisitions of Summit, Maverick, and Canvas in the
current year, in addition to increased drilling capital spend related to participating in the development of certain non-operated wells
acquired with Maverick. These increases were partially offset by increased cash proceeds from the sale of undeveloped acreage.
Net Cash Provided by Financing Activities
The increase in net cash provided by financing activities was primarily related to an increase in ABS activity during the year,
associated with both acquisitions and refinancings, as well as proceeds from the April Nordic Bonds issuance and the February equity
issuance. These increases were partially offset by cash outflows related to hedge modifications associated with the ABS refinancings.
For the Year Ended December 31, | ||||
(In thousands) | 2024 | 2023 | $ Change | % Change |
Net cash provided by operating activities | $220,650 | $291,431 | $(70,781) | (24%) |
Net cash (used in) investing activities | (266,762) | (246,714) | (20,048) | 8% |
Net cash provided by (used in) financing activities | 58,366 | (67,440) | 125,806 | 187% |
Net change in cash, cash equivalents and restricted cash | $12,254 | $(22,723) | $34,977 | 154% |
Net Cash Provided by Operating Activities
The change in net cash provided by operating activities was primarily related to lower prices for the natural gas, NGL, and oil volumes
sold.
Net Cash (Used in) Investing Activities
The change in net cash used in investing activities was primarily related to a net increase in cash outflows for acquisitions, divestitures
and disposal activity, which was partially offset by a decrease in cash outflows for capital expenditures, due to decreased development
activity in 2024.
Net Cash Provided by (Used in) Financing Activities
The increase in net cash provided by (used in) financing activities was primarily related to an increase in ABS activity during the year,
associated with both acquisitions and refinancings, which provided net proceeds. Also contributing to the increase was a reduction in
dividends paid in 2024. Partially offsetting these increases was a decrease in equity proceeds as a result of the 2023 equity issuance.
Off-Balance Sheet Arrangements
We may enter into off-balance sheet arrangements and transactions that give rise to material off-balance sheet obligations. As of
December 31, 2025 and December 31, 2024, our material off-balance sheet arrangements and transactions include operating service
arrangements of $371 million and letters of credit outstanding against our Credit Facility of $35 million. Refer to Contractual
Obligations for additional information.
There are no other transactions, arrangements or other relationships with unconsolidated entities or other persons that are reasonably
likely to materially affect our liquidity or availability of capital resources.
50
Form 10-K | Diversified Energy Company |
Contractual Obligations
We have various contractual obligations in the normal course of our operations and financing activities. Significant contractual
obligations as of December 31, 2025 were as follows:
(In thousands) | 2026 | 2027 | 2028 | 2029 | 2030 | Thereafter | Total |
Recorded contractual obligations | |||||||
Accounts payable | $81,814 | $— | $— | $— | $— | $— | $81,814 |
Accrued liabilities | 193,742 | — | — | — | — | — | 193,742 |
Borrowings | 236,553 | 217,426 | 197,691 | 969,696 | 253,467 | 1,110,412 | 2,985,245 |
Operating leases | 2,191 | 680 | 337 | 344 | 351 | 298 | 4,201 |
Finance leases | 26,560 | 22,135 | 17,354 | 11,922 | 4,497 | 272 | 82,740 |
Asset retirement obligation(a) | 26,476 | 28,356 | 25,724 | 51,076 | 19,445 | 3,484,077 | 3,635,154 |
Other liabilities(b) | 118,477 | 26,869 | — | — | — | — | 145,346 |
Off-Balance Sheet contractual obligations | |||||||
Firm transportation(c) | 58,590 | 35,432 | 26,118 | 20,613 | 8,358 | 221,534 | 370,645 |
Total contractual obligations | $744,403 | $330,898 | $267,224 | $1,053,651 | $286,118 | $4,816,593 | $7,498,887 |
(a)Represents our asset retirement obligation on an undiscounted basis. On a discounted basis the liability is $889 million as of
December 31, 2025 as presented in the Consolidated Balance Sheets.
(b)Represents taxes payable, deferred tax liability, and other current and noncurrent liabilities.
(c)Represents reserved capacity to transport gas from production locations through pipelines to the ultimate sales meters.
For more detailed information on asset retirement obligations, leases, debt, accounts payable and accrued liabilities, and other
liabilities, refer to Notes 13, 14, 15, 16, and 17 within the Notes to the Consolidated Financial Statements.
Litigation and Regulatory Proceedings & Environmental Matters
For Information regarding legal proceedings and environmental matters refer to Note 19 to the Notes to the Consolidated Financial
Statements.
Critical Accounting Estimates & Judgments
The preparation of financial statements in conformity with GAAP requires us to make estimates and assumptions. The accounting
estimates and assumptions that involve a significant level of estimation uncertainty and have or are reasonably likely to have a
material impact on our financial condition or results of operations are discussed below.
For discussion regarding our significant accounting policies, refer to Note 2 in the Notes to the Consolidated Financial Statements for
additional information regarding our significant accounting policies, estimates, and judgments.
Natural Gas and Oil Reserves
Estimates of proved natural gas and oil reserves are used in calculating DD&A of proved natural gas and oil property costs, the present
value of estimated future net revenues, estimates of future taxable income used in assessing the realizability of deferred tax assets, and
the estimated timing of cash outflows underlying asset retirement obligations. There are numerous uncertainties inherent in the
estimation of proved natural gas and oil reserves and in the projection of future rates of production.
The process of estimating proved natural gas and oil reserves requires that our independent and internal reserve engineers exercise
judgment on the future production rates. The accuracy of any reserve estimate is a function of the quality of data available and of
engineering and geological interpretation and judgment. In addition, estimates of reserves may be revised based on actual production,
results of subsequent exploration and development activities, recent commodity prices, operating costs and other factors. These
revisions could materially affect our financial statements. The volatility of commodity prices results in increased uncertainty inherent
in these estimates and assumptions. Changes in natural gas, oil or NGL prices could result in actual results differing significantly from
our estimates. See Supplemental Natural Gas & Oil Information included in Item 8 of Part II of this report for further information.
51
Form 10-K | Diversified Energy Company |
Impairment of Proved Properties
We assess our proved natural gas and oil properties for impairment on an asset group basis whenever events and circumstances
indicate that there could be a possible decline in the recoverability of the net book value of such property. We estimate the expected
future net cash flows of our proved natural gas and oil properties and compare these undiscounted cash flows to the net book value of
the proved natural gas and oil properties to determine if the net book value is recoverable. If the net book value exceeds the estimated
undiscounted future net cash flows, we will recognize an impairment to reduce the net book value of the proved natural gas and oil
properties to fair value. The assumptions used to determine fair value include, but are not limited to, future commodity prices, future
production estimates, operating costs, and discount rates, which are based on a weighted average cost of capital. Fair value estimates
are based on projected financial information which we believe to be reasonably likely to occur, as of the date that the impairment is
measured.
Business Combinations
We account for business combinations using the acquisition method, which is the only method permitted under FASB ASC Topic 805,
Business Combinations and involves the use of significant judgment. Under the acquisition method of accounting, a business
combination is accounted for at a purchase price based on the fair value of the consideration given. The assets and liabilities acquired
are measured at their fair values, and the purchase price is allocated to the assets and liabilities based upon these fair values. The
excess, if any, of the consideration given to acquire an entity over the net amounts assigned to its assets acquired and liabilities
assumed is recognized as goodwill. The excess, if any, of the fair value of assets acquired and liabilities assumed over the cost of an
acquired entity is recognized immediately to earnings as a gain on bargain purchase.
The Company’s principal assets are its natural gas and oil properties, which are accounted for under the successful efforts accounting
method. The Company determines the fair value of acquired proved natural gas and oil properties based on the discounted future net
cash flows expected to be generated from these assets. Discounted cash flow models by operating area are prepared using the
estimated future revenues and operating costs for all proved developed properties and undeveloped properties comprising the proved
reserves. Significant inputs associated with the calculation of discounted future net cash flows include estimates of (i) future
production volumes based on estimated reserves, (ii) future operating and development costs, (iii) future commodity prices escalated
by an inflationary rate after five years, adjusted for differentials, and (iv) a market-based weighted average cost of capital by operating
area. The Company utilizes NYMEX strip pricing, adjusted for differentials, to value the reserves. The NYMEX strip pricing inputs
used are classified as Level 1 fair value assumptions and all other inputs are classified as Level 3 fair value assumptions. The discount
rates utilized are derived using a weighted average cost of capital computation, which includes an estimated cost of debt and equity for
market participants with similar geographies and asset development type by operating area. Additionally, the fair value of unproved oil
and gas properties is determined using a market approach, which considers recent comparable transactions for similar assets. More
information regarding conclusions reached with respect to this judgment is included in Note 2 to the Notes to the Consolidated
Financial Statements.
Income Taxes
The amount of income taxes recorded requires interpretations of complex rules and regulations of federal and state tax jurisdictions.
We recognize current tax expense based on estimated taxable income for the current period and the applicable statutory tax rates. We
routinely assess potential uncertain tax positions and, if required, estimate and establish accruals for such amounts. We have
recognized deferred tax assets and liabilities for temporary differences, operating losses and other tax carryforwards. In assessing the
need for a valuation allowance or adjustments to existing valuation allowances, we consider a variety of positive and negative
evidence, which may include a projection of income exclusive of existing timing differences. Our judgment regarding the realizability
of deferred tax assets is thus partially affected by estimates of future financial results.
Management monitors company-specific, natural gas and oil industry and worldwide economic factors and assesses the likelihood that
our net deferred tax assets will be utilized prior to their expiration. Refer to Note 4 in the Notes to the Consolidated Financial
Statements for additional discussion.
Asset Retirement Obligations
We accrue a liability for asset retirement obligations based on an estimate of the amount and timing of settlement. For oil and gas
wells, the fair value of our plugging and abandonment obligations is recorded at the time the obligation is incurred, which is typically
at the time the well is drilled.
Calculating our asset retirement obligations is a "critical accounting estimate" because we must assess the expected amount and timing
of asset retirement obligation settlement. In addition, we must determine the estimated present value of future liabilities. Future results
of operations for any quarterly or annual period could be materially affected by changes in our assumptions. If the expected amount
and timing of our asset retirement obligations change, we will be required to adjust the carrying value of our liabilities in future
periods. An estimate of the sensitivity to changes in our assumptions is not practicable given the numerous assumptions that can
materially affect our estimates. Refer to Note 13 in the Notes to the Consolidated Financial Statements for additional discussion.
52
Form 10-K | Diversified Energy Company |
Recently Issued Accounting Pronouncements
Refer to Note 2 in the Notes to the Consolidated Financial Statements for information regarding recent accounting pronouncements
applicable to our Consolidated Financial Statements.
Item 7A. Quantitative and Qualitative Disclosures About Market Risk
The primary objective of the following information is to provide forward-looking quantitative and qualitative information about our
potential exposure to market risk. The term “market risk” refers to the risk of loss arising from adverse changes in natural gas, NGLs
and oil prices, as well as interest rates. These disclosures are not meant to be precise indicators of expected future losses, but rather
indicators of reasonably possible losses. This forward-looking information provides indicators of how we view and manage our
ongoing market risk exposures.
Commodity Price Risk
Our revenues are primarily derived from the sale of natural gas, NGLs, and oil production, subjecting us to commodity price risk.
Commodity prices for natural gas, NGLs and oil can be volatile and may fluctuate due to relatively small changes in supply, weather
conditions, economic conditions, and government actions. For the year ended December 31, 2025, our natural gas, NGLs, and oil
revenue was $830 million, $208 million, and $501 million, respectively. Based on production, natural gas, NGLs and oil revenue for
the year ended December 31, 2025 would have increased or decreased by approximately $83 million, $21 million, and $50 million,
respectively, for each 10% increase or decrease in prices.
To mitigate the risk of fluctuations in commodity prices, we enter into derivatives. The total volumes hedged through the use of these
instruments vary from period to period. Generally our objective is to hedge approximately 60% to 80% of anticipated production
volumes for the next 12 months, at least 50% for months 13 to 24, and a minimum of 30% for months 25 to 36. For additional
information regarding derivatives, refer to Note 8 in the Notes to the Consolidated Financial Statements.
By removing price volatility from a significant portion of our expected production through 2028, we have mitigated, but not
eliminated, the potential effects of changing prices on operating cash flow for those periods. While these derivative contracts help
mitigate the negative effects of falling commodity prices, they also limit the benefits we would receive from increases in commodity
prices.
As of December 31, 2025, the fair value of our natural gas derivatives was a net liability of $494 million, NGLs derivatives were in a
net asset position of $34 million, and our oil derivatives were in a net asset position of $99 million. For the year ended December 31,
2025, a 10% fluctuation in commodity prices would have a corresponding impact of approximately $49 million, $3 million, and $10
million on natural gas, NGLs and oil derivatives, respectively.
Interest Rate Risk
We are subject to market risk exposure related to changes in interest rates. Our borrowings primarily consist of fixed-rate amortizing
notes and a variable rate Credit Facility as illustrated below.
As of December 31, 2025 | ||
(in thousands) | Borrowings | Interest Rate(a) |
ABS Notes, Nordic Bonds, & other(b) | $2,193,566 | 7.72% |
Credit Facility | $485,400 | 7.04% |
(a)The interest rate on the ABS Notes, Nordic Bonds, and other notes payable represents the weighted average fixed rate of the
notes, while the interest rate presented for the Credit Facility represents the floating rate as of December 31, 2025.
(b)Includes $23 million in notes payable issued by a third party financial institution in November 2024 collateralized by two natural
gas processing plants and various natural gas compressors and related support equipment in the Central Region, as of
December 31, 2025.
For additional information regarding the ABS notes, Nordic Bonds, and Credit Facility, refer to Note 15 in the Notes to the
Consolidated Financial Statements.
For the year ended December 31, 2025, a 100 basis point adjustment in the borrowing rate for the Credit Facility would result in a
corresponding effect on interest expense of approximately $5 million. This represents a reasonably possible change in interest rate
risk.
We strive to maintain a prudent balance of floating and fixed-rate borrowing exposure, particularly during uncertain market
conditions. As part of our risk mitigation strategy, we occasionally enter into swap arrangements to adjust our exposure to floating or
fixed interest rates, depending on changes in the composition of borrowings in our portfolio. Consequently, the total principal hedged
through the use of derivatives varies from period to period.
53
Form 10-K | Diversified Energy Company |
As of December 31, 2025, the fair value of our interest rate swaps represents a liability of $0.1 million. For additional information
regarding derivatives, refer to Note 8 in the Notes to the Consolidated Financial Statements.
Counterparty & Customer Credit Risk
We are exposed to counterparty and customer credit risk from the hedging and sale of our natural gas, NGLs and oil.
Our derivative instruments expose us to our counterparties’ credit risk. To mitigate this risk, we only enter into commodity contracts
with counterparties that are highly rated or deemed by us to have acceptable credit strength and competence. Counterparty non-
performance risk is considered in the valuation of our derivative instruments, but has not had an impact on the value of our derivatives.
We also attempt to limit our exposure to non-performance by any single counterparty. As of December 31, 2025, our commodity
contracts derivative instruments were spread among 13 counterparties.
For additional information regarding derivatives, refer to Note 8 in the Notes to the Consolidated Financial Statements
Accounts receivable from customers represent amounts due for the purchase of these commodities, and their collectability depends on
the financial condition of each customer. We review the financial condition of customers before extending credit and generally do not
require collateral to support their accounts receivable. As of December 31, 2025, we had no customers that comprised over 10% of our
total accounts receivable from customers. Net of the applicable allowance for credit losses, our accounts receivable from customers
were $347 million as of December 31, 2025.
The Company is also exposed to credit risk from joint interest owners, which are entities that own a working interest in the properties
operated by the Company. Joint interest receivables are classified under accounts receivable, net, in the Consolidated Statement of
Financial Position. The Company has the ability to withhold future revenue payments to recover any non-payment of joint interest
receivables. As of December 31, 2025, our joint interest receivables, net of the applicable allowance for credit losses, were $61
million.
Accounts receivable are current, and the Company believes these net receivables are collectible. For additional information regarding
accounts receivable, refer to Note 9 in the Notes to the Consolidated Financial Statements.
54
Form 10-K | Diversified Energy Company |
Item 8. Financial Statements and Supplementary Data
Page | |
Consolidated Statements of Changes in Stockholders' Equity | |
55
Form 10-K | Diversified Energy Company |
Report of Independent Registered Public Accounting Firm
To the Board of Directors and Stockholders of Diversified Energy Company
Opinions on the Financial Statements and Internal Control over Financial Reporting
We have audited the accompanying consolidated balance sheets of Diversified Energy Company and its subsidiaries (the "Company")
as of December 31, 2025 and 2024, and the related consolidated statements of comprehensive income, of changes in stockholders’
equity and of cash flows for each of the three years in the period ended December 31, 2025, including the related notes (collectively
referred to as the "consolidated financial statements"). We also have audited the Company's internal control over financial reporting as
of December 31, 2025, based on criteria established in Internal Control - Integrated Framework (2013) issued by the Committee of
Sponsoring Organizations of the Treadway Commission (COSO).
In our opinion, the consolidated financial statements referred to above present fairly, in all material respects, the financial position of
the Company as of December 31, 2025 and 2024, and the results of its operations and its cash flows for each of the three years in the
period ended December 31, 2025 in conformity with accounting principles generally accepted in the United States of America. Also in
our opinion, the Company maintained, in all material respects, effective internal control over financial reporting as of December 31,
2025, based on criteria established in Internal Control - Integrated Framework (2013) issued by the COSO.
Basis for Opinions
The Company's management is responsible for these consolidated financial statements, for maintaining effective internal control over
financial reporting, and for its assessment of the effectiveness of internal control over financial reporting, included in Management’s
Annual Report on Internal Control Over Financial Reporting appearing under Item 9A. Our responsibility is to express opinions on the
Company’s consolidated financial statements and on the Company's internal control over financial reporting based on our audits. We
are a public accounting firm registered with the Public Company Accounting Oversight Board (United States) (PCAOB) and are
required to be independent with respect to the Company in accordance with the U.S. federal securities laws and the applicable rules
and regulations of the Securities and Exchange Commission and the PCAOB.
We conducted our audits in accordance with the standards of the PCAOB. Those standards require that we plan and perform the audits
to obtain reasonable assurance about whether the consolidated financial statements are free of material misstatement, whether due to
error or fraud, and whether effective internal control over financial reporting was maintained in all material respects.
Our audits of the consolidated financial statements included performing procedures to assess the risks of material misstatement of the
consolidated financial statements, whether due to error or fraud, and performing procedures that respond to those risks. Such
procedures included examining, on a test basis, evidence regarding the amounts and disclosures in the consolidated financial
statements. Our audits also included evaluating the accounting principles used and significant estimates made by management, as well
as evaluating the overall presentation of the consolidated financial statements. Our audit of internal control over financial reporting
included obtaining an understanding of internal control over financial reporting, assessing the risk that a material weakness exists, and
testing and evaluating the design and operating effectiveness of internal control based on the assessed risk. Our audits also included
performing such other procedures as we considered necessary in the circumstances. We believe that our audits provide a reasonable
basis for our opinions.
As described in Management’s Annual Report on Internal Control Over Financial Reporting, management has excluded Canvas
Energy Inc. (Canvas) from its assessment of internal control over financial reporting as of December 31, 2025 because it was acquired
by the Company during 2025. We have also excluded Canvas from our audit of internal control over financial reporting. Canvas is a
wholly-owned subsidiary whose total assets and revenues represent approximately 9% and 1%, respectively, of the related
consolidated financial statement amounts as of and for the year ended December 31, 2025.
Definition and Limitations of Internal Control over Financial Reporting
A company’s internal control over financial reporting is a process designed to provide reasonable assurance regarding the reliability of
financial reporting and the preparation of financial statements for external purposes in accordance with generally accepted accounting
principles. A company’s internal control over financial reporting includes those policies and procedures that (i) pertain to the
maintenance of records that, in reasonable detail, accurately and fairly reflect the transactions and dispositions of the assets of the
company; (ii) provide reasonable assurance that transactions are recorded as necessary to permit preparation of financial statements in
accordance with generally accepted accounting principles, and that receipts and expenditures of the company are being made only in
accordance with authorizations of management and directors of the company; and (iii) provide reasonable assurance regarding
prevention or timely detection of unauthorized acquisition, use, or disposition of the company’s assets that could have a material effect
on the financial statements.
Because of its inherent limitations, internal control over financial reporting may not prevent or detect misstatements. Also, projections
of any evaluation of effectiveness to future periods are subject to the risk that controls may become inadequate because of changes in
conditions, or that the degree of compliance with the policies or procedures may deteriorate.
56
Form 10-K | Diversified Energy Company |
Critical Audit Matters
The critical audit matter communicated below is a matter arising from the current period audit of the consolidated financial statements
that was communicated or required to be communicated to the audit committee and that (i) relates to accounts or disclosures that are
material to the consolidated financial statements and (ii) involved our especially challenging, subjective, or complex judgments. The
communication of critical audit matters does not alter in any way our opinion on the consolidated financial statements, taken as a
whole, and we are not, by communicating the critical audit matter below, providing a separate opinion on the critical audit matter or
on the accounts or disclosures to which it relates.
The Impact of Proved Developed Natural Gas, Oil, and Natural Gas Liquids (NGL) Reserves on Natural Gas and Oil Properties, Net
As described in Notes 2 and 6 to the consolidated financial statements, the Company's natural gas and oil properties, net balance was
$4.5 billion as of December 31, 2025, and the related depreciation, depletion and amortization expense for the year ended December
31, 2025 was $339.2 million, both of which substantially related to proved developed natural gas, oil, and NGL reserves. Natural gas
and oil properties are accounted for using the successful efforts method of accounting. Depletion of capitalized costs for proved
natural gas, oil and NGL reserves is calculated using the unit-of-production method. Leasehold costs are depleted over total proved
reserves in the relevant area, while costs associated with production and development wells are depleted over proved developed
producing reserves. In estimating proved natural gas, oil and NGL reserves, management depends on the interpretation and judgment
of engineering and production data, as well as the use of certain economic data such as commodity prices, operating expenses, capital
expenditures, and taxes. As disclosed by management, the Company’s reserves estimates are generally based on extrapolation of
historical production trends. The Company's internal staff of petroleum engineers and geoscience professionals work with the third-
party reserve engineers (together referred to as "management's specialists").
The principal considerations for our determination that performing procedures relating to the impact of proved developed natural gas,
oil and NGL reserves on natural gas and oil properties, net is a critical audit matter are (i) the significant judgment by management,
including the use of management's specialists, when developing the estimates of proved developed natural gas, oil and NGL reserves,
which are derived using historical production volumes and (ii) a high degree of auditor judgment, subjectivity, and effort in
performing procedures and evaluating audit evidence related to the data, specifically historical production volumes, methods, and
assumptions used by management and its specialists in developing the estimates of proved developed natural gas, oil and NGL
reserves.
Addressing the matter involved performing procedures and evaluating audit evidence in connection with forming our overall opinion
on the consolidated financial statements. These procedures included testing the effectiveness of controls relating to management's
estimates of proved developed natural gas, oil and NGL reserves. The work of management's specialists was used in performing the
procedures to evaluate the reasonableness of the estimates of proved developed natural gas, oil and NGL reserves. As a basis for using
this work, the specialists' qualifications were understood and the Company's relationship with the specialists was assessed. The
procedures performed also included (i) evaluating the methods and assumptions used by the specialists; (ii) testing the completeness
and accuracy of the data used by the specialists related to historical production volumes; and (iii) evaluating the specialists' findings
related to estimated future production volumes by comparing the estimate to relevant historical and current period production volumes,
as applicable.
/s/ PricewaterhouseCoopers LLP
February 26, 2026
We have served as the Company’s auditor since 2020.
57
Consolidated Balance Sheets | Diversified Energy Company |
As of December 31, | ||
(In thousands, except par and share data) | 2025 | 2024 |
ASSETS | ||
Current assets: | ||
Cash and cash equivalents | $ | $ |
Restricted cash | ||
Accounts receivable, net | ||
Derivatives | ||
Prepaid expenses and other current assets | ||
Total current assets | $ | $ |
Noncurrent assets: | ||
Natural gas and oil properties (successful efforts method): | ||
Proved natural gas and oil properties | $ | $ |
Unproved natural gas and oil properties | ||
Accumulated depletion | ( | ( |
Natural gas and oil properties, net | ||
Property, plant, and equipment, net | ||
Restricted cash | ||
Deferred tax assets | ||
Other assets | ||
Total assets | $ | $ |
LIABILITIES AND STOCKHOLDERS' EQUITY | ||
Current liabilities: | ||
Accounts payable | $ | $ |
Accrued liabilities | ||
Revenue to be distributed | ||
Current portion of long-term debt, net | ||
Derivatives | ||
Other current liabilities | ||
Total current liabilities | $ | $ |
Noncurrent liabilities: | ||
Asset retirement obligations | $ | $ |
Long-term debt, net | ||
Derivatives | ||
Other liabilities | ||
Total liabilities | $ | $ |
Commitments and contingencies (Note 19) | ||
Stockholders' equity: | ||
Common stock ($ | $ | $ |
Additional paid in capital | ||
Accumulated other comprehensive income (loss) | ( | ( |
Retained earnings (accumulated deficit) | ( | ( |
Total stockholders' equity attributable to DEC | $ | $ |
Noncontrolling interests | ||
Total stockholders' equity | $ | $ |
Total liabilities and stockholders' equity | $ | $ |
The accompanying notes are an integral part of the Consolidated Financial Statements.
58
Consolidated Statements of Comprehensive Income (Loss) | Diversified Energy Company |
For the Year Ended December 31, | |||
(In thousands, except share and per share data) | 2025 | 2024 | 2023 |
Revenue | |||
Natural gas | $ | $ | $ |
NGLs | |||
Oil | |||
Total commodity revenue | $ | $ | $ |
Gain (loss) on derivatives | ( | ||
Midstream | |||
Other | |||
Total revenue | $ | $ | $ |
Operating expense | |||
Lease operating expense | $( | $( | $( |
Production taxes | ( | ( | ( |
Midstream operating expense | ( | ( | ( |
Transportation expense | ( | ( | ( |
Accretion of asset retirement obligation | ( | ( | ( |
General and administrative expense | ( | ( | ( |
Depreciation, depletion and amortization | ( | ( | ( |
Gain (loss) on natural gas and oil properties and equipment | |||
Total operating expense | $( | $( | $( |
Income (loss) from operations | $ | $( | $ |
Other income (expense) | |||
Gain (loss) on sale of equity interest | $ | $ | $ |
Interest expense | ( | ( | ( |
Loss on debt extinguishment | ( | ( | |
Other income (expense) | |||
Income (loss) before taxation | $ | $( | $ |
Income tax benefit (expense) | ( | ||
Net income (loss) | $ | $( | $ |
Other comprehensive income (loss) | ( | ( | |
Total comprehensive income (loss) | $ | $( | $ |
Net income (loss) attributable to: | |||
DEC | $ | $( | $ |
Noncontrolling interest | |||
Net income (loss) | $ | $( | $ |
Earnings (loss) per share attributable to DEC | |||
Basic | $ | $( | $ |
Diluted | $ | $( | $ |
Weighted average shares outstanding | |||
Basic | |||
Diluted | |||
The accompanying notes are an integral part of the Consolidated Financial Statements.
59
Consolidated Statements of Changes in Stockholders’ Equity | Diversified Energy Company |
Common Stock | ||||||||
(In thousands, except share data) | Shares | Amount | Additional Paid in Capital | Accumulated Other Comprehensive Income (Loss) | Retained Earnings (Accumulated Deficit) | Total Stockholders' Equity Attributable to DEC | Noncontrolling Interest | Total Stockholders ' Equity |
Balance as of January 1, 2023 | $ | $ | $ | $( | $( | $ | $( | |
Net income (loss) | — | — | — | — | ||||
Other comprehensive income (loss) | — | — | — | ( | — | ( | — | ( |
Issuances of common stock | — | — | — | |||||
Repurchases of common stock | ( | ( | ( | — | — | ( | — | ( |
Share-based compensation | — | — | — | ( | — | |||
Dividends declared | — | — | — | ( | ( | — | ( | |
Distributions to noncontrolling interest owners | — | — | — | — | — | — | ( | ( |
Balance as of December 31, 2023 | $ | $ | $ | $( | $ | $ | $ | |
Net income (loss) | — | — | — | — | ( | ( | ( | |
Other comprehensive income (loss) | — | — | — | ( | — | ( | — | ( |
Issuances of common stock | — | — | — | |||||
Repurchases of common stock | ( | ( | ( | — | — | ( | — | ( |
Share-based compensation | — | — | — | ( | — | |||
Dividends declared | — | — | — | ( | ( | — | ( | |
Distributions to noncontrolling interest owners | — | — | — | — | — | — | ( | ( |
Balance as of December 31, 2024 | $ | $ | $( | $( | $ | $ | $ | |
Net income (loss) | — | — | — | — | ||||
Other comprehensive income (loss) | — | — | — | — | — | |||
Issuances of common stock | — | — | — | |||||
Repurchases of common stock | ( | ( | ( | — | — | ( | — | ( |
Share-based compensation | — | — | — | ( | — | |||
Dividends declared | — | — | ( | — | ( | ( | — | ( |
Distributions to noncontrolling interest owners | — | — | — | — | — | — | ( | ( |
U.S. Domestication | — | ( | — | — | — | — | ||
Balance as of December 31, 2025 | $ | $ | $( | $( | $ | $ | $ | |
The accompanying notes are an integral part of the Consolidated Financial Statements.
60
Consolidated Statements of Cash Flows | Diversified Energy Company |
For the Year Ended December 31, | |||
(In thousands) | 2025 | 2024 | 2023 |
Cash flows from operating activities: | |||
Net income (loss) | $ | $( | $ |
Adjustments to reconcile net income (loss) to net cash provided by operating activities: | |||
Depreciation, depletion and amortization | |||
Accretion of asset retirement obligations | |||
Income tax (benefit) expense | ( | ( | |
(Gain) loss on derivatives | ( | ( | |
Cash proceeds (payments) on settlement of derivatives | |||
Settlement of asset retirement costs | ( | ( | ( |
(Gain) loss on natural gas and oil properties and equipment | ( | ( | ( |
(Gain) loss on sale of equity interest | ( | ||
Loss on early retirement of debt | |||
Derivative modifications | |||
Non-cash share-based compensation | |||
Other | |||
Changes in working capital: | |||
Accounts receivable, net | ( | ||
Other assets | ( | ( | |
Accounts payable | ( | ( | ( |
Other liabilities | ( | ( | ( |
Net cash provided by operating activities | $ | $ | $ |
Cash flows from investing activities: | |||
Consideration for business acquisitions, net of cash acquired | $( | $ | $ |
Consideration for asset acquisitions, net of cash acquired | ( | ( | ( |
Proceeds from divestitures | |||
Capital expenditures | ( | ( | ( |
Deferred consideration payments | ( | ( | |
Net cash (used in) investing activities | $( | $( | $( |
Cash flows from financing activities: | |||
Repayment of borrowings | $( | $( | $( |
Proceeds from borrowings | |||
Prepayment charge on early retirement of debt | ( | ||
Debt issuance costs | ( | ( | ( |
Hedge modifications associated with ABS Notes | ( | ( | |
Proceeds from equity issuance, net | |||
Proceeds from lease modifications | |||
Principal element of lease payments | ( | ( | ( |
Dividends to stockholders | ( | ( | ( |
Distributions to noncontrolling interest owners | ( | ( | ( |
Repurchases of common stock (stock repurchase program) | ( | ( | ( |
Repurchases of common stock by the EBT, net | ( | ( | |
Net cash provided by (used in) financing activities | $ | $ | $( |
Net change in cash, cash equivalents and restricted cash | ( | ||
Cash, cash equivalents and restricted cash, beginning of period | |||
Cash, cash equivalents and restricted cash, end of period | $ | $ | $ |
Cash and cash equivalents | |||
Restricted cash | |||
Total cash, cash equivalents and restricted cash | $ | $ | $ |
The accompanying notes are an integral part of the Consolidated Financial Statements.
61
Diversified Energy Company |
Index to the Notes to the Consolidated Financial Statements
Diversified Energy Company, a Delaware corporation, and its wholly owned subsidiaries (collectively, the “Company”) is an
independent energy company engaged in the production, transportation and marketing of natural gas, oil and NGLs. The Company’s
assets are located in the United States within the following geographical operating areas:
•Appalachian Region, which spans Ohio, Pennsylvania, Virginia, West Virginia, Kentucky, Tennessee and Alabama;
•Central Region, which includes Texas, Oklahoma, New Mexico, Louisiana and Arkansas;
•Other, which includes Florida and Wyoming.
The Company is incorporated in the United States. Previously, the Company operated as a public limited company under UK law,
with its shares listed on the London Stock Exchange (“LSE”) since 2017. In December 2023, the Company’s shares were also
admitted to trading on the New York Stock Exchange (NYSE) under the ticker “DEC.” Following the Company’s U.S. Domestication,
its principal trading market is now the NYSE, although its shares continue to be listed on the LSE under the Equity Shares
(International Commercial Companies Secondary Listing) category.
On November 21, 2025, Diversified Energy Company PLC, a public company limited by shares, incorporated under the laws of
England and Wales, completed the U.S. Domestication, which was approved by the shareholders of Diversified Energy Company
PLC, resulting in Diversified Energy Company, a Delaware corporation, becoming our publicly traded parent company (the “U.S.
Domestication”). Diversified Energy Company PLC’s stockholders and the High Court of Justice of England and Wales approved the
scheme of arrangement effecting the U.S. Domestication. Effective after the close of market trading on November 21, 2025, all issued
and outstanding common stock of Diversified Energy Company PLC were exchanged on a one -for-one basis for newly issued shares
of corresponding common stock of Diversified Energy Company, and all issued and outstanding equity awards of Diversified Energy
Company PLC were assumed by Diversified Energy Company and were converted into rights to acquire Diversified Energy Company
shares of common stock on the same terms. The common stock of Diversified Energy Company began trading on November 24, 2025
(the first trading day following the U.S. Domestication), and the Company’s trading symbol on NYSE remained unchanged as “DEC.”
transactions have been eliminated in consolidation. Noncontrolling interests in subsidiaries are presented as a separate component of
equity in the Consolidated Financial Statements.
The preparation of the Consolidated Financial Statements in conformity with U.S. GAAP requires management to make estimates and
assumptions that affect the reported amounts of assets and liabilities and the disclosure of contingent assets and liabilities as of the
date of the Consolidated Financial Statements, as well as the reported amounts of revenues and expenses during the reporting period.
Actual results could differ from those estimates.
Significant estimates include the quantities of proved natural gas and oil reserves. Reservoir engineering is a subjective process, and
there are numerous uncertainties inherent in estimating quantities of proved reserves. The accuracy of any reserves estimate depends
62
Diversified Energy Company |
on the quality of available data and the interpretation and judgment of engineering and geological information. As a result, actual
quantities recovered may differ from estimated reserves.
Other items subject to estimates and assumptions include valuation of assets acquired and liabilities assumed in a business
combination, the carrying amounts of natural gas and oil properties, property, plant and equipment, the valuation of certain
derivatives, asset retirement obligations, and valuation allowances for deferred income tax assets, among others. Management believes
these estimates are reasonable, however, actual results could differ from these estimates.
In accordance with ASC 280, Segment Reporting, the Company establishes operating segments based on the components of the
business that are regularly reviewed by the chief executive officer, who serves as the chief operating decision maker (“CODM”), for
the purposes of allocating resources and assessing performance. The CODM evaluates the Company’s operations in a consolidated and
complementary manner, with a focus on vertical integration and margin improvement. As of December 31, 2025, the Company
considered each of the operating areas in aggregate to represent a single reportable segment due to the similar nature of the exploration
and production business across the Company.
The CODM uses consolidated net income (loss), for purposes of allocating resources and in assessing the Company’s operating
performance. Additionally, the CODM is regularly provided information on lease operating expense, transportation expense,
production taxes, and general and administrative expense, which are significant segment expenses. Other segment items primarily
consist of depreciation, depletion and amortization, interest expense, and income tax expense (benefit). The Company’s significant
segment expenses and other segment items are derived from, and can be found within the Consolidated Statements of Comprehensive
Income (Loss).
The measure of segment assets is total assets as reported on the Consolidated Balance Sheets. As of December 31, 2025 and 2024 the
Company’s total assets were $6.2 billion and $4.0 billion, respectively. Additionally, in analyzing company performance, the CODM
reviews capital expenditures. During the years ended December 31, 2025, 2024 and 2023, the Company’s capital expenditures were
Cash and cash equivalents consist of highly liquid investments with an original maturity of three months or less. The Company maintains cash
balances at financial institutions, which at times may exceed federally insured limits. The Company has not experienced any losses in such
accounts and believes it is not exposed to any significant credit risk related to cash and cash equivalents.
The Company classifies cash as restricted when its withdrawal or use is limited by contractual or regulatory requirements. Restricted
cash consists of amounts held on deposit for specific purposes and is not available for general corporate use. Restricted cash is
presented as either a current or noncurrent asset, based on the expected timing of the related obligations.
Restricted cash includes:
•Amounts held as collateral for surety bonds or required by state agencies for well abandonment obligations.
•Cash reserves required for interest payments and fees related to the Company’s asset-backed securitizations, which are
managed by an independent indenture trustee.
As of | ||
(in thousands) | December 31, 2025 | December 31, 2024 |
Cash restricted by asset-backed securitizations | $ | $ |
Other restricted cash | ||
Total restricted cash | $ | $ |
Classified as: | ||
Current asset | $ | $ |
Noncurrent asset | ||
Total | $ | $ |
63
Diversified Energy Company |
The Company accounts for business combinations and asset acquisitions in accordance with ASC 805, Business Combinations. For
each transaction, management evaluates whether the acquired set of assets and activities constitutes a business by first applying the
screen test. If substantially all of the fair value of the gross assets acquired is concentrated in a single asset or group of similar assets,
the transaction is accounted for as an asset acquisition. If the screen test is not met, the Company performs an evaluation to determine
if the minimum required inputs and processes exist in order to be accounted for as a business combination.
For business combinations, the acquisition method is applied, and identifiable assets acquired and liabilities assumed are generally
recognized at their acquisition-date fair values. The excess of the purchase price over the fair value of net identifiable assets is
recorded as goodwill; if the fair value of net assets exceeds the purchase price, a gain on bargain purchase is recognized in earnings
after reassessment. Noncontrolling interests are measured at fair value. Transaction costs are expensed as incurred.
fair values. Goodwill is not recognized, and any excess of net asset value over purchase price is not recorded as a gain. Changes in
contingent consideration are generally recognized as adjustments to the asset basis.
The determination and allocation of fair values, as well as the assessment of whether an acquisition constitutes a business, require
significant management judgment and the use of estimates, including valuation techniques, discount rates, and assumptions about
future cash flows. For business combinations, provisional fair value amounts may be adjusted during the measurement period, not to
exceed one year from the acquisition date, if new information becomes available.
Inventory consists primarily of natural gas and materials and supplies used in the Company’s operations. Inventory is stated at the
lower of cost or net realizable value, with cost determined using the weighted average cost method. Net realizable value represents the
As of December 31, 2025 and 2024, inventory balances were not material to the Consolidated Financial Statements and are included
within “other current assets” on the Consolidated Balance Sheets.
Accounts receivable primarily consist of receivables from sales of natural gas and oil production delivered to purchasers and
receivables due from joint interest owners on properties the Company operates.
Accounts receivable are stated at amounts due from joint interest owners or purchasers, net of an allowance for expected credit losses.
The Company evaluates the financial condition of customers before extending credit and does not typically require collateral. The
allowance for credit losses is determined using the Current Expected Credit Losses (“CECL”) model, which considers historical loss
experience, current economic conditions, and reasonable forecasts of future conditions. The Company reviews the adequacy of the
allowance regularly and adjusts it as necessary. Adjustments to the allowance are recognized in the Consolidated Statement of
Operations.
As of December 31, 2025 and 2024, the Company recorded an allowance for credit losses of $36 million and $16 million,
respectively. Refer to Note 9 for additional information.
Borrowings are initially recognized at the fair value of proceeds received, net of directly attributable transaction costs. Subsequently,
borrowings are carried at amortized cost, with transaction costs, discounts, and premiums amortized over the term of the borrowings
using the effective interest method. Interest expense is recognized in the Consolidated Statements of Comprehensive Income (Loss)
The Company utilizes derivatives, such as swaps and collars, to manage risks associated with commodity price volatility and the
resulting unpredictability of cash flows. These contracts are settled financially each month and do not involve physical delivery of
commodities. Management is responsible for the oversight and application of the Company’s derivative accounting policies.
Derivative contracts are initially recognized at fair value on the contract date and remeasured to fair value at each reporting date in
accordance with U.S. GAAP. Derivatives reflected as current in the consolidated balance sheets represent the estimated fair value of
derivatives scheduled to settle over the next 12 months based on market prices/rates as of the respective balance sheet dates. Cash
settlements of derivatives are generally classified as operating cash flows unless the derivatives are deemed to contain, for accounting
purposes, a significant financing element at contract inception, in which case these cash settlements are classified as financing cash
flows in the accompanying consolidated statements of cash flows. Netting of derivative assets and liabilities is applied at each
reporting date when a legal right of offset exists under a master netting arrangement. All changes in fair value are recognized in the
64
Diversified Energy Company |
Consolidated Statements of Comprehensive Income (Loss) under gain (loss) on derivatives in the period incurred. None of the
Company’s derivatives are designated as hedging instruments under ASC 815.
All derivatives are classified as Level 2 instruments under ASC 820, as their valuation relies on observable market inputs other than
quoted prices.
Additional information regarding the fair value of derivatives and the Company’s exposure to commodity price risk is provided in
Note 8.
Natural gas and oil properties are accounted for using the successful efforts method of accounting.
Development & Acquisition Costs
Costs incurred to acquire mineral interests in properties, including purchases, leases, and related legal fees, are capitalized when
incurred. Expenditures for the construction, installation or completion of infrastructure facilities, such as platforms, and the drilling
and equipping of development wells, including delineation wells, are capitalized as part of natural gas and oil properties. The initial
cost of an asset includes its purchase price or construction cost, directly attributable costs necessary to bring the asset to operational
status, and the initial estimate of the asset retirement obligations.
Depletion
Depletion of capitalized costs for proved natural gas, oil and NGL reserves is calculated using the unit-of-production method.
Leasehold costs are depleted over total proved reserves in the relevant area, while costs associated with production and development
wells are depleted over proved developed producing reserves.
Fair Value of Acquired Properties
For business combinations, the Company determines the fair value of acquired natural gas and oil properties using the income
approach, which involves estimating future net cash flows based on future production volumes, production and development costs,
and forward commodity prices. These cash flows are discounted using a weighted average cost of capital and appropriate risk factors.
Proved Reserves
Proved reserves are the estimated volumes of natural gas, oil and NGLs that can be economically produced with reasonable certainty
from known reservoirs, given current economic conditions and operating methods.
To estimate these reserves, we depend on the interpretation and judgment of engineering and production data, along with certain
economic data such as commodity prices, operating expenses, capital expenditures, and taxes. Since many factors, assumptions, and
variables involved in estimating proved reserves can change over time, the estimates of natural gas, oil and NGL reserve volumes are
subject to revision.
Impairment of Natural Gas & Oil Properties
The Company reviews its natural gas and oil properties for impairment in accordance with ASC 360. Impairment indicators include
significant or prolonged declines in commodity prices, adverse changes in market conditions, downward revisions of reserve
estimates, or increases in operating costs. When indicators of impairment are present, the Company performs a recoverability test at
the field level by comparing the carrying value of the property to the undiscounted expected future net cash flows. If the carrying
value is not recoverable, an impairment loss is recognized to reduce the asset’s carrying value to its estimated fair value, determined
Impairment losses, when recognized, are reflected in the Consolidated Statements of Comprehensive Income (Loss) within the
appropriate functional category.
Property, plant and equipment are recorded at cost, which includes the purchase price and all costs directly attributable to acquiring the asset
and preparing for its intended use. Costs may include installation, delivery, site preparation, and professional fees. Expenditures for major
renewals and improvements that extend the useful life of an asset are capitalized, while maintenance and repairs are expensed as incurred.
65
Diversified Energy Company |
Range in Years | |
Buildings and leasehold improvements | |
Equipment | |
Motor vehicles | |
Midstream assets | |
Other property and equipment |
Assets held under finance leases (right-of-use assets) are depreciated over the shorter of the lease term or the estimated useful life of
the underlying asset, in accordance with ASC 842.
The Company capitalizes certain costs incurred in the development or acquisition of software for internal use in accordance with ASC
350-40. Capitalization begins when the preliminary project stage is complete and management has authorized and committed to
funding the software project, and it is probable that the project will be completed and the software will be used as intended.
Capitalized costs include direct costs of materials and services, payroll and payroll-related costs for employees directly associated with
the project, and a reasonable allocation of overhead. Costs incurred during the application development stage are capitalized, while
costs incurred during the preliminary project stage and post-implementation/operation stage, including maintenance and training, are
expensed as incurred.
Software development costs acquired from third parties and controlled by the Company are capitalized when the software is ready for
its intended use. Capitalized software development costs are recorded as property, plant and equipment and depreciated on a straight-
line basis over their estimated useful lives, beginning when the software is placed in service.
The Company depreciates software on a straight-line basis over the estimated useful life of 3 years.
Noncontrolling interests represent the portion of equity in subsidiaries not attributable to the Company’s stockholders and are
presented as a separate component of equity in the Consolidated Balance Sheets. The acquisition of a noncontrolling interest in a
subsidiary and the sale of an interest while retaining control are accounted for as transactions within equity and are reported within
noncontrolling interests in the consolidated financial statements.
During the years ended December 31, 2025, 2024 and 2023, the Company recorded net income attributable to noncontrolling interests
of $0.8 million, $1.3 million and $1.7 million, respectively. As of December 31, 2025 and 2024, the noncontrolling interests balance
was $11 million and $12 million, respectively. Distributions to noncontrolling interest owners were $1.7 million, $2.0 million and $4.0
million for the years ended December 31, 2025, 2024 and 2023, respectively. A reconciliation of the beginning and ending balances of
noncontrolling interests is provided in the Consolidated Statements of Changes in Stockholders' Equity.
The Company accounts for leases in accordance with ASC 842, Leases. At the commencement date of a lease, the Company
recognizes a right-of-use (“ROU”) asset and a lease liability for contracts that convey the right to control the use of an identified asset
for a period of time in exchange for consideration. The lease liability is initially measured at the present value of future lease
payments, discounted using the rate implicit in the lease, or if not readily determinable, the Company’s incremental borrowing rate.
The ROU asset is initially measured at cost, which includes the initial measurement of the lease liability, any lease payments made at
or before commencement, initial direct costs, and an estimate of costs to restore the underlying asset or site, as required by the lease.
Leases are classified as either finance or operating leases at inception. For finance leases, the Company recognizes interest expense on
the lease liability and amortization expense on the ROU asset separately. For operating leases, a single lease expense is recognized on
a straight-line basis over the lease term. The lease liability is subsequently measured at amortized cost, and the ROU asset is
depreciated over the shorter of the lease term or the useful life of the underlying asset. The Company remeasures the lease liability and
adjusts the ROU asset when certain events occur, such as changes in lease term or lease payments. The Company may elect not to
66
Diversified Energy Company |
When a liability exists for the retirement of a well, removal of production equipment, and site restoration at the end of a well’s
productive life, the Company recognizes an asset retirement liability. The amount recognized is the present value of estimated future
net expenditures, determined in accordance with our anticipated retirement plans and local conditions and requirements. The
unwinding of the discount on the decommissioning liability is included as accretion of the decommissioning provision. The cost of the
relevant property, plant and equipment asset is increased by an amount equivalent to the liability and depreciated on a unit of
production basis. The Company recognizes changes in estimates prospectively, with corresponding adjustments to the liability and the
associated noncurrent asset.
The costs associated with asset retirement obligations are inherently uncertain and can fluctuate due to various factors, such as changes
in legal requirements, the development of new restoration techniques, or experiences at other production sites. The expected timing
and amount of these expenditures can also vary, for instance, due to changes in reserves or modifications in laws and regulations or
their interpretation. Consequently, significant estimates and assumptions are necessary to determine the provision for asset retirement.
These assumptions include the costs to retire the wells, the Company’s retirement plan, an assumed inflation rate, and the discount
The Company makes certain estimates when calculating deferred tax assets and liabilities, as well as income tax expense. These
estimates often require judgment regarding the timing and recognition of differences of revenue and expenses for tax and financial
reporting purposes, as well as the tax basis of our assets and liabilities at the balance sheet date before tax returns are completed.
Additionally, the Company must evaluate the likelihood of recovering or utilizing its deferred tax assets and may record a valuation
allowance against these assets when it is not expected that they will be realized. In determining whether to apply a valuation
allowance, the Company considers evidence such as future taxable income, among other factors. This process involves numerous
judgments and assumptions, including estimates of commodity prices, production, and other operating conditions. If any of these
factors, assumptions, or judgments change, the deferred tax asset could be adjusted, particularly decreasing if it is determined that the
asset is unlikely to be realized. Conversely, a valuation allowance may be reversed if it is determined that the asset is likely to be
realized.
Deferred Income Tax
Deferred tax assets and liabilities arise from temporary differences between the tax bases of assets and liabilities and their carrying
amounts in the Consolidated Financial Statements. Deferred tax is determined using tax rates (and laws) that have been enacted or
substantively enacted by the balance sheet date and are expected to apply when the related deferred tax asset is realized or the deferred
liability is settled.
Deferred tax assets are recognized to the extent that it is probable that the future taxable profit will be available against which the
temporary differences can be utilized. The Company offsets deferred tax assets and liabilities when it has a legally enforceable right to
set off current tax assets against current tax liabilities, provided that the deferred tax assets and liabilities relate to income taxes levied
by the same taxation authority.
Current Income Tax
Current income tax assets and liabilities for the years ended December 31, 2025 and 2024 were measured at the amounts to be
recovered from, or paid to, the taxation authorities. The tax rates (and laws) used to compute these amounts are those enacted or
substantively enacted at the reporting date in the jurisdictions where the Company operates and generates taxable income.
Uncertain Tax Positions
Management periodically evaluates positions taken in tax returns where applicable tax regulation is subject to interpretation and
considers whether it is probable that a taxation authority will accept an uncertain tax treatment. The Company measures its tax
balances based on either the most likely amount or the expected value, depending on which method better predicts the resolution of the
The Company extracts and sells natural gas, NGLs and oil to a variety of customers. Additionally, the Company offers gathering and
transportation services, as well as asset retirement and other services to third parties.
The Company recognizes revenue in accordance with ASC 606, Revenue from Contracts with Customers. Revenue is recognized
when control of the promised goods or services is transferred to the customer in an amount that reflects the consideration to which the
Company expects to be entitled in exchange for those goods or services. The Company applies the five-step model to all revenue
streams: (1) Identify the contract(s) with a customer; (2) Identify the performance obligations in the contract; (3) Determine the
transaction price; (4) Allocate the transaction price to the performance obligations; and (5) Recognize revenue when (or as) the
performance obligations are satisfied.
67
Diversified Energy Company |
For commodity revenue, control is typically transferred at the delivery point (e.g., vessel, pipe, sales meter), which is when the
Company satisfies its performance obligation. Revenue is recognized based on the Company’s working interest and the terms of the
relevant contracts. Revenue from gathering, transportation, plugging, and water disposal services is recognized as the services are
performed, based on contractually agreed-upon prices and volumes. Revenue is presented net of sales taxes, excise duties, and similar
levies. The Company assesses whether it is acting as principal or agent in all arrangements and recognizes revenue accordingly.
Disaggregated revenue by major product and service line (including natural gas, NGLs, oil, midstream, and other revenue) is presented
on the face of the Consolidated Statement of Operations. These categories reflect the nature, timing, and uncertainty of revenue and
cash flows and are consistent with how management evaluates the business.
A significant portion of the Company’s accounts receivable stem from sales of natural gas, NGLs and oil. These receivables are
uncollateralized and typically collected within 30 to 60 days.
For the years ended December 31, 2025, 2024 and 2023, no single customer accounted for more than 10% of total revenues.
The Company operates in a single reportable segment, and all revenue is generated in the United States.
The Company accounts for share-based payments in accordance with ASC 718, Compensation—Stock Compensation. All of the
Company’s share-based awards are equity-settled and measured at fair value on the grant date. The Company has three types of share-
based payment awards: RSUs, PSUs, and Options. The fair value of RSUs is measured using the stock price at the grant date. The fair
value of PSUs with market-based conditions is measured using a Monte Carlo simulation model, with inputs including share price at
grant date, expected volatility, expected dividends, risk-free rate of interest, and expected exercise patterns. The fair value of Options
is determined using the Black-Scholes model, with inputs including share price at grant date, exercise price, expected volatility, and
risk-free rate of interest. The grant date fair value of share-based awards is recognized as compensation expense over the requisite
service period, typically the vesting period. For awards with market-based conditions, expense is recognized regardless of whether the
condition is met. The Company accounts for forfeitures as they occur.
ASU Number | Description | Effective Date | Impact on Financial Statements |
ASU 2024-04 | Debt—Debt with Conversion and Other Options | January 1, 2026 | The Company is assessing the impact, but does not expect a material effect. |
ASU 2025-01 | Income Statement—Reporting Comprehensive Income—Expense Disaggregation Disclosures | January 1, 2027 | The Company is currently assessing the impact on its disclosures. |
ASU 2025-05 | Measurement of credit losses for accounts receivable and contract assets from transactions accounted for under Topic 606 | January 1, 2026 | The Company is assessing the impact, but does not expect a material effect. |
ASU 2025-06 | Accounting for software costs that are accounted for under Subtopic 350-40 (internal use software) | January 1, 2028 | The Company is assessing the impact, but does not expect a material effect. |
ASU 2025-07 | Derivatives scope refinements and scope clarification for share-based noncash consideration from a customer in a revenue contract | January 1, 2027 | The Company is assessing the impact, but does not expect a material effect. |
ASU 2025-11 | Interim financial statements and notes prepared in accordance with GAAP | January 1, 2029 | The Company is assessing the impact, but does not expect a material effect. |
The Company will adopt these standards on their respective effective dates. Based on preliminary assessment, the Company does not
expect the adoption of these to have a material impact on its consolidated financial statements.
68
Diversified Energy Company |
On November 24, 2025, the Company acquired Canvas. The Company determined that substantially all of the fair value of the gross
assets acquired was concentrated in a single asset group; therefore, the transaction was accounted for as an asset acquisition. The
Company paid purchase consideration of $533 million, inclusive of customary purchase price adjustments. The purchase consideration
consisted of the issuance of 3,718,209 new common shares direct to the unitholders of Canvas and $399 million in cash, inclusive of
transaction costs of $13 million. As part of the acquisition, the Company paid off on the acquisition date the $81 million balance
outstanding on Canvas’s credit facility.
Refer to Notes 11 and 15 for additional information regarding stockholders’ equity and debt.
fair values as of November 24, 2025 were as follows:
Consideration paid | |
Cash consideration | $ |
Fair value of common stock issued(a) | |
Payoff of existing credit facility | |
Total consideration | $ |
Net assets acquired | |
Cash | $ |
Natural gas and oil properties | |
Property, plant and equipment, net | |
Other noncurrent assets | |
Accounts receivable, net | |
Other current assets | |
Asset retirement obligations | ( |
Deferred tax liability | ( |
Other noncurrent liabilities | ( |
Accounts payable | ( |
Other current liabilities | ( |
Net assets acquired | $ |
(a)The fair value of the common stock issued was based on the closing price of the Company’s common stock on November 24, 2025
of $14.51 . The fair value of our common stock is a Level 1 input as our stock price is a quoted price in an active market.
On March 14, 2025, the Company acquired Maverick. The Company determined the transaction did not have a significant
concentration of assets and that it acquired an identifiable set of inputs, processes, and outputs. As a result, the Company concluded
the transaction was a business combination. The Company paid purchase consideration of approximately $666 million, inclusive of
customary purchase price adjustments. The purchase consideration consisted of the issuance of 21,194,213 new common shares direct
to the unitholders of Maverick and $211 million in cash. As part of the acquisition, the Company paid off on the acquisition date the
$202 million balance outstanding on Maverick’s credit facility and assumed $518 million of ABS Maverick Notes outstanding.
Transaction costs associated with the acquisition were $21 million and are included within G&A expense in the Consolidated
Statements of Comprehensive Income (Loss). Refer to Notes 11 and 15 for additional information regarding stockholders’ equity and
debt.
69
Diversified Energy Company |
of March 14, 2025 were as follows:
Consideration paid | |
Cash consideration | $ |
Fair value of common stock issued(a) | |
Payoff of existing credit facility | |
Total consideration | $ |
Net assets acquired | |
Cash | $ |
Natural gas and oil properties | |
Property, plant and equipment, net | |
Restricted cash | |
Other noncurrent assets | |
Derivatives, net | |
Accounts receivable, net | |
Other current assets | |
Asset retirement obligations | ( |
Borrowings | ( |
Other noncurrent liabilities | ( |
Accounts payable | ( |
Accrued operating expenses | ( |
Revenues payable | ( |
Other current liabilities | ( |
Net assets acquired | $ |
(a)The fair value of the common stock issued was based on the closing price of the Company’s common stock on March 14, 2025 of
$11.95 . The fair value of our common stock is a Level 1 input as our stock price is a quoted price in an active market.
The fair value of the natural gas and oil properties was based on estimated future production volumes, adjusted for risk characteristics
associated with the classification of the acquired reserves, and related future net cash flows discounted using a weighted average cost
of capital. The Company utilized NYMEX strip pricing adjusted for inflation. Management utilized the assistance of a third-party
valuation expert to estimate the fair value of the natural gas and oil properties acquired. The Company considers the discount rate,
commodity pricing, production and operating expense to be the assumptions most sensitive to the fair value of the acquired natural gas
and oil properties and represent Level 3 inputs, other than NYMEX strip pricing which represents a Level 1 input.
occurred on January 1, 2024.
For the Year Ended December 31, | ||
(in thousands, except per share data) | 2025 | 2024 |
Revenues | $ | $ |
Net income (loss) | ( | |
Basic earnings (loss) per share | $ | $( |
Diluted earnings (loss) per share | $ | $( |
The unaudited pro forma information is not necessarily indicative of the operating results that would have occurred, nor is it
necessarily indicative of future operating results of the combined entities.
On February 27, 2025, the Company acquired certain upstream assets and related infrastructure within Virginia, West Virginia, and
Alabama of the Appalachian Region from Summit. Given the concentration of assets, this transaction was considered an asset
acquisition rather than a business combination. The Company paid purchase consideration of $42 million, inclusive of transaction
costs of $0.4 million and customary purchase price adjustments, substantially all of which was accounted for as natural gas and oil
properties. The transaction was funded through proceeds from the new ABS X Notes collateralized, in part, by the acquired assets.
Refer to Note 12 for additional information regarding debt.
70
Diversified Energy Company |
During the year ended December 31, 2025, the Company acquired certain midstream and upstream assets that are contiguous to its
existing Central Region assets. The Company paid total purchase consideration of $16 million, inclusive of non-cash consideration of
$4 million, customary purchase price adjustments, and transaction costs. Given the concentration of assets, these transactions were
considered asset acquisitions rather than business combinations.
During the year ended December 31, 2025, the Company divested certain non-core undeveloped acreage across its operating footprint
for consideration of $160 million. The consideration received exceeded the carrying amount of the net assets divested resulting in a
gain on natural gas and oil properties and equipment of $95 million. Additionally, the disposal of various property, plant and
On October 29, 2024, the Company acquired certain developed producing assets in the East Texas area of the Central Region from a
regional operator (the “Seller”) (altogether, the “East Texas II transaction”). The Company assessed the acquired assets and
determined that this transaction was considered an asset acquisition rather than a business combination. When making this
determination, management concluded that the acquired assets did not meet the definition of a business. The Company paid purchase
consideration of $68 million, inclusive of transaction costs of $1 million and customary purchase price adjustments. The transaction
was funded through a combination of cash consideration of $40 million, drawing from a senior secured bank facility supported by the
acquired assets and existing liquidity, and the issuance of 2,342,445 new shares of common stock direct to the Seller. Refer to Notes
11 and 15 for additional information regarding common stock and debt, respectively.
On August 15, 2024, the Company acquired certain upstream assets and related infrastructure in the East Texas area of the Central
Region from Crescent Pass. The Company assessed the acquired assets and determined that this transaction was considered an asset
acquisition rather than a business combination. When making this determination, management concluded that the acquired assets did
not meet the definition of a business. The Company paid purchase consideration of $98 million, inclusive of transaction costs of $1
million and customary purchase price adjustments. The transaction was funded through a combination of the issuance of 2,249,650
new shares of common stock direct to Crescent Pass and cash consideration of $69 million from the new Term Loan II supported by
the acquired assets. Refer to Notes 11 and 15 for additional information regarding common stock and debt, respectively.
On June 6, 2024 the Company acquired Oaktree’s proportionate working interest in previously completed joint acquisitions. The
Company assessed the acquired assets and determined that this transaction was considered an asset acquisition rather than a business
combination. When making this determination, management concluded that the acquired assets did not meet the definition of a
business. The Company paid purchase consideration of $222 million, inclusive of transaction costs of $2 million and customary
purchase price adjustments. As part of this transaction, the Company assumed Oaktree’s proportionate debt of $133 million associated
with the ABS VI Notes. The Company funded the purchase through a combination of existing and expanded liquidity and issued
approximately $83 million in notes payable to Oaktree. Refer to Note 15 for additional information regarding debt.
During the year ended December 31, 2024, the Company divested certain non-core undeveloped acreage across its operating footprint
for consideration of approximately $59 million. The consideration received exceeded the carrying value of the net assets divested
resulting in a gain on natural gas and oil properties and equipment of $26 million.
Tanos Energy Holdings II LLC (“Tanos II”) Asset Acquisition
On March 1, 2023 the Company acquired certain upstream assets and related infrastructure in the Central Region from Tanos II. Given
the concentration of assets, this transaction was considered an asset acquisition rather than a business combination. When making this
determination management performed an asset concentration test considering the fair value of the acquired assets. The Company paid
purchase consideration of $262 million, inclusive of transaction costs of $1 million and customary purchase price adjustments. The
Company funded the purchase with proceeds from the February 2023 equity raise, cash on hand and existing availability on the Credit
Facility for which the borrowing base was upsized concurrent to the closing of the Tanos II transaction. Refer to Notes 11 and 15 for
additional information regarding the Company’s common stock and borrowings.
71
Diversified Energy Company |
Sale of Equity Interest in DP Lion Equity HoldCo LLC
In November 2023, the Company formed DP Lion Equity Holdco LLC, a limited-purpose, bankruptcy-remote, wholly-owned
subsidiary, to issue Class A and Class B asset-backed securities (collectively “ABS VII”) which are secured by certain upstream
producing assets in Appalachia. The Class A and B asset backed securities were issued in aggregate principal amounts of $142 million
and $20 million, respectively.
In December 2023, the Company divested 80 % of the equity ownership in DP Lion Equity Holdco LLC to outside investors,
generating cash proceeds of $30 million. The Company evaluated the remaining 20 % interest in DP Lion Equity Holdco LLC and
determined that the governance structure is such that the Company does not have the ability to exercise control, joint control, or
significant influence over the DP Lion Equity Holdco LLC entity. Accordingly, this entity is not consolidated within the Company’s
financial statements.
The consideration exceeded the fair value of the Company’s portion of the assets and liabilities divested resulting in a gain on sale of
the equity interest of $11 million. The Company’s remaining investment in the LLC is accounted for by applying the measurement
alternative under ASC 321, based on which the investment is recorded at cost less any impairment amount, if applicable.
Other 2023 Divestitures
On June 27, 2023, the Company sold certain non-core, non-operated assets within its Central Region for consideration of
approximately $38 million. The divested assets were located in Texas and Oklahoma and consisted of non-operated wells and the
associated leasehold acreage that was acquired as part of the asset acquisition from ConocoPhillips in September 2022.
Additionally, during the year ended December 31, 2023, the Company divested certain non-core undeveloped acreage across its
operating footprint for net consideration of approximately $28 million. The consideration received exceeded the fair value of the net
assets divested resulting in a gain on natural gas and oil properties and equipment of $24 million.
The Company files a consolidated U.S. federal tax return, multiple state tax returns, and a separate UK tax return for Diversified
Energy Company PLC, the former parent company, which will file its final tax return for 2025. Income taxes are provided for the tax
effects of transactions reported in the Consolidated Financial Statements and consist of taxes currently due, plus deferred taxes related
to differences between the basis of assets and liabilities for financial and income tax reporting.
The effective tax rate for December 31, 2025 and 2024 were primarily influenced by the recognition of the federal marginal well tax
credit available to qualified producers. The effective tax rate for December 31, 2023 was primarily impacted by changes in state taxes
due to acquisitions and recurring permanent differences.
For the years ended December 31, 2025, 2024, and 2023, the Company reported tax benefit of $41 million, a benefit of $145 million,
and an expense of $239 million, respectively. The effective tax rate for the year ended December 31, 2025 was (13.5 )%, compared to
Marginal well tax credits are offered by the federal government to incentivize companies to maintain production from wells with
lower output, especially during periods of subdued prices, ensuring the continuation of jobs and the generation of state and local taxes
that fund schools, social programs, police, and other vital public services. Internal Revenue Code Section 45I outlines the criteria for
these credits, which are designated for qualifying natural gas output from specific wells. Wells producing under 90 Mcfe daily benefit
from these incentives when natural gas prices in the preceding tax year are comparatively low. The Company has received these
credits due to its collection of conventional wells known for their longevity and slow production decline. These credits were available
for 2025 and 2024 based on commodity pricing in the 2024 and 2023 calendar years, respectively, but were not available for 2023
based on commodity pricing in 2022. The Company utilizes these credits on a first in, first out basis.
72
Diversified Energy Company |
For the Year Ended December 31, | |||
(in thousands) | 2025 | 2024 | 2023 |
Current income tax benefit (expense) | |||
Federal benefit (expense) | $( | $ | $( |
State benefit (expense) | ( | ( | ( |
Foreign - UK benefit (expense) | ( | ||
Total current income tax benefit (expense) | $( | $ | $( |
Deferred income tax benefit (expense) | |||
Federal benefit (expense) | $ | $ | $( |
State benefit (expense) | ( | ( | |
Foreign - UK benefit (expense) | |||
Total deferred income tax benefit (expense) | $ | $ | $( |
Total income tax benefit (expense) | $ | $ | $( |
follows:
For the Year Ended December 31, | |||
(in thousands) | 2025 | 2024 | 2023 |
Income (loss) before taxation | $ | $( | $ |
Income tax benefit (expense) | ( | ||
Effective tax rate | ( | ||
For the Year Ended December 31, | ||||||
(in thousands) | 2025 | 2024 | 2023 | |||
U.S. federal statutory tax rates | $( | $ | $( | |||
State and local income tax, net of federal (national) income tax effect | ( | ( | ||||
Foreign tax effects | ||||||
Statutory tax rate difference between United Kingdom and United States | ( | ( | ( | ( | ||
Equity in earnings of foreign subsidiary | ( | ( | ( | ( | ||
Nontaxable dividend income | ( | ( | ||||
Other foreign tax effects | ( | ( | ( | ( | ||
Tax credits | ||||||
Marginal well credits | ( | |||||
Changes in valuation allowances | ( | |||||
Nontaxable or nondeductible items | ||||||
Other nondeductible items | ( | ( | ( | ( | ||
Other adjustments | ||||||
Other adjustments to deferred taxes | ( | ( | ( | ( | ||
Income tax benefit (expense) / Effective tax rate(a) | $ | ( | $ | $( | ||
(a)The impact and the presentation of the federal tax credits on our effective tax rate can be positive or negative based on the
Company’s annual pre-tax income or loss.
at December 31, 2024. This change was primarily due to the recognition of marginal well credits. The balance sheet presentation
considers the offsetting of deferred tax assets and liabilities within the same tax jurisdiction, where permitted. The overall deferred tax
position in a particular tax jurisdiction determines if a deferred tax balance related to that jurisdiction is presented within deferred tax
assets or liabilities.
73
Diversified Energy Company |
State and local income taxes are more than 50% comprised of Oklahoma.
periods presented:
As of December 31, | ||
(in thousands) | December 31, 2025 | December 31, 2024 |
Deferred tax asset | ||
Asset retirement obligations | $ | $ |
Derivatives | ||
Allowance for doubtful accounts | ||
Net operating loss carryover | ||
Valuation allowance | ( | |
Federal tax credits carryover | ||
Investment in partnerships | ||
163(j) interest expense limitation | ||
Other | ||
Total deferred tax asset | $ | $ |
Deferred tax liability | ||
Amortization and depreciation | $( | $( |
Investment in partnerships | ( | |
Other | ( | ( |
Total deferred tax liability | $( | $( |
Net deferred tax asset (liability) | $ | $ |
Balance sheet presentation | ||
Deferred tax asset | $ | $ |
Deferred tax liability | ( | ( |
Net deferred tax asset (liability) | $ | $ |
In assessing the realizability of deferred tax assets, the Company considers whether it is probable that some or all of the deferred tax
assets will not be realized. The ultimate realization of deferred tax assets depends on generating future taxable income during the
periods in which those temporary differences become deductible or before credits expire. The Company evaluates the scheduled
reversal of deferred tax liabilities, projected future taxable income, and tax planning strategies in making this assessment. At this time,
the Company has determined it will have sufficient future taxable income to recognize its deferred tax assets.
The Company’s deferred tax assets and liabilities all originate in the U.S.
For U.S. federal tax purposes, the Company is taxed as a single consolidated entity. The Company’s co-investments with Oaktree and
its investment in the Chesapeake Granite Wash Trust are taxed as partnerships that pass through to the Company’s consolidated return.
The Company is also subject to additional taxes in its previously domiciled jurisdiction of the UK. For the years ended December 31,
2025, 2024, and 2023, the Company incurred a expense of zero , $0.2 million, and zero in the UK, respectively.
The Organization for Economic Cooperation and Development (“OECD”) has proposed model rules for a global minimum tax of 15%
of reported profits (“Pillar Two”) that has been agreed upon in principle by over 140 countries. While the U.S. has not yet enacted
rules implementing Pillar Two, the U.K. has. This is relevant to the Company as it is resident in the U.K. for corporation tax purposes.
The Finance (No. 2) Act 2023 (the “UK Act”) was enacted on July 11, 2023, and implements the OECD’s Base Erosion & Profit
Shifting (“BEPS”) Pillar Two Income Inclusion Rule and a ‘Qualifying Domestic Minimum Top-up Tax’ for accounting periods
beginning on or after December 31, 2023. The UK Act also includes a transitional safe harbor election for accounting periods
beginning on or before December 31, 2026. Although the Pillar Two rules can lead to additional taxes, including taxes on our profits
in the U.S., the Company anticipates qualifying for a transitional safe harbor under the Pillar Two rules. We have undertaken an initial
assessment, and evaluated the impact of these rules, and currently the Company believes it will not have a material impact on its
financial position, results of operations, or cash flows due to the availability of a transitional safe harbor for the year ended December
31, 2025.
The Company had no
74
Diversified Energy Company |
As of December 31, 2025, the Company had U.S. federal net operating loss carryforwards (“NOLs”) of approximately $105 million
after any subject limitations. Additionally, the Company had $109 million U.S. state NOLs.
The Company had U.S. marginal well tax credit carryforwards of approximately $332 million as of December 31, 2025, compared to
$234 million and $163 million as of December 31, 2024 and 2023, respectively. As discussed earlier, marginal well tax credits are
intended to benefit wells producing less than 90 Mcfe per day when market prices for natural gas are relatively low. Due to the low
commodity price environment in 2024, the Company generated federal tax credits of $106,319 for the year ended December 31, 2025.
These tax credits expire between 2040 and 2045.
The Company had no U.S. federal capital loss carryforwards as of December 31, 2025, compared to $14 million and none as of
December 31, 2024 and 2023, respectively. For the year ended December 31, 2025, no capital loss carryforwards expired. The
Company utilized all existing capital loss carryforward in the amount of $14 million in 2025.
The Company completed a Section 382 study through December 31, 2025 in accordance with the Internal Revenue Code of 1986, as
amended. The study concluded that the Company has not experienced an ownership change since the last ownership change on
January 31, 2018. If the Company experiences an ownership change, tax credit carryforwards can be utilized but are limited each year
and could expire before being fully utilized.
The Company is subject to examination by the IRS for tax years 2022 through 2024.
For the Year Ended | |
(in thousands) | December 31, 2025 |
Cash paid (received) for income taxes, net of refunds | |
Federal income taxes | $ |
State income taxes: | |
Oklahoma | |
West Virginia | |
Other | |
State income taxes | |
Total cash paid (received) for income taxes, net of refunds | $ |
(a)Cash paid for income taxes, net of refunds, during the years ended December 31, 2024 and 2023, were $11 million and $8
million, respectively.
Basic earnings (loss) per share (“EPS”) is calculated by dividing net income (loss) attributable to common shareholders by the
weighted average number of shares of common stock outstanding during the period, excluding shares held in treasury (if any) and the
Employee Benefit Trust (“EBT”). Diluted EPS reflects the potential dilution that could occur if share-based compensation awards
were exercised or converted into shares, except when their effect would be anti-dilutive. Refer to Note 11 for additional information
regarding the EBT.
the periods presented:
For the Year Ended December 31, | |||
(in thousands, except share and per share data) | 2025 | 2024 | 2023 |
Net income (loss) attributable to DEC | $ | $( | $ |
Weighted average shares outstanding - basic | |||
Dilutive impact of potential shares | |||
Weighted average shares outstanding - diluted | |||
Basic earnings (loss) per share | $ | $( | $ |
Diluted earnings (loss) per share | $ | $( | $ |
Potentially dilutive shares(a) | |||
75
Diversified Energy Company |
(a)Share-based compensation awards excluded from the diluted EPS calculation because their effect would have been anti-dilutive.
For the Year Ended December 31, | |||
(in thousands) | 2025 | 2024 | 2023 |
Costs | |||
Beginning balance | $ | $ | $ |
Additions(a) | |||
Disposals(b) | ( | ( | ( |
Ending balance | $ | $ | $ |
Depletion and impairment | |||
Beginning balance | $( | $( | $( |
Depletion expense | ( | ( | ( |
Ending balance | $( | $( | $( |
Net book value | $ | $ | $ |
(a)For the year ended December 31, 2025, the Company added $1.9 billion from acquisitions. The remaining changes were
primarily due to development and recurring capital expenditures. In 2024, the Company added $608 million from acquisitions.
The remaining changes were primarily due to recurring capital expenditures. In 2023, the Company added $266 million from
acquisitions. The remaining changes were primarily due to recurring capital expenditures.
(b)For the year ended December 31, 2025, the Company divested $65 million in undeveloped acreage. In 2024, the Company
divested $33 million in undeveloped acreage. In 2023, the Company divested $203 million in natural gas and oil properties
related to the sale of equity interest in DP Lion Equity Holdco LLC and other proved properties and undeveloped acreage
divestitures.
Refer to Note 3 for additional information regarding acquisitions and divestitures.
For the Year Ended December 31, 2025 | ||||||
(in thousands) | Buildings and Leasehold Improvements | Equipment | Motor Vehicles | Midstream Assets | Other Property and Equipment | Total |
Costs | ||||||
Beginning balance | $ | $ | $ | $ | $ | $ |
Additions(a) | ||||||
Disposals | ( | ( | ( | ( | ( | ( |
Ending balance | $ | $ | $ | $ | $ | $ |
Accumulated depreciation | ||||||
Beginning balance | $( | $( | $( | $( | $( | $( |
Period changes | ( | ( | ( | ( | ( | ( |
Disposals | ||||||
Ending balance | $( | $( | $( | $( | $( | $( |
Net book value | $ | $ | $ | $ | $ | $ |
(a)Of the $86 million in additions for 2025, $61 million was related to acquisitions. Refer to Note 3 for additional information
regarding acquisitions. The remaining additions were related to routine capital projects on the Company’s compressor and
gathering systems, as well as vehicle and equipment additions.
76
Diversified Energy Company |
For the Year Ended December 31, 2024 | ||||||
(in thousands) | Buildings and Leasehold Improvements | Equipment | Motor Vehicles | Midstream Assets | Other Property and Equipment | Total |
Costs | ||||||
Beginning balance | $ | $ | $ | $ | $ | $ |
Additions(a) | ||||||
Disposals | ( | ( | ( | ( | ( | ( |
Ending balance | $ | $ | $ | $ | $ | $ |
Accumulated depreciation | ||||||
Beginning balance | $( | $( | $( | $( | $( | $( |
Period changes | ( | ( | ( | ( | ( | ( |
Disposals | ||||||
Ending balance | $( | $( | $( | $( | $( | $( |
Net book value | $ | $ | $ | $ | $ | $ |
(a)Of the $33 million in additions for 2024, $2 million was related to acquisitions. Refer to Note 3 for additional information
regarding acquisitions. The remaining additions were related to routine capital projects on the Company’s compressor and
gathering systems, as well as vehicle and equipment additions.
For the Year Ended December 31, 2023 | ||||||
(in thousands) | Buildings and Leasehold Improvements | Equipment | Motor Vehicles | Midstream Assets | Other Property and Equipment | Total |
Costs | ||||||
Beginning balance | $ | $ | $ | $ | $ | $ |
Additions(a) | ||||||
Disposals | ( | ( | ( | ( | ( | |
Ending balance | $ | $ | $ | $ | $ | $ |
Accumulated depreciation | ||||||
Beginning balance | $( | $( | $( | $( | $( | $( |
Period changes | ( | ( | ( | ( | ( | ( |
Disposals | ||||||
Ending balance | $( | $( | $( | $( | $( | $( |
Net book value | $ | $ | $ | $ | $ | $ |
(a)Of the $40 million in additions for 2023, $0.2 million was related to acquisitions. Refer to Note 3 for additional information
regarding acquisitions. The remaining additions were related to routine capital projects on the Company’s compressor and
gathering systems, as well as vehicle and equipment additions.
The Company continued to utilize certain fully depreciated assets during the years ended December 31, 2025, 2024 and 2023 with an
original cost basis of $38 million, $29 million and $7 million, respectively.
The Company faces volatility in market prices and basis differentials for natural gas, NGLs and oil, affecting the predictability of its
cash flows from commodity sales. Additionally, the Company’s cash flows related to interest payments on variable rate debt
obligations can be impacted by fluctuations in interest rate markets, depending on its debt structure. To manage these risks, the
Company enters into derivative contracts primarily with major financial institutions and energy trading counterparties. As of
December 31, 2025, these instruments included swaps, collars, basis swaps, and stand-alone put and call options. The Company does
not intend to hold or issue derivative financial instruments for speculative trading purposes and has elected not to designate any of its
derivative instruments for hedge accounting treatment. Below is a description of these instruments:
Swaps: | When the Company sells a swap, it agrees to receive a fixed price for the contract while paying a floating market price to the counterparty; |
77
Diversified Energy Company |
Collars: | Arrangements that include a fixed floor price (purchased put option) and a fixed ceiling price (sold call option) based on an index price have no net costs overall. At the contract settlement date, (1) when the index price is higher than the ceiling price, the Company pays the counterparty the difference between the index price and ceiling price, (2) when the index price is between the floor and ceiling prices, no payments are due from either party, and (3) when the index price is below the floor price, the Company will receive the difference between the floor price and the index price. Some collar arrangements may also include a sold put option with a strike price below the purchased put option. Known as a three-way collar, the structure operates similarly to the standard collar. However, when the index price settles below the sold put option, the Company pays the counterparty the difference between the index price and sold put option, effectively enhancing realized pricing by the difference between the price of the sold and purchased put options; |
Basis swaps: | Arrangements that guarantee a price differential for commodities from a specified delivery point. When the Company sells a basis swap, it receives a payment from the counterparty if the price differential exceeds the stated terms of the contract. Conversely, if the price differential is less than the stated terms, the Company pays the counterparty; |
Put options: | The Company purchases and sells put options in exchange for a premium. When the Company purchases a put option, it receives from the counterparty the excess amount (if any) by which the market price falls below the strike price of the put option at the time of settlement. If the market price is above the put option’s strike price, no payment is required from either party. Conversely, when the Company sells a put option, it pays the counterparty the excess amount (if any) by which the market price falls below the strike price of the put option at the time of settlement. If the market price is above the put option’s strike price, no payment is required from either party; |
Call options: | The Company purchases and sells call options in exchange for a premium. When the Company purchases a call option, it receives from the counterparty the excess amount (if any) by which the market price exceeds the strike price of the call option at the time of settlement. If the market price is below the call option’s strike price, no payment is required from either party. When the Company sells a call option, it pays the counterparty the excess amount (if any) by which the market price exceeds the strike price of the call option at the time of settlement. If the market price is below the call option’s strike price, no payment is required from either party; and |
The Company may elect to enter into offsetting transactions for the above instruments for the purpose of cancelling or terminating
certain positions.
78
Diversified Energy Company |
As of December 31, 2025 | ||
(in thousands, except volume data) | Volume | Fair Value |
Natural gas (Mmbtu) | ||
Swaps | $( | |
Two-way collars | ||
Three-way collars | ( | |
Stand-alone calls(a) | ( | |
Basis swaps | ( | |
Purchased puts | ||
Sold puts | ( | |
Total natural gas | $( | |
NGLs (MBbls) | ||
Swaps | $ | |
Stand-alone calls | ( | |
Total NGLs | $ | |
Oil (MBbls) | ||
Swaps | $ | |
Three-way collars | ||
Sold calls | ( | |
Total oil | $ | |
Interest | ||
SOFR interest rate swap ($ | $ | |
Total interest | $ | |
Total fair value of derivatives | $( | |
arrangement. The Company elected to present these derivative assets and liabilities on a net basis when these conditions are satisfied.
(in thousands) | As of December 31, | ||
Derivatives | Consolidated Statement of Financial Position | 2025 | 2024 |
Assets: | |||
Current assets | Derivatives | ||
Noncurrent assets | Other assets | $ | $ |
Total assets | $ | $ | |
Liabilities | |||
Current liabilities | Derivatives | ( | ( |
Noncurrent liabilities | Derivatives | $( | $( |
Total liabilities | $( | $( | |
Net assets (liabilities): | |||
Net assets (liabilities) - current | Derivatives | $( | $( |
Net assets (liabilities) - noncurrent | Other assets / Derivatives | ( | ( |
Total net assets (liabilities) | $( | $( | |
79
Diversified Energy Company |
The Company presents the fair value of derivative contracts on a net basis in the Consolidated Statement of Financial Position. Below
is the impact of this presentation on the Company’s recognized assets and liabilities for the specified periods:
As of December 31, 2025 | |||
(in thousands) | Presented without Effects of Netting | Effects of Netting | As Presented with Effects of Netting |
Current assets | $ | $( | $ |
Noncurrent assets | ( | ||
Total assets | $ | $( | $ |
Current liabilities | ( | ( | |
Noncurrent liabilities | ( | ( | |
Total liabilities | $( | $ | $( |
Total net assets (liabilities) | $( | $— | $( |
As of December 31, 2024 | |||
(in thousands) | Presented without Effects of Netting | Effects of Netting | As Presented with Effects of Netting |
Current assets | $ | $( | $ |
Noncurrent assets | ( | ||
Total assets | $ | $( | $ |
Current liabilities | ( | ( | |
Noncurrent liabilities | ( | ( | |
Total liabilities | $( | $ | $( |
Total net assets (liabilities) | $( | $— | $( |
periods:
For the Year Ended December 31, | |||
(in thousands) | 2025 | 2024 | 2023 |
Net gain (loss) on commodity derivatives settlements | $ | $ | $ |
Net gain (loss) on interest rate swaps | ( | ||
Gain (loss) on foreign currency hedges | ( | ||
Total gain (loss) on settled derivatives(a) | $ | $ | $ |
Gain (loss) on fair value adjustments of unsettled derivatives(b) | ( | ||
Total gain (loss) on derivatives | $ | $( | $ |
(a)Represents the cash settlement of derivatives that were settled during the period.
(b)Represents the change in fair value of derivatives, net of the carrying value of derivatives that were settled during the period.
All derivatives are classified as Level 2 instruments under ASC 820, as their valuation relies on observable market inputs other than
quoted prices.
Occasionally, such as during the acquisition of producing assets, the completion of ABS financings, or in response to fluctuating price
environments, the Company may strategically modify, offset, terminate, or expand certain existing hedge positions. These
modifications can involve changes to the volume of production covered by contracts, the swap or strike price of specific derivative
contracts, and other similar aspects of the derivative agreements. The Company manages distinct, long-dated derivative contract
portfolios for its ABS financings and Term Loans. Additionally, the Company maintains a separate derivative contract portfolio for
assets secured by the Credit Facility. These derivative contract portfolios associated with the Company’s ABS financings, Term
Loans, and Credit Facility are presented in the Company’s Statement of Financial Position.
80
Diversified Energy Company |
In February 2025, the Company adjusted portions of its commodity derivative portfolio across its legal entities for approximately
$150 million in connection with the completion of the ABS X financing arrangement. The Company made further adjustments to its
commodity derivative portfolio for approximately $21 million for the retirement of the ABS I and Term Loan I financing
arrangements.
The Company made no modifications in 2024.
In February 2023, the Company sold puts in ABS III for approximately $9 million and replaced them with swaps to maintain the
appropriate level and composition of derivatives at both the legal entity and full-company level. In August 2023, the Company
monetized $9 million in purchased puts associated with its ABS hedge books and transitioned the monetized positions into long-dated
swap agreements. The Company also monetized an additional $8 million in net modifications, primarily comprised of swap
terminations. As these modifications were made in the normal course of business for the year ended December 31, 2023, they are
presented as an operating activity in the Consolidated Statement of Cash Flows.
In November 2023, the Company adjusted portions of its commodity derivative portfolio across its legal entities to ensure that it
maintained the appropriate level and composition at both the legal entity and full-Company level for the completion of the ABS VII
financing arrangement. These portfolio adjustments included novations of certain contracts to the legal entities holding the ABS VII
Notes. The Company paid $6 million for these portfolio adjustments. As these modifications were associated with a borrowing
transaction, these amounts are presented as a financing activity in the Consolidated Statement of Cash Flows. Refer to Note 15 for
additional information regarding ABS financing arrangements.
Accounts receivable include amounts due from customers, entities that purchase the Company’s natural gas, NGLs and oil production,
as well as amounts due from joint interest owners who hold a working interest in the properties operated by the Company. Most of
these accounts receivable are current, and the Company is confident in their collectability. The table below provides a summary of the
Company’s accounts receivable. The fair value approximates the carrying value as of the periods presented:
As of December 31, | ||
(in thousands) | 2025 | 2024 |
Commodity receivables(a) | $ | $ |
Other receivables(b) | ||
Total accounts receivable | $ | $ |
Allowance for credit losses(c) | ( | ( |
Accounts receivable, net | $ | $ |
(a)Includes accrued revenues.
(b)Predominantly comprised of joint interest owner receivables.
(c)The allowance for credit losses mainly pertains to amounts owed by joint interest owners. During the year ended December 31,
2025, the allowance for credit losses increased by $20 million, primarily due to acquired balances from the Maverick and Canvas
81
Diversified Energy Company |
As of December 31, | ||
(in thousands) | 2025 | 2024 |
Prepaid expenses and other current assets | ||
Prepaid expenses | $ | $ |
Inventory | ||
Total prepaid expenses and other current assets | $ | $ |
Other noncurrent assets | ||
Intangibles | $ | $ |
Operating right of use assets | ||
Financing right of use assets | ||
Derivatives | ||
Other noncurrent assets(a) | ||
Total other noncurrent assets | $ | $ |
(a)Includes the Company’s investment in DP Lion Equity Holdco LLC of $10 million and $6 million as of December 31, 2025 and
2024, respectively. Refer to Notes 3 and 15 for additional information regarding the DP Lion Equity Holdco LLC equity sale.
The Company is authorized to issue up to 350,000,000 0.01
and 2024, the Company had 76,979,625 50,649,844
The Company is authorized to issue 30,000,000 shares of preferred stock, par value $0.01 per share. No
issued or are outstanding.
In November 2025, the Company completed the U.S. Domestication, whereby existing shares of Diversified Energy Company PLC
were exchanged on a one -for-one basis for newly issued shares of corresponding common stock of Diversified Energy Company, and
all issued and outstanding equity awards of Diversified Energy Company PLC were assumed by Diversified Energy Company and
were converted into rights to acquire Diversified Energy Company shares of common stock on the same terms. As a result of the U.S.
Domestication, the par value of the Company’s common stock was changed from £0.20 to $0.01 . The impact of this change is
reflected within U.S. Domestication in the Statements of Changes in Equity.
In November 2025, the Company issued 3,718,209 new shares of common stock direct to Canvas shareholders to fund a portion of the
Canvas transaction. The total value of the stock consideration was $54 million based on the Company’s stock price on the NYSE on
the closing date of the Canvas transaction.
In March 2025, the Company announced the completion of its previously announced acquisition of Maverick. The transaction was
funded in part through the issuance of 21,194,213 new shares of common stock direct to the unitholders of Maverick. The total value
of the stock consideration was $253 million, excluding transaction costs of $0.4 million, based on the Company’s NYSE stock price
on the closing date of the Maverick transaction.
In February 2025, the Company issued 8,500,000 new shares of common stock at $14.50 per share to raise gross proceeds of $123
million, excluding transaction costs of $6 million. The Company used the net proceeds to repay a portion of the debt incurred in
connection with the Maverick acquisition.
In October 2024, the Company issued 2,342,445 new shares of common stock direct to the Seller to fund a portion of the East Texas II
transaction. The total value of the stock consideration was $27 million based on the Company’s NYSE stock price on the closing date
of the East Texas II transaction.
In August 2024, the Company issued 2,249,650 new shares of common stock direct to Crescent Pass to fund a portion of the Crescent
Pass transaction. The total value of the stock consideration was $28 million based on the Company’s NYSE stock price on the closing
date of the Crescent Pass transaction.
In February 2023, the Company issued 6,422,200 new shares of common stock at $25.34 per share to raise gross proceeds of $163
million. Associated costs of the offering were $6 million. The Company used the proceeds to fund the Tanos II transaction.
For further details related to acquisitions, refer to Note 3 .
82
Diversified Energy Company |
The Company’s holdings in its own equity instruments are classified as treasury stock. The consideration paid, along with any directly
attributable incremental costs, is deducted from the Company’s stockholders’ equity until the shares are either cancelled or reissued.
No gain or loss is recognized in the Consolidated Statements of Comprehensive Income (Loss) upon the purchase, sale, issuance, or
cancellation of treasury stock.
In March 2022, the Company established the EBT to benefit its employees. The Company provides funding to the EBT to facilitate the
acquisition of shares. These shares are held in the EBT to fulfill awards and grants under the Company’s 2017 and 2025 Equity
Incentive Plans and the Employee Share Purchase Plan (the “ESPP”). Shares held in the EBT are treated in the same manner as
treasury stock and are thus included in the Consolidated Financial Statements as treasury stock. During the years ended December 31,
2025 and 2024, 1,657,000 and 418,151 shares were acquired by the EBT for approximately $23 million and $5 million, respectively.
As of December 31, 2025, the EBT held a total of 2,048,703 shares. For further details related to share-based compensation, refer to
Note 12 .
During the year ended December 31, 2025, the Company repurchased 5,680,036 shares of common stock at an average price of $13.65
per share, amounting to a total of $78 million and representing 7 % of common stock issued and outstanding as of December 31, 2025.
During the year ended December 31, 2024, the Company repurchased 1,219,879 shares of common stock at an average price of $13.03
per share, amounting to a total of $16 million and representing 2 % of common stock issued and outstanding as of December 31, 2024.
During the year ended December 31, 2023, the Company repurchased 646,762 shares of common stock at an average price of $17.08
per share, amounting to a total of $11 million and representing 1 % of common stock issued and outstanding as of December 31, 2023.
The Company has recorded the repurchase of these shares of common stock as a reduction in common stock and additional paid in
capital. All repurchased shares of common stock were cancelled upon repurchase. As of December 31, 2025 and 2024, the par value of
the cancelled shares was retired from common stock in the Consolidated Balance Sheets.
Dividends are declared at the discretion of the Board of Directors and are subject to applicable law and contractual restrictions.
Dividends are paid to holders of record as of the record date. Dividends are waived on shares held in the EBT.
In November 2024, the Company’s board of directors declared a cash dividend on the Company’s common stock in the amount of
$0.29 per share. The dividend was paid on March 31, 2025 to stockholders of record as of the close of business on February 28, 2025.
In April 2025, the Company’s board of directors declared a cash dividend on the Company’s common stock in the amount of $0.29
per share. The dividend was paid on June 30, 2025 to stockholders of record as of the close of business on May 30, 2025.
In May 2025, the Company’s board of directors declared a cash dividend on the Company’s common stock in the amount of $0.29 per
share. The dividend was paid on September 30, 2025 to stockholders of record as of the close of business on August 29, 2025.
In August 2025, the Company’s board of directors declared a cash dividend on the Company’s common stock in the amount of $0.29
per share. The dividend was paid on December 31, 2025 to stockholders of record as of the close of business on December 1, 2025.
In November 2025, the Company’s board of directors declared a cash dividend on the Company’s common stock in the amount of
$0.29 per share. The dividend is payable on March 31, 2026, to stockholders on record as of the close of business on February 27,
2026.
The Company’s ability to pay dividends is subject to certain restrictions under its Credit Facility and other debt agreements, which
may limit dividend payments based on leverage ratios and other financial covenants. Refer to Note 15 for additional information.
The 2017 Equity Incentive Plan (the “2017 Plan”), as amended through April 9, 2025, authorized and reserved for issuance up to 10 %
of the Company’s shares of common stock outstanding, which may be issued upon exercise of vested options or the vesting of RSUs,
PSUs and dividend equivalent units (“DEUs”) that were granted under the Plan. As of November 21, 2025, 3,947,882 shares were
subject to awards outstanding under the 2017 Plan.
On November 21, 2025, the Company adopted the 2025 Equity Incentive Plan (the “2025 Plan”). The 2025 Plan authorized and
reserved for issuance a total of 6,892,551 2,944,669 shares of common stock plus the 3,947,882
shares of common stock subject to awards outstanding under the 2017 Plan as of November 21, 2025 that are not issued because such
award is forfeit, canceled, terminates, expires or otherwise lapses, or is settled in cash or withheld by the Company in satisfaction of
83
Diversified Energy Company |
the exercise price or tax withholding obligations. As of December 31, 2025, there were 2,889,420 shares of common stock available
for grant under the 2025 Plan.
Upon adoption of the 2025 Plan, no new awards may be granted under the 2017 Plan, and any shares that were previously authorized
and reserved for issuance under the 2017 Plan, but not subject to outstanding awards as of November 21, 2025, are no longer available
for grant. Only shares underlying outstanding awards under the 2017 Plan as of that date may be issued if and when those awards vest
or are exercised. All future equity awards will be made exclusively under the 2025 Plan.
As of December 31, 2025, 2024 and 2023, the number of options outstanding had no
December 31, 2023, the weighted average exercise price at exercise was $29.86 . No
December 31, 2025 and 2024. As of December 31, 2025, 2024 and 2023, 139,794 , 153,631 and 162,108 Options were exercisable,
respectively. As of December 31, 2025, 2024 and 2023, the weighted average remaining contractual life in years was 2.4 , 3.4 , and 4.6 ,
respectively. As of December 31, 2025, the Company had no unrecognized share-based compensation expense related to stock
options.
Number of Shares | Weighted Average Grant Date Fair Value per Share | |
Balance as of December 31, 2024 | $ | |
Granted | ||
Vested | ( | |
Forfeited | ( | |
Balance as of December 31, 2025 | $ |
During the years ended December 31, 2025, 2024 and 2023, the aggregate intrinsic value at date of vesting was $1.3 million, $0.8
million, and $3.9 million, respectively. As of December 31, 2025, the Company had $13 million of unrecognized share-based
compensation expense related to RSUs that will be recognized over a weighted average period of 1.7 years.
RSUs can vest either on a cliff basis or ratably, depending on the service conditions. The fair value of the Company’s RSUs is
calculated using the closing price of our common stock on the NYSE at the grant date. This value is then expensed uniformly over the
vesting period.
presented:
Number of Shares | Weighted Average Grant Date Fair Value per Share | |
Balance as of December 31, 2024 | $ | |
Granted | ||
Vested | ( | |
Forfeited | ( | |
Balance as of December 31, 2025 | $ |
During the years ended December 31, 2025, 2024 and 2023, the aggregate intrinsic value at date of vesting was $1.4 million, $0.4
million, and $4.9 million, respectively. As of December 31, 2025, the Company had $5 million of unrecognized share-based
compensation expense related to PSUs that will be recognized over a weighted average period of 1.4 years.
PSUs are subject to cliff vesting based on specific performance criteria evaluated over a three-year period. These criteria include
average adjusted return on equity over three years , measured against pre-established benchmarks. Additionally, the Company’s three-
include the three-year average growth in free cash flow and the reduction in methane intensity over the same period. Depending on the
achievement of these performance targets, the number of units that will vest can vary from 0 % to 100 % of the initial award.
84
Diversified Energy Company |
value is then expensed uniformly over the vesting period. For PSUs granted during the respective periods presented, the inputs to the
Monte Carlo model included the following:
For the Year Ended December 31, | |||
2025 | 2024 | 2023 | |
Risk-free rate of interest | |||
Volatility(a) | |||
Correlation with comparator group range | |||
(a)Volatility utilizes the historical volatility for the Company’s share price.
The Employee Stock Purchase Plan (the “ESPP”), implemented in February 2023, authorized and reserved for issuance 300,000
shares of common stock.
During the year ended December 31, 2025, 40,932 shares were purchased by and issued to ESPP participants. During the year ended
December 31, 2024, 41,330 shares were purchased by and issued to ESPP participants. As of December 31, 2025, 202,606 shares
remain available to be purchased. As of December 31, 2025, the Company had no unrecognized share-based compensation expense
related to the ESPP.
For the Year Ended December 31, | |||
(in thousands) | 2025 | 2024 | 2023 |
Options | $ | $ | $ |
RSUs | |||
PSUs | |||
ESPP | |||
Total share-based compensation expense | $ | $ | $ |
The Company has two defined contribution plans (“401(k) Plans”) that are subject to the Employee Retirement Income Security Act
of 1974 (“ERISA”). Both 401(k) Plans allows eligible employees to contribute up to 100 % of their base salaries, up to the contribution
limits established under the Internal Revenue Code (“IRC”).
Employee Savings Plan
The Company makes a safe-harbor matching contribution equal to 100 % of salary deferrals that do not exceed 7 % of compensation.
The Company’s matching contributions to this 401(k) Plan for the years ended December 31, 2025, 2024, and 2023 were $9.5 million,
$7.9 million, and $7.2 million, respectively.
Employee Retirement Plan
The Company makes a non-elective safe-harbor contribution equal to 5 % of compensation. In addition, the Company matches 50 % of
employee contributions up to the first 4 % of compensation. The Company’s safe-harbor non-elective contributions to this 401(k) Plan
for the years ended December 31, 2025, 2024, and 2023 were $0.8 million, $0.8 million, and $0.7 million, respectively. The
Company’s matching contributions to this 401(k) Plan for the years ended December 31, 2025, 2024, and 2023 were each $0.3
million.
and oil properties. Additionally, the Company records a liability for the future decommissioning costs of its production facilities and
pipelines when required by contract, statute, or constructive obligation. For the years ended December 31, 2025, 2024 and 2023, no
state contractual agreements or statutes related to production facilities and pipelines are expected to impose material obligations on the
Company.
In estimating the present value of future decommissioning costs for its natural gas and oil properties, the Company considers several
factors, including the number and state jurisdictions of wells, current decommissioning costs by state and well type, and the
85
Diversified Energy Company |
Company’s retirement plan, which is based on state requirements and the Company’s capacity to retire wells over their productive
lives. The Company’s assumptions are grounded in the current economic environment and are believed to provide a reasonable basis
for estimating the future liability. However, actual decommissioning costs will ultimately depend on future market prices at the time
the decommissioning services are performed. Additionally, the timing of decommissioning will vary based on when the fields cease to
produce economically, which is influenced by future natural gas and oil prices and the retirement schedule. These factors are
inherently uncertain.
The Company incorporates annual inflationary cost increases into its current cost expectations and then discounts the resulting cash
For the Year Ended December 31, | |||
(in thousands) | 2025 | 2024 | 2023 |
Balance at beginning of period | $ | $ | $ |
Additions(a) | |||
Accretion expense | |||
Asset retirement costs | ( | ( | ( |
Disposals(b) | ( | ||
Revisions(c) | |||
Balance at end of period | $ | $ | $ |
Less: Current asset retirement obligations(d) | |||
Noncurrent asset retirement obligations | $ | $ | $ |
(a)During the year ended December 31, 2025, $180 million and $11 million of additions relate to the Maverick and Canvas
acquisitions, respectively. During the year ended December 31, 2024, $64 million and $34 million of additions relate to the
Oaktree and Crescent Pass acquisitions, respectively. For further details regarding acquisitions, refer to Note 3.
(b)Disposals are related to the divestiture of natural gas and oil properties. For additional information, refer to Note 6.
(c)Revisions primarily represent changes in the present value of liabilities resulting from changes in estimated costs and economic
lives of producing properties.
(d)The increase in current asset retirement obligations is primarily due to an increase in the number of wells expected to be plugged
in the near term.
The Company leases office space, vehicles, and equipment under non-cancelable operating and finance leases. Lease terms generally
range from one to six years and may include renewal or termination options. The Company does not have any material subleases,
purchase options, or residual value guarantees. The Company recognizes right-of-use (“ROU”) assets and lease liabilities on the
Consolidated Balance Sheets for all leases with lease terms of greater than one year. Short-term leases that have an initial term of one
year or less are not capitalized.
Short-term lease costs represent the expense recognized for leases where the company has elected the short-term lease exemption
under ASC 842. This exemption allows the Company to expense, rather than capitalize, leases with a term of 12 months or less. The
Company’s short-term leases are primarily associated with compressor rentals and have been included in the Company’s operating
expenses, with a significant portion allocated to LOE.
For the Year Ended December 31, | |||
(in thousands) | 2025 | 2024 | 2023 |
Operating lease costs | $ | $ | $ |
Finance lease costs | |||
Amortization of the ROU assets | |||
Interest expense on the lease liabilities | |||
Short-term lease costs | |||
Total lease costs | $ | $ | $ |
86
Diversified Energy Company |
(in thousands) | 2026 | 2027 | 2028 | 2029 | 2030 | Thereafter | Total Future Lease Payments | Less: Imputed Interest | Total Lease Liabilities |
Operating Leases | $ | $ | $ | $ | $ | $ | $ | $ | $ |
Finance Leases |
Operating Leases | Finance Leases | |
Weighted average lease term (years) | ||
Weighted average discount rate |
The Company determines the lease term as the non-cancelable period plus any renewal options reasonably certain to be exercised. The
discount rate used to measure lease liabilities is the rate implicit in the lease, if readily determinable. Otherwise, the Company uses its
incremental borrowing rate at the lease commencement date.
For additional information regarding cash paid for lease liabilities and non-cash right-of-use asset additions, refer to the Supplemental
Cash Flow Information in Note 20.
As of December 31, | ||||||
Instrument | Interest Rate | 2025 | 2024 | |||
Credit Facility | and | respectively)(a) | $ | $ | ||
Term Loan I, due May 2030 | ||||||
Term Loan II, due August 2027 | (a) | |||||
ABS I Note, due January 2037 | ||||||
ABS II Notes, due July 2037 | ||||||
ABS IV Notes, due February 2037 | ||||||
ABS VI Notes, due November 2039 | (b) | |||||
ABS VIII Notes, due May 2044 | ||||||
ABS IX Notes, due September 2044 | ||||||
ABS X Notes, due February 2045 | ||||||
ABS XI Notes, due November 2045 | ||||||
ABS Maverick Notes, due December 2038 | ||||||
Nordic Bonds, due April 2029 | ||||||
Other miscellaneous borrowings(c) | ||||||
Total borrowings | $ | $ | ||||
Less: Current portion of long-term debt | ( | ( | ||||
Less: Deferred financing costs | ( | ( | ||||
Plus: Market premiums | ||||||
Less: Original issue discounts | ( | ( | ||||
Total noncurrent borrowings, net | $ | $ | ||||
(a)Represents the variable interest rate as of period end.
(b)Includes $133 million for the assumption of Oaktree’s proportionate share of the ABS VI debt as part of the Oaktree transaction
as of December 31, 2024. Refer to Note 3 for additional information regarding the Oaktree transaction.
(c)Includes $76 million in notes payable issued as part of the consideration in the Oaktree transaction as of December 31, 2024.
Includes $23 million and $30 million in notes payable issued by a third party financial institution in November 2024,
collateralized by two
Central Region, as of December 31, 2025 and 2024, respectively. Refer to Note 3 for additional information regarding the
Oaktree acquisition.
87
Diversified Energy Company |
The Company maintains a Credit Facility with a lending syndicate, the borrowing base for which is redetermined semi-annually or as
needed. The Company’s wholly owned subsidiary, DP RBL Co LLC, serves as the borrower under the Credit Facility. The borrowing
base is primarily determined by the value of the natural gas and oil properties that serve as collateral for the lending arrangement, and
it may fluctuate due to changes in collateral, which can result from acquisitions or the establishment of ABS, term loans, or other
lending structures.
In March 2025, in connection with the close of the Maverick acquisition, the Company amended and restated the credit agreement
governing its Credit Facility. The amendment and restatement extended the maturity of the Credit Facility to March 2029 and
increased the borrowing base to $900 million, primarily resulting from the additional collateral acquired in the Maverick acquisition.
The Company utilized the proceeds from the upsized borrowing base to fund a portion of the Maverick acquisition and repay the
outstanding principal on Term Loan II. Refer to Note 3 for additional information regarding acquisitions. During the semi-annual
redetermination in October 2025, the borrowing base was reduced to $825 million.
The Credit Facility has an interest rate of SOFR plus an additional spread ranging from 2.75 % to 3.75 % based on utilization. Interest
payments on the Credit Facility are paid on a quarterly basis. Available borrowings under the Credit Facility were $305 million as of
December 31, 2025, which considers the impact of $35 million in letters of credit issued to certain vendors.
In May 2020, the Company acquired DP Bluegrass LLC, a limited-purpose, bankruptcy-remote, wholly-owned subsidiary, to facilitate
a securitized financing agreement for $160 million, structured as a secured term loan (the “Term Loan I”). The Company issued Term
Loan I at a 1 % discount, resulting in net proceeds of $158 million, which were used to fund the 2020 Carbon and EQT acquisitions.
Term Loan I is secured by certain producing assets acquired in connection with these acquisitions.
Term Loan I accrued interest at an annual rate of 6.50 % and had a maturity date of May 2030. Both interest and principal payments on
Term Loan I were made on a monthly basis.
In February 2025, Term Loan I was repaid and retired from the Company’s outstanding debt.
In August 2024, the Company formed DP Yellow Jacket Holdco LLC, a limited-purpose, bankruptcy-remote, wholly-owned
subsidiary to enter into a securitized financing agreement for a $60 million term loan and a $5 million revolving loan for a total
borrowing base of $65 million (the “Term Loan II”). The proceeds from Term Loan II were used, in part, to fund the Crescent Pass
acquisition. For additional information regarding acquisitions, refer to Note 3.
In October 2024, the Company amended the Term Loan II and expanded the term loan to $83 million and the revolving loan to $12
million for a total borrowing base of $95 million. This amendment was accounted for as an extinguishment, which resulted in a loss of
$2 million, recorded in loss on early retirement of debt in the Consolidated Statements of Comprehensive Income (Loss). The
expanded borrowing capacity was used to fund a portion of the East Texas II acquisition, and the acquired assets additionally
collateralized the expanded Term Loan II.
The Term Loan II was secured by the Crescent Pass and East Texas II assets and carried an interest at SOFR plus an additional spread
ranging from 3.75 % to 4.75 % and was payable quarterly. The term loan was subject to fixed amortization with monthly principal
payments of $0.5 million beginning in February 2025 and escalating to $1 million beginning in July 2025 with the remaining unpaid
principal balance due upon maturity in August 2027. The Term Loan II was to be prepaid if the Company received cash in connection
with an issuance of equity interest or ABS monetization.
In March 2025, the Term Loan II was repaid and retired from the Company’s outstanding debt.
In November 2019, the Company formed Diversified ABS LLC (“ABS I”), a limited-purpose, bankruptcy-remote, wholly-owned
subsidiary, to issue BBB- rated asset-backed securities with a total principal amount of $200 million at par (the “ABS I Notes”). The
ABS I Notes were secured by specific upstream producing assets in the Appalachian Region owned by the Company. At the time of
the agreement, 85 % of the natural gas production from these assets was hedged through long-term derivative contracts. The ABS I
Notes carried an annual interest rate of 5 % and had a legal final maturity date of January 2037, with an amortizing maturity date of
December 2029. Both interest and principal payments on the ABS I Notes were made on a monthly basis.
In February 2025, the ABS I Notes were repaid and retired from the Company’s outstanding debt.
88
Diversified Energy Company |
In April 2020, the Company formed Diversified ABS Phase II LLC (“ABS II”), a limited-purpose, bankruptcy-remote, wholly-owned
subsidiary, to issue BBB- rated asset-backed securities with a total principal amount of $200 million (the “ABS II Notes”). The ABS II
Notes were issued at a 2.775 % discount. The Company used the net proceeds of $184 million, net of discount, capital reserve
requirement, and debt issuance costs, to reduce the outstanding balance on its Credit Facility. The ABS II Notes were secured by
specific upstream producing assets in the Appalachian Region owned by the Company. At the time of the agreement, 85 % of the
natural gas production from these assets was hedged through long-term derivative contracts. The ABS II Notes carried an annual
interest rate of 5.25 % and had a legal final maturity date of July 2037, with an amortizing maturity date of September 2028. Both
interest and principal payments on the ABS II Notes were made on a monthly basis.
In February 2025, the ABS II Notes were repaid and retired from the Company’s outstanding debt.
In February 2022, the Company formed Diversified ABS III LLC (“ABS III”), a limited-purpose, bankruptcy-remote, wholly-owned
subsidiary, to issue BBB rated asset-backed securities with a total principal amount of $365 million at par (the “ABS III Notes”). The
ABS III Notes were secured by certain upstream producing and midstream assets in the Appalachian Region owned by the Company.
The ABS III Notes carried an interest rate of 4.875 % and had a legal final maturity date of April 2039, with an amortizing maturity
date of November 2030. Both interest and principal payments on the ABS III Notes were made on a monthly basis.
In May 2025, the ABS III Notes were repaid and retired from the Company’s outstanding debt.
In February 2022, the Company formed Diversified ABS IV LLC (“ABS IV”), a limited-purpose, bankruptcy-remote, wholly-owned
subsidiary, to issue BBB rated asset-backed securities with a total principal amount of $160 million at par (the “ABS IV Notes”). The
ABS IV Notes are secured by a portion of the upstream producing assets acquired through the Blackbeard acquisition. The ABS IV
Notes carry an annual interest rate of 4.95 % and have a legal final maturity date of February 2037, with an amortizing maturity date of
September 2030. Both interest and principal payments on the ABS IV Notes are made on a monthly basis.
In May 2022, the Company formed Diversified ABS V LLC (“ABS V”), a limited-purpose, bankruptcy-remote, wholly-owned
subsidiary, to issue BBB rated asset-backed securities with a total principal amount of $445 million at par value (the “ABS V Notes”).
The ABS V Notes were secured by a majority of the Company’s remaining upstream assets in the Appalachian Region that were not
included in previous ABS transactions. The ABS V Notes carried an annual interest rate of 5.78 % and had a legal final maturity date
of May 2039, with an amortizing maturity date of December 2030. Both interest and principal payments on the ABS V Notes were
made on a monthly basis.
In May 2025, the ABS V Notes were repaid and retired from the Company’s outstanding debt.
In October 2022, the Company formed Diversified ABS VI LLC (“ABS VI”), a limited-purpose, bankruptcy-remote, wholly-owned
subsidiary, to issue, jointly with Oaktree, BBB+ rated asset-backed securities with a total principal amount of $460 million. The
Company’s share amounted to $236 million before fees, reflecting its 51.25 % ownership interest in the collateral assets (the “ABS VI
Notes”). The ABS VI Notes were issued at a 2.63 % discount and are primarily secured by the upstream assets jointly acquired with
Oaktree in the Tapstone acquisition. The Company recorded its proportionate share of the ABS VI Notes in its Consolidated Balance
Sheets. In June, 2024, as part of the Oaktree acquisition, the Company assumed Oaktree’s proportionate debt of $133 million
associated with the ABS VI Notes. For additional details regarding the Oaktree transaction, refer to Note 3.
The ABS VI Notes carry an annual interest rate of 7.50 % and have a legal final maturity date of November 2039, with an amortizing
maturity date of October 2031. Both interest and principal payments on the ABS VI Notes are made on a monthly basis.
In November 2023, the Company formed DP Lion Equity Holdco LLC (“ABS VII”), a limited-purpose, bankruptcy-remote, wholly-
owned subsidiary, to issue Class A and Class B asset-backed securities (the “Class A Notes,” Class B Notes,” and collectively the
“ABS VII Notes”). These notes are secured by certain upstream producing assets in the Appalachia Region. The Class A Notes, rated
BBB+, were issued with a total principal amount of $142 million, while the Class B Notes, rated BB-, were issued with a total
principal amount of $20 million. The Class A Notes carry an annual interest rate of 8.243 % and have a legal final maturity date of
November 2043, with an amortizing maturity date of February 2034. The Class B Notes carry an annual interest rate of 12.725 % and
have a legal final maturity date of November 2043, with an amortizing maturity date of August 2032. Both interest and principal
payments on the Class A and Class B Notes are made on a monthly basis.
89
Diversified Energy Company |
In December 2023, the Company divested 80 % of the equity ownership in ABS VII to outside investors, generating cash proceeds of
$30 million. Upon evaluating the remaining 20 % interest in ABS VII, the Company determined that the governance structure does not
allow it to exercise control, joint control, or significant influence over the entity. Consequently, ABS VII is not consolidated within the
Company’s financial statements. The Company’s remaining investment in ABS VII, initially valued at $8 million was accounted for at
fair value in accordance with ASC 321, Investments – Equity Securities, with changes in fair value recognized in net income.
In May 2024, the Company formed Diversified ABS VIII LLC (“ABS VIII”), a limited-purpose, bankruptcy-remote, wholly-owned
subsidiary, to issue Class A-1 and Class A-2 asset-backed securities (the “Class A-1 Notes,” “Class A-2 Notes,” and collectively the
“ABS VIII Notes”). The Class A-1 Notes, rated A, were issued with a total principal amount of $400 million, while the Class A-2
Notes, rated BBB+, were issued with a total principal amount of $210 million. The proceeds from these issuances were used to repay
the outstanding principal of the ABS III & ABS V notes, effectively retiring those notes from the Company’s outstanding debt.
Consequently, ABS III and ABS V were dissolved. The ABS VIII Notes are secured by the collateral that previously secured the ABS
III and ABS V notes, which includes certain upstream producing and midstream assets in the Appalachian Region owned by the
Company, and the remaining upstream assets in the Appalachian Region that were not securitized by previous ABS transactions.
The Class A-1 Notes carry an annual interest rate of 7.076 %, while the Class A-2 Notes carry an annual interest rate of 7.670 %. These
notes have a legal final maturity date of May 2044, with an amortizing maturity date of March 2033. Both interest and principal
payments on the ABS VIII Notes are made on a monthly basis.
In June 2024, the Company formed DP Mustang Holdco LLC, a limited-purpose, bankruptcy-remote, wholly-owned subsidiary (“ABS
IX,” formerly “ABS Facility Warehouse”), to secure a bridge loan facility (the “ABS Facility Warehouse Notes”). The initial draw on
the ABS Facility Warehouse Notes amounted to $71 million, which included $66 million in net proceeds, $3 million in restricted cash
interest reserve, and $2 million in debt issuance costs. The ABS Facility Warehouse Notes were secured by certain producing assets
that previously collateralized the Credit Facility. It carried an interest rate of SOFR plus an additional 3.75 % and had a legal final
maturity date of May 2029. Both interest and principal payments on the ABS Facility Warehouse Notes were made on a monthly
basis.
In September 2024, the Company issued Class A and Class B asset-backed securities (the “Class A Notes,” “Class B Notes,” and
collectively the “ABS IX Notes”) with a total principal amount of $77 million. The Class A Notes were issued with a total principal
amount of $71 million, while the Class B Notes were issued with a total principal amount of $6 million. The proceeds from these
issuances were used to repay the outstanding principal of the ABS Facility Warehouse Notes, effectively retiring it from the
Company’s outstanding debt and resulting in a loss on the early retirement of debt amounting to $2 million. The Class A Notes carry
an annual interest rate of 6.555 % and have an amortizing maturity date of December 2034. The Class B Notes carry an annual interest
rate of 11.235 % and have an amortizing maturity date of September 2030. Both interest and principal payments on the ABS IX Notes
are made on a monthly basis.
In February 2025, the Company formed Diversified ABS Phase X LLC, a limited-purpose, bankruptcy-remote, wholly-owned
subsidiary (“ABS X”), to issue Class A-1, Class A-2, and Class B asset-backed securities (the “Class A-1 Notes,” “Class A-2 Notes,”
“Class B Notes,” and collectively the “ABS X Notes”) with a total principal amount of $530 million. The Class A-1 Notes, rated A-,
were issued with a total principal amount of $200 million. The Class A-2 Notes, rated BBB, were issued with a total principal amount
of $240 million. The Class B Notes, rated BB-, were issued with a total principal amount of $90 million. The proceeds from these
issuances were used to repay the outstanding principal of the ABS I Notes, ABS II Notes, and Term Loan I, effectively retiring those
notes from the Company’s outstanding debt. The ABS X Notes are secured by certain upstream producing assets in the Appalachian
Region owned by the Company, including those that previously collateralized the ABS I Notes, ABS II Notes, and Term Loan I.
Excess proceeds from the issuance of the Notes were used to fund the Summit acquisition and for general corporate purposes. Refer to
Note 4 for additional information regarding acquisitions.
The Class A-1 Notes carry an annual interest rate of 5.945 %. The Class A-2 Notes carry an annual interest rate of 6.751 %. The Class
B Notes carry an annual interest rate of 10.398 %. These notes have a legal final maturity date of February 2045. Both interest and
principal payments on the ABS X Notes are made on a monthly basis.
In February 2025, the Company formed Maverick ABS Holdings LLC, a limited-purpose, bankruptcy-remote, wholly-owned
subsidiary (“ABS Maverick”), to hold the Class A-1, Class A-2, and Class B asset-backed securities (the “Class A-1 Notes,” “Class
A-2 Notes,” “Class B Notes,” and collectively the “ABS Maverick Notes”) assumed as part of the Maverick acquisition. These Notes
had a total principal amount of $640 million upon issuance. The Class A-1 Notes, rated A-, were issued with a total principal amount
of $285 million. The Class A-2 Notes, rated BBB+, were issued with a total principal amount of $260 million. The Class B Notes,
90
Diversified Energy Company |
rated BB-, were issued with a total principal amount of $95 million. Upon acquisition, the ABS Maverick Notes carried a 1.6 % market
premium and are secured by certain upstream producing assets in the Western Anadarko Basin acquired in the Maverick acquisition.
Refer to Note 4 for additional information regarding acquisitions.
The Class A-1 Notes carry an annual interest rate of 8.121 %. The Class A-2 Notes carry an annual interest rate of 8.946 %. The Class
B Notes carry an annual interest rate of 12.436 %. These notes have a legal final maturity date of December 2038. Both interest and
principal payments on the ABS Maverick Notes are made on a monthly basis.
In November 2025, the Company formed DP Keeneland Mile LLC, a limited-purpose, bankruptcy-remote, wholly-owned subsidiary
(“ABS XI”), to issue Class A-1, Class A-2, and Class B asset-backed securities (the “Class A-1 Notes,” “Class A-2 Notes,” “Class B
Notes,” and collectively the “ABS XI Notes”) with a total principal amount of $400 million. The Class A-1 Notes were issued with a
total principal amount of $247 million. The Class A-2 Notes were issued with a total principal amount of $91 million. The Class B
Notes were issued with a total principal amount of $62 million. The proceeds from this issuance were used to fund, in part, the Canvas
acquisition and are secured by certain upstream producing assets acquired.
The Class A-1 Notes carry an annual interest rate of 5.757 %. The Class A-2 Notes carry an annual interest rate of 6.547 %. The Class
B Notes carry an annual interest rate of 10.129 %. These notes have a legal final maturity date of November 2045. Both interest and
principal payments on the ABS XI Notes are made on a monthly basis.
In April 2025, the Company issued the Nordic Bonds, consisting of $300 million of new senior secured notes in the Nordic bond
market at a 2 % discount, resulting in net proceeds of $294 million. The proceeds were used to repay existing indebtedness and for
general corporate purposes. The Nordic Bonds mature in April 2029 and bear interest at a fixed rate of 9.75 % per annum, payable
semi-annually in arrears. The Bonds are guaranteed by the Company and secured by (i) all of the Company’s U.S. bank accounts, (ii)
the equity interests in Diversified Gas and Oil Company (“DGOC”) as well as DGOC’s equity interests in its direct operating
subsidiaries and (iii) interests in certain intercompany loans.
The Nordic Bonds contain the following financial covenants (i) the leverage ratio shall not exceed 3.5 x, (ii) the asset coverage ratio
shall not be less than 1.20 to 1.00, (iii) book equity shall not be less than $500 million, and (iv) liquidity shall not be less than 25 % of
the outstanding bonds.
The Nordic Bonds were listed for trading on the Oslo Stock Exchange in October 2025.
In June 2024, the Company partially funded the purchase price of the Oaktree acquisition with deferred consideration in the form of an
unsecured seller’s note from Oaktree (the “Oaktree Seller’s Note”). The Company issued $83 million in notes at an annual interest rate
of 8 %, with a legal final maturity date of December 2025. Deferred interest and principal payments were scheduled in three
installments: December 2024, June 2025, and December 2025.
In October 2024, the Company modified the terms of the Oaktree Seller’s Note, increasing the rate to 9 %, extending the maturity date
to September 2026, and changing the payment schedule to monthly interest and principal payments.
In April 2025, the Company used proceeds from the Nordic Bonds to repay the outstanding principal of the Oaktree Seller’s Note,
thereby retiring the notes from the Company’s outstanding debt. For additional information regarding the Oaktree transaction, refer to
Note 3.
In February 2025, the Company used proceeds from the ABS X Notes to repay the outstanding principal of the ABS I & II notes and
Term Loan I, thereby retiring the ABS I & II notes and Term Loan I from the Company’s outstanding debt and resulting in a loss on
the early retirement of debt of $27 million. Concurrently, Diversified ABS Holdings LLC, Diversified ABS Phase II Holdings LLC,
and DP Bluegrass Holdings LLC were dissolved. The ABS X Notes are secured by the collateral previously securing the ABS I & II
notes, along with a portion of the collateral previously securing Term Loan I.
In March 2025, the Company used proceeds from the upsized borrowing base on the amended and restated credit agreement governing
the Credit Facility to repay the outstanding principal on Term Loan II, thereby retiring Term Loan II from the Company’s outstanding
debt and resulting in a loss on the early retirement of debt of $0.2 million.
In May 2024, the Company utilized proceeds from the ABS VIII Notes to repay the outstanding principal of the ABS III & ABS V
notes, thereby retiring these notes from the Company’s outstanding debt. The transaction resulted in a loss on the early retirement of
debt amounting to $11 million. Concurrently, ABS III and ABS V were dissolved. The ABS VIII Notes are secured by the collateral
that previously secured the ABS III & ABS V notes.
91
Diversified Energy Company |
Credit Facility
The Credit Facility contains certain customary representations and warranties and affirmative and negative covenants, including
covenants relating to: maintenance of books and records; financial reporting and notification; compliance with laws; maintenance of
properties and insurance; and limitations on incurrence of indebtedness, liens, fundamental changes, international operations, asset
sales, making certain debt payments and amendments, restrictive agreements, investments, restricted payments and hedging. The
restricted payment provision governs the Company’s ability to make discretionary payments such as dividends, share repurchases, or
other discretionary payments. DP RBL Co LLC must comply with the following restricted payments test in order to make
discretionary payments (i) leverage is less than 1.5 x and borrowing base availability is >20 %, or (ii) leverage is between 1.5 x and
payments are prohibited.
Additional covenants require DP RBL Co LLC to maintain a ratio of total debt to EBITDAX of not more than 3.25 to 1.00 and a ratio
of current assets (with certain adjustments) to current liabilities of not less than 1.00 to 1.00 as of the last day of each fiscal quarter.
As of December 31, 2025, the Company was in compliance with all covenants for its Credit Facility.
ABS IV, VI, VIII, IX, X, XI, and Maverick Notes (Collectively, the “ABS Notes”) and the Nordic Bonds
The ABS Notes and Nordic Bonds are governed by a series of covenants and restrictions typical for such transactions, including (i) the
requirement for the issuer to maintain specified reserve accounts to ensure the payment of interest on the ABS Notes and Nordic Bond,
(ii) provisions for optional and mandatory prepayments, specified make-whole payments under certain conditions, (iii) indemnification
payments in the event that the assets pledged as collateral for the ABS Notes and Nordic Bond are found to be defective or ineffective,
(iv) covenants related to recordkeeping, access to information and similar matters, and (v) compliance with all applicable laws and
regulations, including the Employee Retirement Income Security Act (“ERISA”), environmental laws, and the USA Patriot Act (ABS
IV only).
The ABS Notes and Nordic Bonds are also subject to customary accelerated amortization events as outlined in the indenture. These
events include failure to maintain specified debt service coverage ratios, failure to meet certain production metrics, certain change of
control and management termination events, and the failure to repay or refinance the ABS Notes and Nordic Bond on the applicable
scheduled maturity date.
Additionally, the ABS Notes and Nordic Bonds are subject to customary events of default, which include non-payment of required
interest, principal, or other amounts due, failure to comply with covenants within specified time frames, certain bankruptcy events,
breaches of specified representations and warranties, failure of security interests to be effective, and certain judgments.
As of December 31, 2025 the Company was in compliance with all covenants related to the ABS Notes and Nordic Bonds.
financing costs, premiums, and discounts:
(in thousands) | 2026 | 2027 | 2028 | 2029 | 2030 | Thereafter | Total debt |
Debt maturity | $ | $ | $ | $ | $ | $ | $ |
For the Year Ended December 31, | |||
(In thousands) | 2025 | 2024 | 2023 |
Interest incurred | |||
Borrowings | $ | $ | $ |
Other | |||
Total interest incurred | |||
LESS: Capitalized interest | |||
Interest expense | $ | $ | $ |
92
Diversified Energy Company |
As of December 31, | ||
(in thousands) | 2025 | 2024 |
Credit Facility(a) | $ | $ |
Term Loans(b) | ||
ABS notes(b) | ||
Nordic Bond(b) | ||
Other miscellaneous borrowings(a) | ||
Total fair value of outstanding debt | $ | $ |
(a)Carrying value approximates fair value.
(b)Fair values are measured using a market approach, based upon market rates, which are Level 2 inputs.
All accounts payable and accrued liabilities are classified as current liabilities and are expected to be settled within one year from the
balance sheet date. These obligations are unsecured, non-interest bearing, and are typically settled in the normal course of business.
The carrying amounts approximate fair value due to the short-term nature of these liabilities. There are no material amounts past due
or in dispute as of the balance sheet date. The table below details the Company’s accounts payable and accrued liabilities as of the
periods presented:
As of December 31, | ||
(in thousands) | 2025 | 2024 |
Accounts payable | $ | $ |
Accrued operating expense | ||
Accrued compensation expense | ||
Accrued capital expenditures | ||
Other accrued liabilities | ||
Total accounts payable & accrued liabilities | $ | $ |
As of December 31, | ||
(in thousands) | 2025 | 2024 |
Other current liabilities | ||
Taxes payable | $ | $ |
Operating lease liabilities | ||
Financing lease liabilities | ||
Current portion of ARO | ||
Other current liabilities | ||
Total other current liabilities | $ | $ |
Other noncurrent liabilities | ||
Operating lease liabilities | $ | $ |
Financing lease liabilities | ||
Deferred tax liability | ||
Other noncurrent liabilities | ||
Total other noncurrent liabilities | $ | $ |
93
Diversified Energy Company |
principal or most advantageous market for the asset or liability in an orderly transaction between market participants on the
measurement date. Valuation techniques used to measure fair value must maximize the use of observable inputs and minimize the use
of unobservable inputs. To determine fair value, the Company applies a hierarchy that consists of three input levels. The first and
second levels are regarded as observable, while the third is categorized as unobservable. These input levels may be utilized in the
measurement of fair value as outlined below:
Level 1: | Inputs are unadjusted, quoted prices in active markets for identical assets or liabilities at the measurement date. | ||
Level 2: | Inputs (other than quoted prices included in Level 1) can include the following: | ||
(1) Observable prices in active markets for similar assets or liabilities;
(2) Prices for identical assets or liabilities in markets that are not active;
(3) Directly observable market inputs for substantially the full term of the asset or liability; and
(4) Market inputs that are not directly observable but are derived from or corroborated by observable market data.
Level 3: | Unobservable inputs which reflect the Company’s best estimates of what market participants would use in pricing the asset or liability at the measurement date. | ||
There were no transfers between fair value levels for the year ended December 31, 2025.
Derivatives
The Company measures the fair value of its derivatives in accordance with ASC 820, Fair Value Measurement, utilizing valuation
models that incorporate observable market inputs whenever available. These inputs typically include contractual terms, current market
prices, forward price curves for natural gas, liquids, and oil, relevant interest rate yield curves (such as U.S. Treasury and SOFR), and
volatility factors.
Derivatives are classified within the fair value hierarchy based on the observability of the inputs used in the valuation. The Company’s
fixed price swaps are classified as Level 2 and are valued using third-party discounted cash flow models, which rely on NYMEX
futures for natural gas and oil derivatives and OPIS forward curves for NGL derivatives. Interest rate derivatives, also classified as
Level 2, are valued using discounted cash flow models that incorporate contracted notional amounts, market-quoted SOFR yield
curves, and credit-adjusted risk-free rates.
Options, including call options, put options, and collars, are classified as Level 2 and valued using the Black-Scholes option pricing
model. This model incorporates contract terms such as maturity, market parameters including NYMEX and OPIS futures, interest
rates, volatility, and counterparty credit risk. Volatility and other significant inputs are obtained from independent third-party pricing
sources and are subject to monthly verification.
Basis swaps are classified as Level 2 and are valued using third-party models based on forward commodity price curves.
Changes in key inputs, such as volatility, may result in changes to the fair value measurement of the Company’s derivatives.
As of December 31, 2025 | |||
(in thousands) | Level 1 | Level 2 | Level 3 |
Assets | |||
Derivatives | |||
Liabilities | |||
Derivatives | ( | ||
Total net assets (liabilities) | $ | $( | $ |
94
Diversified Energy Company |
As of December 31, 2024 | |||
(in thousands) | Level 1 | Level 2 | Level 3 |
Assets | |||
Derivatives | |||
Liabilities | |||
Derivatives | ( | ||
Total net assets (liabilities) | $ | $( | $ |
Impairment of Proved Natural Gas & Oil Properties
When impairment occurs, the Company estimates the fair value of the impaired proved natural gas and oil properties through a
discounted cash flow method, which incorporates Level 3 inputs that are not directly observable.
Business combinations
The Company assesses the value of acquired proved properties using an income-based approach as of the acquisition date. This
method is classified as a Level 3 fair value estimate due to its reliance on key assumptions, such as anticipated production volumes,
future commodity pricing, operating costs, weighted average cost of capital (the discount rate) and risk adjustments tailored to the
The carrying values of cash and cash equivalents, accounts receivable, other current assets, accounts payable, accrued liabilities, and
other current liabilities approximate fair value due to the highly liquid or short-term nature. The Company’s Credit Facility (see Note
15) has a recorded value that approximates fair market value, as it bears interest at a floating rate that approximates a current market
rate.
Delivery Commitments
We have contractually agreed to deliver firm quantities of natural gas to various customers, which we expect to fulfill with production
from existing reserves. To ensure we meet these commitments, we regularly monitor our proved developed reserves.
December 31, 2025.
2026 | 2027 | 2028 | 2029 | 2030 | Thereafter | Total | |
Natural gas (MMcf) |
Litigation and Regulatory Proceedings
The Company is involved in various pending legal issues that have arisen in the ordinary course of business. The Company accrues for
litigation, claims, and proceedings when a liability is both probable and the amount can be reasonably estimated. As of December 31,
2025 and 2024, the Company did not
For any matters not accrued for, it is not possible to estimate the amount of any additional loss or range of loss that is reasonably
possible. However, based on the nature of the claims, management believes that current litigation, claims, and proceedings are not,
individually or in aggregate, after considering insurance coverage and indemnification, likely to have a material adverse impact on the
Company’s financial position, results of operations, or cash flows.
The Company has no other contingent liabilities that would have a material impact on the Company’s financial position, results of
operations, or cash flows.
Environmental Matters
The Company’s operations are subject to environmental laws and regulations in all the jurisdictions where it operates, and it was in
compliance as of December 31, 2025 and 2024. However, the Company is unable to predict the impact of additional environmental
laws and regulations that may be adopted in the future, including whether they would adversely affect its operations. The Company
can offer no assurance regarding the significance or cost of compliance associated with any new environmental legislation or
95
Diversified Energy Company |
For the Year Ended December 31, | |||
(in thousands) | 2025 | 2024 | 2023 |
Supplemental cash flow information: | |||
Cash paid for interest | $ | $ | $ |
Cash paid for income taxes | |||
Cash paid for amounts included in the measurement of operating lease liabilities | |||
Cash paid for amounts included in the measurement of finance lease liabilities | |||
Supplemental disclosure of non-cash transactions: | |||
Issuance of common stock for acquisitions | $ | $ | $ |
Additions to asset retirement obligations | |||
Right-of-use assets obtained in exchange for operating lease liabilities | |||
Right-of-use assets obtained in exchange for finance lease liabilities | |||
Cash paid for amounts included in the measurement of operating lease liabilities represents total lease payments made during the
period. For finance leases, cash paid for amounts included in the measurement of lease liabilities represents the principal portion of
lease payments. Interest paid on finance leases is included in cash paid for interest.
For additional information regarding income taxes, stockholders’ equity, ARO, leases, and interest, see Notes 4, 11, 13, 14, and 15,
respectively.
In connection with the Company’s transition from International Financial Reporting Standards (“IFRS”) to U.S. GAAP, the quarterly
financial information for the fiscal year ended December 31, 2025 has been prepared and presented for the first time on a U.S. GAAP
basis. As all quarterly amounts reflect the application of U.S. GAAP to periods previously reported only on an IFRS basis, the
summarized quarterly financial information below represents the Company’s initial presentation of U.S. GAAP quarterly results.
For the Three Months Ended | ||||
(in thousands, except per share data) | March 31, 2025 | June 30, 2025 | September 30, 2025 | December 31, 2025 |
Total revenue | $ | $ | $ | $ |
Income (loss) from operations | ( | |||
Net income (loss) attributable to DEC | ( | |||
EPS | ||||
Basic | $( | $ | $ | $ |
Diluted | ( | |||
The Company has evaluated subsequent events occurring after December 31, 2025, through February 26, 2026, the date the financial
statements were issued. The following material transactions occurred subsequent to year-end:
Subsequent to December 31, 2025, in February 2026, the Company’s board of directors declared a cash dividend on the Company’s
common stock in the amount of $0.29 per share. The dividend is payable on June 30, 2026, to stockholders on record as of the close of
business on May 29, 2026.
Subsequent to December 31, 2025, in February 2026, the Company issued an additional $200 million in Nordic Bonds, increasing the
aggregate principal amount of the outstanding Nordic Bonds to $500 million.
Subsequent to December 31, 2025, in February 2026, the Company announced that it entered into an agreement to acquire certain
producing properties from Sheridan Production Company for an estimated gross purchase price of $245 million before customary
purchase price adjustments. The transaction is expected to close in the second quarter of 2026.
96
Diversified Energy Company |
Supplemental Natural Gas & Oil Information (Unaudited)
Estimated Reserves
The process of estimating quantities of “proved” and “proved developed” reserves is very complex, requiring significant subjective
decisions in the evaluation of all available geological, engineering, and economic data for each reservoir. The data for a given
reservoir may also change substantially over time as a result of numerous factors, including additional development activity, evolving
production history, and continual reassessment of the viability of production under varying economic conditions. As a result, revisions
to existing reserves estimates may occur from time to time.
Although every reasonable effort is made to ensure that reserves estimates reported represent the most accurate assessments possible,
the subjective decisions and variances in available data for various reservoirs make these estimates generally less precise than other
estimates included in the financial statement disclosures.
For each of the years ended December 31, 2025, 2024 and 2023, the estimated proved reserves were independently evaluated by our
independent reserves auditors, NSAI, in accordance with petroleum engineering and evaluation standards published by the Society of
Petroleum Evaluation Engineers and definitions and guidelines established by the SEC. Accordingly, the following reserves estimates
are based on existing economic and operating conditions. Reserves estimates are inherently imprecise, and the Company’s reserves
estimates are generally based on extrapolation of historical production trends. Existing economic conditions include prices and costs at
which economic producibility from a reservoir is to be determined. Based on reserve reporting rules, the price is calculated using the
average price during the 12-month period prior to the ending date of the period covered by the report, determined as an unweighted
arithmetic average of the first-day-of-the-month price for each month within the period, unless prices are defined by contractual
arrangements, excluding escalations based upon future conditions. Therefore, the Company’s estimates are expected to change, and
such changes could be material and occur in the near term as future information becomes available.
The following table summarizes the changes in the Company’s net proved reserves for the periods presented, all of which were located
in the U.S.:
Natural Gas | NGLs | Oil | Total | |
(MMcf) | (MBbls) | (MBbls) | (MMcfe)(a) | |
As of December 31, 2022 | 4,349,611 | 101,931 | 14,830 | 5,050,177 |
Revisions of previous estimates(b) | (658,917) | 153 | (230) | (659,379) |
Extensions, discoveries and other additions | 712 | — | 50 | 1,012 |
Production | (256,378) | (5,832) | (1,377) | (299,632) |
Purchase of reserves in place(c) | 105,713 | 2,592 | 923 | 126,803 |
Sales of reserves in place(d) | (340,697) | (3,143) | (1,580) | (369,035) |
As of December 31, 2023 | 3,200,044 | 95,701 | 12,616 | 3,849,946 |
Revisions of previous estimates(b) | (212,056) | 11,305 | 6,215 | (106,936) |
Extensions, discoveries and other additions | 897 | 32 | 33 | 1,287 |
Production | (244,298) | (5,980) | (1,568) | (289,586) |
Purchase of reserves in place(c) | 151,210 | 2,413 | 1,228 | 173,056 |
Sales of reserves in place(d) | (178) | — | — | (178) |
As of December 31, 2024 | 2,895,619 | 103,471 | 18,524 | 3,627,589 |
Revisions of previous estimates(b) | 777,934 | 1,521 | 1,076 | 793,516 |
Extensions, discoveries and other additions | 16,341 | — | — | 16,341 |
Production | (295,723) | (8,821) | (7,935) | (396,259) |
Purchase of reserves in place(c) | 1,031,562 | 68,804 | 99,485 | 2,041,296 |
Sales of reserves in place(d) | — | — | — | — |
As of December 31, 2025 | 4,425,733 | 164,975 | 111,150 | 6,082,483 |
(a)The basis for converting oil and NGL volumes (MBbls) to natural gas equivalent volumes (MMcfe) is determined by using the
ratio of one Bbl of oil or NGLs to six Mcf of natural gas.
(b)During 2025, commodity market pricing increased driving a net upward revision of 793,516 MMcfe. During 2024, commodity
market pricing decreased driving a net downward revision of 106,936 MMcfe. During 2023, commodity market pricing decreased
significantly driving a net downward revision of 659,379 MMcfe.
(c)During 2025, purchases of reserves in place were primarily related to the Canvas, Maverick, and Summit acquisitions. During
2024, purchases of reserves in place were primarily related to the Oaktree, Crescent Pass, and East Texas II acquisitions. During
97
Diversified Energy Company |
2023,purchases of reserves in place were primarily related to the Tanos II acquisition. For additional information about
acquisitions, refer to Note 3.
(d)During 2025, 2024 and 2023, sales of reserves in place were primarily related to divestitures of non-core assets. For additional
information about divestitures, refer to Note 3.
Natural Gas | NGLs | Oil | Total | |
(MMcf) | (MBbls) | (MBbls) | (MMcfe)(a) | |
Total proved reserves as of: | ||||
December 31, 2022 | 4,349,611 | 101,931 | 14,830 | 5,050,177 |
December 31, 2023 | 3,200,044 | 95,701 | 12,616 | 3,849,946 |
December 31, 2024 | 2,895,619 | 103,471 | 18,524 | 3,627,589 |
December 31, 2025 | 4,425,733 | 164,975 | 111,150 | 6,082,483 |
Total proved developed reserves as of: | ||||
December 31, 2022 | 4,340,779 | 101,931 | 14,830 | 5,041,345 |
December 31, 2023 | 3,184,499 | 94,391 | 12,380 | 3,825,125 |
December 31, 2024 | 2,895,619 | 103,471 | 18,524 | 3,627,589 |
December 31, 2025 | 4,224,112 | 159,025 | 87,041 | 5,700,508 |
Total proved undeveloped reserves as of: | ||||
December 31, 2022 | 8,832 | — | — | 8,832 |
December 31, 2023 | 15,545 | 1,310 | 236 | 24,821 |
December 31, 2024 | — | — | — | — |
December 31, 2025 | 201,621 | 5,950 | 24,109 | 381,975 |
(a)The basis for converting oil and NGL volumes (MBbls) to natural gas equivalent volumes (MMcfe) is determined by using the
ratio of one Bbl of oil or NGLs to six Mcf of natural gas.
Capitalized Costs Relating to Natural Gas and Oil Producing Activities
Capitalized costs relating to natural gas and oil producing activities and related accumulated depreciation, depletion and amortization
were as follows:
For the Year Ended December 31, | |||
(in thousands) | 2025 | 2024 | 2023 |
Proved properties | $5,808,908 | $3,807,670 | $3,176,808 |
Unproved properties | 19,804 | 7,266 | 8,032 |
Total capitalized costs | 5,828,712 | 3,814,936 | 3,184,840 |
Less: Accumulated depletion | (1,320,953) | (981,715) | (747,202) |
Net capitalized costs | $4,507,759 | $2,833,221 | $2,437,638 |
Costs Incurred in Natural Gas and Oil Property Acquisition, Exploration and Development Activities
Costs incurred in natural gas and oil property acquisition, exploration and development activities were as follows:
For the Year Ended December 31, | |||
(in thousands) | 2025 | 2024 | 2023 |
Proved properties | $1,824,666 | $455,514 | $76,226 |
Unproved properties | 77,478 | 13,886 | 2,356 |
Total property acquisition costs | 1,902,144 | 469,400 | 78,582 |
Total exploration and development costs | 92,163 | 4,587 | 10,923 |
Capitalized interest | — | — | — |
Total costs | $1,994,307 | $473,987 | $89,505 |
98
Diversified Energy Company |
Results of Operations for Producing Activities
Revenues and expenses related to the production and sale of natural gas, NGLs, and oil were as follows:
For the Year Ended December 31, | |||
(in thousands) | 2025 | 2024 | 2023 |
Commodity revenue | $1,538,821 | $732,259 | $802,399 |
Operating expense | (644,786) | (339,086) | (349,478) |
Depreciation, depletion, amortization & accretion | (457,545) | (284,048) | (248,098) |
Results of operations | 436,490 | 109,125 | 204,823 |
Income tax benefit (expense) | 95,155 | 23,353 | (49,567) |
Results of operations, net of income tax benefit (expense) | $531,645 | $132,478 | $155,256 |
Standardized Measure of Discounted Future Net Cash Flows
The following information has been developed based on natural gas and crude oil reserves and production volumes estimated by the
Company’s engineering staff. While it can be used for some comparisons, it should not be the sole method for evaluating the
Company or its performance. Additionally, the following information may not represent realistic assessments of future cash flows, nor
should the Standardized Measure of Discounted Future Net Cash Flows (the “Standardized Measure”) be viewed as representative of
the current value of the Company.
The Company believes that the following factors should be considered when reviewing the information:
•Future costs and selling prices will differ from those required to be used in these calculations;
•Due to future market conditions and governmental regulations, actual rates of production in future years may vary significantly
from the rate of production assumed in the calculations;
•The selection of a 10% discount rate is arbitrary and may not be a reasonable measure of the relative risk associated with realizing
future net natural gas and oil revenues; and
•Future net cash flows may be subject to different rates of income taxation.
Under the Standardized Measure, future cash inflows were estimated by using the 12-month average index price for the respective
commodity, calculated as the unweighted arithmetic average of the first day of the month price for each month during the year. Prices
used for the Standardized Measure (adjusted for basis and quality differentials) were as follows:
For the Year Ended December 31, | |||
2025 | 2024 | 2023 | |
Natural gas (Mcf) | $3.09 | $1.83 | $2.49 |
NGLs (Bbls) | 17.54 | 20.02 | 21.59 |
Oil (Bbls) | 64.26 | 74.76 | 71.89 |
Future cash inflows were reduced by estimated future development and production costs based on year-end costs to arrive at net cash
flow before tax. Future income tax expense was computed by applying year-end statutory tax rates to future pretax net cash flows, less
the tax basis of the properties involved and the utilization of available tax carryforwards related to natural gas and oil operations. The
applicable accounting standards require the use of a 10% discount rate.
Management does not solely rely on the following information when making investment and operating decisions. These decisions are
based on a number of factors, including estimates of proved reserves and varying price and cost assumptions that are considered more
representative of a range of anticipated economic conditions. The Standardized Measure is as follows:
99
Diversified Energy Company |
For the Year Ended December 31, | |||
(in thousands) | 2025 | 2024 | 2023 |
Future cash inflows | $23,713,859 | $8,600,093 | $10,900,742 |
Future production costs | (10,492,260) | (4,497,171) | (5,345,117) |
Future development costs(a) | (5,379,265) | (2,655,256) | (1,937,293) |
Future income tax expense | (1,619,405) | (303,892) | (653,216) |
Undiscounted future net cash flows(b) | 6,222,929 | 1,143,774 | 2,965,116 |
10% annual discount for estimated timing of cash flows(b) | (2,040,445) | 253,147 | (1,219,580) |
Standardized Measure | $4,182,484 | $1,396,921 | $1,745,536 |
(a)Includes $3,646 million, $2,465 million and $1,716 million in asset retirement costs for the years ended December 31, 2025, 2024
and 2023, respectively.
(b)For the year ended December 31, 2024, the PV-10 value is higher than the total undiscounted future net cash flows and the 10%
annual discount is positive due to the Company’s estimated future abandonment costs associated with proved reserves. As the
anticipated timing of the majority of these abandonment costs is many years in the future, these costs have a much larger impact
on the undiscounted future net cash flows as compared to their impact when discounting is applied. Due to this fact, as well as
relatively lower 2024 SEC pricing, the undiscounted future net cash flows were lower than the discounted pre-tax PV-10 value for
the year ended December 31, 2024.
Future cash inflows were reduced by estimated future production and development costs based on year-end costs to determine pre-tax
cash inflows. Future income taxes were computed by applying the year-end statutory tax rate to the excess of pre-tax cash inflows over
the Company’s tax basis in the associated proved natural gas and oil properties, after accounting for permanent differences and tax
credits.
Changes in the Standardized Measure were as follows:
For the Year Ended December 31, | |||
(in thousands) | 2025 | 2024 | 2023 |
Standardized Measure, beginning of year | $1,396,921 | $1,745,536 | $6,743,100 |
Sales and transfers of natural gas and oil produced, net of production costs | (879,252) | (374,104) | (431,629) |
Net changes in prices and production costs | 1,439,378 | (804,229) | (5,850,625) |
Extensions, discoveries, and other additions, net of future production and development costs | (283,207) | (77,393) | (13,682) |
Acquisition of reserves in place | 2,869,296 | 407,175 | 122,613 |
Divestiture of reserves in place | — | (27) | (377,097) |
Revisions of previous quantity estimates | 605,424 | (344) | (1,224,544) |
Net change in income taxes | (802,115) | 199,303 | 1,688,208 |
Previously estimated development costs incurred during the year | — | 12,676 | — |
Changes in production rates (timing) and other | (323,138) | 56,610 | 206,646 |
Accretion of discount | 159,177 | 231,718 | 882,546 |
Standardized Measure, end of year | $4,182,484 | $1,396,921 | $1,745,536 |
100
Form 10-K | Diversified Energy Company |
Item 9. Changes in and Disagreements With Accountants on Accounting and Financial
Disclosure
Not applicable.
Item 9A. Controls and Procedures
Evaluation of Disclosure Controls and Procedures
The Company maintains disclosure controls and procedures, as defined in U.S. Securities Exchange Act of 1934, as amended
(“Exchange Act”) Rule 13a-15(e), that are designed to ensure that information required to be disclosed in our reports filed or
submitted under the Exchange Act is recorded, processed, summarized and reported within the time periods specified in the rules and
forms of the SEC, and such information is accumulated and communicated to our management, including our Chief Executive Officer
and Chief Financial Officer, as appropriate to allow timely decisions regarding required disclosure. The Chief Executive Officer and
Chief Financial Officer, with the participation of management, have evaluated the effectiveness of the Company’s disclosure controls
and procedures in relation to Exchange Act Rule 13a-15(b), and have concluded that the Company’s disclosure controls and
procedures were effective as of December 31, 2025.
Management’s Annual Report on Internal Control Over Financial Reporting
Management is responsible for establishing and maintaining adequate internal control over financial reporting. Internal control over
financial reporting is a process, designed by, or under the supervision of, the Chief Executive Officer and Chief Financial Officer, or
persons performing similar functions, and effected by the Company’s board of directors, management and other personnel to provide
reasonable assurance regarding the reliability of financial reporting and the preparation of financial statements for external purposes in
accordance with generally accepted accounting principles. The Company’s internal control over financial reporting includes those
policies and procedures that:
•Pertain to the maintenance of records that in reasonable detail accurately and fairly reflect the transactions and dispositions of the
assets of the Company;
•Provide reasonable assurances that transactions are recorded as necessary to permit the preparation of financial statements in
accordance with generally accepted accounting principles, and that receipts and expenditures of the Company are being made
only in accordance with the authorizations of management and Directors of the Company; and
•Provide reasonable assurance regarding the prevention or timely detection of unauthorized acquisition, use, or disposition of the
Company’s assets that could have a material effect on its financial statements.
Because of its inherent limitations, internal control over financial reporting may not prevent or detect misstatements. Also, projections
of any evaluation of effectiveness to future periods are subject to the risk that controls may become inadequate because of changes in
conditions, or that the degree of compliance with policies and procedures may deteriorate.
Management of the Company evaluated the effectiveness of the Company’s internal control over financial reporting as of
December 31, 2025 based on criteria established in the Internal Control-Integrated Framework (2013), issued by the Committee of
Sponsoring Organizations of the Treadway Commission.
Following this evaluation, management concluded that the Company’s internal control over financial reporting was effective as of
December 31, 2025.
Management’s assessment and conclusion on the effectiveness of the Company’s internal control over financial reporting as of
December 31, 2025 excludes an assessment of the internal control over financial reporting of Canvas Energy, which was acquired in
2025. Canvas Energy is included in our consolidated financial statements and represented approximately 9% of our total assets as of
December 31, 2025 and approximately 1% of our consolidated revenues for the year ended December 31, 2025.
The effectiveness of the Company’s internal control over financial reporting as of December 31, 2025, has been audited by
PricewaterhouseCoopers LLP, an independent registered public accounting firm, as stated in their report which appears under Item 8
within this Annual Report on Form 10-K.
Changes in Internal Controls Over Financial Reporting
There were no changes in our internal control over financial reporting during the quarter ended December 31, 2025, which materially
affected, or were reasonably likely to materially affect, our internal control over financial reporting.
Item 9B. Other Information
Our directors and executive officers may from time to time enter into plans or other arrangements for the purchase or sale of our
shares that are intended to satisfy the affirmative defense conditions of Rule 10b5–1(c) or may represent a non-Rule 10b5-1 trading
101
Form 10-K | Diversified Energy Company |
arrangement under the Exchange Act. During the quarter ended December 31, 2025, no such plans or other arrangements were
Item 9C. Disclosure Regarding Foreign Jurisdictions that Prevent Inspections
Not applicable.
PART III
Item 10. Directors, Executive Officers and Corporate Governance
The information required by this item is incorporated herein by reference to our definitive proxy statement which will be filed with the
SEC within 120 days after December 31, 2025.
We have adopted a Code of Business Conduct & Ethics (the “Code of Conduct”) that applies to all of our and our subsidiaries’
directors, officers, employees, and business partners, including our principal executive, principal financial and principal accounting
officers, or persons performing similar functions. Our Code of Conduct is posted on our website located at https://www.div.energy/
about-us/corporate-governance/. We will satisfy any disclosure requirement under Item 5.05 of Form 8-K regarding an amendment to,
or waiver from, any provision of the Code of Conduct by disclosing the nature of that amendment or waiver on its website within four
business days following the date of the amendment or waiver.
Item 11. Executive Compensation
The information required by this item is incorporated herein by reference to our definitive proxy statement which will be filed with the
SEC within 120 days after December 31, 2025.
Item 12. Security Ownership of Certain Beneficial Owners and Management and Related
Stockholder Matters
The information required by this item is incorporated herein by reference to our definitive proxy statement which will be filed with the
SEC within 120 days after December 31, 2025.
Item 13. Certain Relationships and Related Transactions, and Director Independence
The information required by this item is incorporated herein by reference to our definitive proxy statement which will be filed with the
SEC within 120 days after December 31, 2025.
Item 14. Principal Accountant Fees and Services
The information required by this item is incorporated herein by reference to our definitive proxy statement which will be filed with the
SEC within 120 days after December 31, 2025.
102
Form 10-K | Diversified Energy Company |
PART IV
Item 15. Exhibits and Financial Statement Schedules
(a)The following documents are filed as part of this Annual Report on Form 10-K:
(1)Financial Statements. Financial statements are listed in the index included in Part II. Item 8. Financial Statements and
(2)Financial Statement Schedules. No financial statement schedules are applicable or required.
(3)Exhibits. The exhibits listed in the accompanying Exhibit Index are filed or incorporated by reference as part of this Annual
Report on Form 10-K.
(b)Exhibits. The exhibits required by Item 601 of Regulation S-K are listed in the Exhibit Index, which is incorporated herein by
reference.
Exhibit No. | Incorporated by reference | Filed | Furnished | ||||
Description | Form | Exhibit | Filing Date | Herewith | Only | ||
2.1 | † | 6-K File No. 001-41870 | 99.1 | 1/27/2025 | |||
2.2 | † | 6-K File No. 001-41870 | 99.2 | 9/9/2025 | |||
3.1 | 8-K File No. 001-41870 | 3.1 | 11/24/2025 | ||||
3.2 | 8-K File No. 001-41870 | 3.2 | 11/24/2025 | ||||
4.1 | 8-K File No. 001-41870 | 4.1 | 11/24/2025 | ||||
4.2 | † | 20FR12B File No. 001-41870 | 4.28 | 11/16/2023 | |||
4.3 | † | 20FR12B File No. 001-41870 | 4.30 | 11/16/2023 | |||
4.4 | † | 20FR12B/ A File No. 001-41870 | 4.31 | 12/8/2023 | |||
4.5 | † | F-1 File No. 333-281669 | 4.8 | 8/20/2024 | |||
4.6 | † | 20-F File No. 001-41870 | 4.5 | 3/17/2025 | |||
103
Form 10-K | Diversified Energy Company |
Exhibit No. | Incorporated by reference | Filed | Furnished | ||||
Description | Form | Exhibit | Filing Date | Herewith | Only | ||
4.7 | † | 20-F File No. 001-41870 | 4.13 | 3/17/2025 | |||
4.8 | † | ü | |||||
4.9 | † | ü | |||||
4.10 | 8-K File No. 001-41870 | 4.1 | 2/10/2026 | ||||
4.11 | 8-K File No. 001-41870 | 4.2 | 2/10/2026 | ||||
4.12 | † | ü | |||||
4.13 | † | ü | |||||
10.2 | † | F-1 File No. 333-281669 | 10.32 | 8/20/2024 | |||
10.3 | † | 20-F File No. 001-41870 | 4.14 | 3/17/2025 | |||
10.4 | * | S-8 File No. 333-287374 | 4.1 | 5/16/2025 | |||
10.5 | * | 8-K File No. 001-41870 | 10.1 | 11/24/2025 | |||
10.6 | * | 8-K File No. 001-41870 | 10.2 | 11/24/2025 | |||
104
Form 10-K | Diversified Energy Company |
Exhibit No. | Incorporated by reference | Filed | Furnished | ||||
Description | Form | Exhibit | Filing Date | Herewith | Only | ||
10.7 | † | 20-F File No. 001-41870 | 4.16 | 3/17/2025 | |||
10.8 | ü | ||||||
10.9 | 6-K File No. 001-41870 | 10.1 | 10/9/2025 | ||||
10.10 | * | ü | |||||
10.11 | * | ü | |||||
10.12 | * | 8-K File No. 001-41870 | 10.1 | 1/7/2026 | |||
10.13 | * | ü | |||||
10.14 | * | ü | |||||
10.15 | * | ü | |||||
10.16 | * | ü | |||||
10.17 | * | ü | |||||
10.18 | * | ü | |||||
19.1 | ü | ||||||
21.1 | ü | ||||||
23.1 | ü | ||||||
23.2 | ü | ||||||
31.1 | ü | ||||||
31.2 | ü | ||||||
32.1 | ü | ||||||
97.1 | ü | ||||||
105
Form 10-K | Diversified Energy Company |
Exhibit No. | Incorporated by reference | Filed | Furnished | ||||
Description | Form | Exhibit | Filing Date | Herewith | Only | ||
99.1 | ü | ||||||
101 | Interactive Data File. The instance document does not appear in the Interactive Data File because its XBRL tags are embedded within the Inline XBRL document. | ||||||
104 | Cover Page Interactive Data File (formatted as Inline XBRL and contained in Exhibit 101) | ||||||
* | Management contract or compensatory plan or arrangement. |
† | Certain schedules and attachments have been omitted. The registrant hereby undertakes to provide further information regarding such omitted materials to the Securities and Exchange Commission upon request. |
Item 16. Form 10-K Summary
Not applicable.
Signatures
Pursuant to the requirements of Section 13 or 15(d) of the Securities Exchange Act of 1934, the registrant has duly caused this Annual
Report on Form 10-K to be signed on its behalf by the undersigned, thereunto duly authorized, on February 26, 2026.
DIVERSIFIED ENERGY COMPANY | |||
(Registrant) | |||
/s/ Rusty Hutson, Jr. | |||
Robert R. “Rusty” Hutson, Jr. | |||
Chief Executive Officer |
Pursuant to the requirements of the Securities Exchange Act of 1934, this report has been signed below by the following persons on
behalf of the registrant and in the capacities indicated on February 26, 2026.
/s/ Rusty Hutson, Jr. | Chief Executive Officer and Director | ||
Robert R. “Rusty” Hutson, Jr. | (Principal Executive Officer) | ||
/s/ Bradley G. Gray | President and Chief Financial Officer | ||
Bradley G. Gray | (Principal Financial Officer) | ||
/s/ Michael Garrett | SVP & Chief Accounting Officer | ||
Michael Garrett | (Principal Accounting Officer) | ||
/s/ David E. Johnson | Chairman of the Board | ||
David E. Johnson | |||
/s/ Kathryn Z. Klaber | Director | ||
Kathryn Z. Klaber | |||
/s/ Martin K. Thomas | Director | ||
Martin K. Thomas | |||
/s/ David J. Turner, Jr. | Director | ||
David J. Turner, Jr. |